| Param | Original file | Final file |
|---|---|---|
| Filename | modeM0/AS1A10_071T15_9000004346_30211cztM0_level2.evt | modeM0/AS1A10_071T15_9000004346_30211cztM0_level2_quad_clean.evt |
| Size (bytes) | 524,793,600 | 76,752,000 |
| Size | 500.5 MB | 73.2 MB |
| Events in quadrant A | 3,217,634 | 482,170 |
| Events in quadrant B | 4,936,160 | 490,156 |
| Events in quadrant C | 3,234,969 | 462,985 |
| Events in quadrant D | 4,074,475 | 445,589 |
| Mode SS | |||
|---|---|---|---|
| Quadrant | BADHDUFLAG | Total packets | Discarded packets |
| A | 0 | 130 | 0 |
| B | 0 | 130 | 0 |
| C | 0 | 130 | 0 |
| D | 0 | 130 | 0 |
| Mode M0 | |||
|---|---|---|---|
| Quadrant | BADHDUFLAG | Total packets | Discarded packets |
| A | 0 | 13240 | 2 |
| B | 0 | 19182 | 2 |
| C | 0 | 13283 | 2 |
| D | 0 | 16141 | 2 |
| Mode M9 | |||
|---|---|---|---|
| Quadrant | BADHDUFLAG | Total packets | Discarded packets |
| A | 0 | 19 | 0 |
| B | 0 | 20 | 0 |
| C | 0 | 20 | 0 |
| D | 0 | 20 | 0 |
| Quadrant | Total seconds | Saturated seconds | Saturation percentage |
|---|---|---|---|
| A | 6347 | 30 | 0.472664% |
| B | 6347 | 59 | 0.929573% |
| C | 6347 | 59 | 0.929573% |
| D | 6347 | 85 | 1.339215% |
Noise dominated data is calculated using 1-second bins in cleaned event files. If a bin has >2000 counts, and if more than 50% of those come from <1% of pixels, then it is considered to be noise-dominated and hence unusable.
| Quadrant | # 1 sec bins | Bins with >0 counts | Bins with >2000 counts | High rate bins dominated by noise | Noise dominated (total time) | Noise dominated (detector-on time) | Marked lightcurve |
|---|---|---|---|---|---|---|---|
| A | 7597 | 6348 | 2 | 2 | 0.03% | 0.03% | 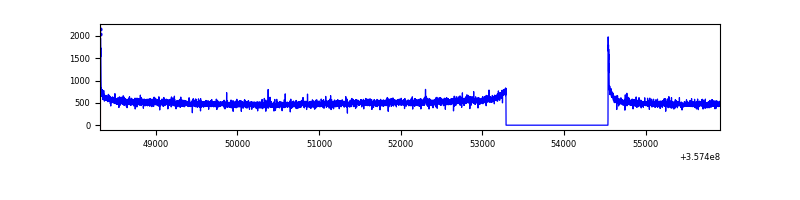 |
| B | 7597 | 6348 | 0 | 0 | 0.00% | 0.00% | 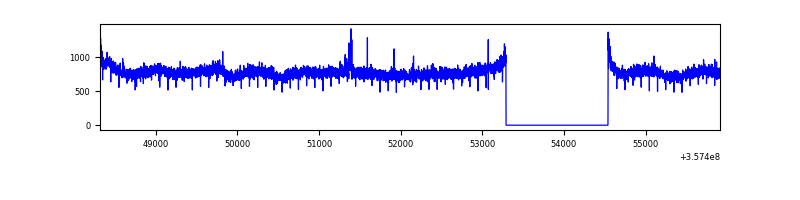 |
| C | 7597 | 6348 | 0 | 0 | 0.00% | 0.00% | 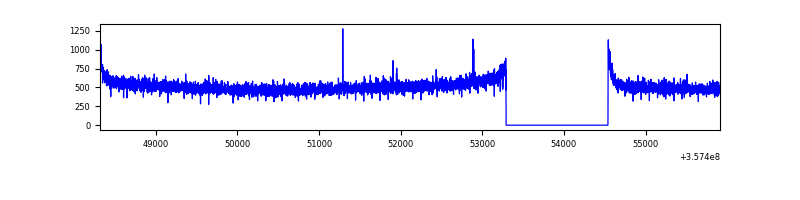 |
| D | 7597 | 6348 | 75 | 75 | 0.99% | 1.18% | 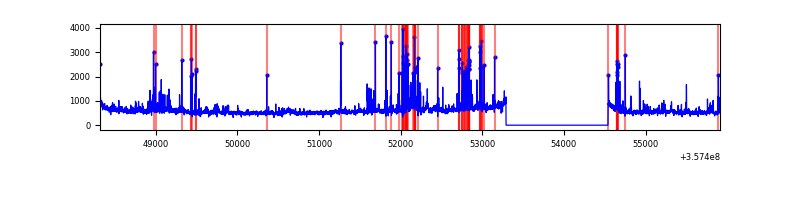 |
Top three noisy pixels from each quadrant. If the there are fewer than three noisy pixels in the level2.evt file, extra rows are filled as -1
| Pixel properties | Quadrant properties | ||||||
|---|---|---|---|---|---|---|---|
| Quadrant | DetID | PixID | Counts | Sigma | Mean | Median | Sigma |
| A | 8 | 192 | 25730 | 150.43 | 827 | 812 | 165.6 |
| A | 13 | 254 | 11234 | 62.92 | 827 | 812 | 165.6 |
| A | 3 | 137 | 7946 | 43.07 | 827 | 812 | 165.6 |
| B | 6 | 159 | 1682096 | 10681.58 | 825 | 807 | 157.4 |
| B | 0 | 190 | 23774 | 145.91 | 825 | 807 | 157.4 |
| B | 12 | 111 | 19298 | 117.48 | 825 | 807 | 157.4 |
| C | 14 | 238 | 129531 | 697.43 | 788 | 796 | 184.6 |
| C | 3 | 233 | 15370 | 78.96 | 788 | 796 | 184.6 |
| C | 2 | 114 | 14737 | 75.53 | 788 | 796 | 184.6 |
| D | 1 | 52 | 406061 | 2179.35 | 780 | 763 | 186.0 |
| D | 7 | 223 | 311462 | 1670.67 | 780 | 763 | 186.0 |
| D | 8 | 195 | 244992 | 1313.26 | 780 | 763 | 186.0 |
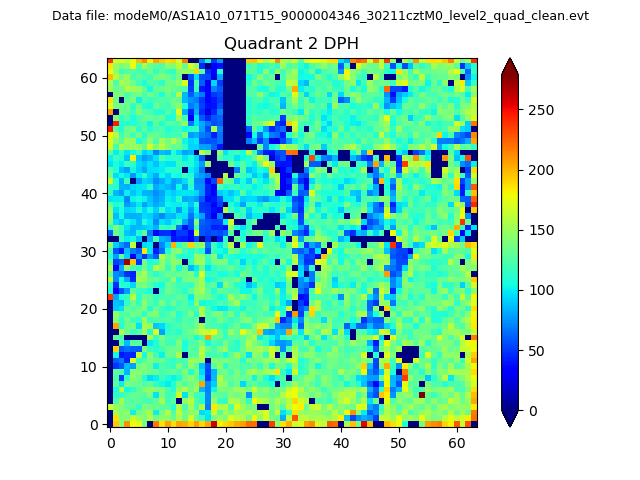
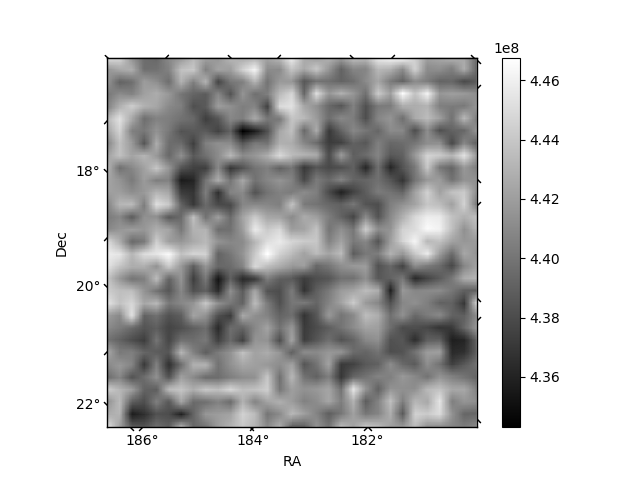
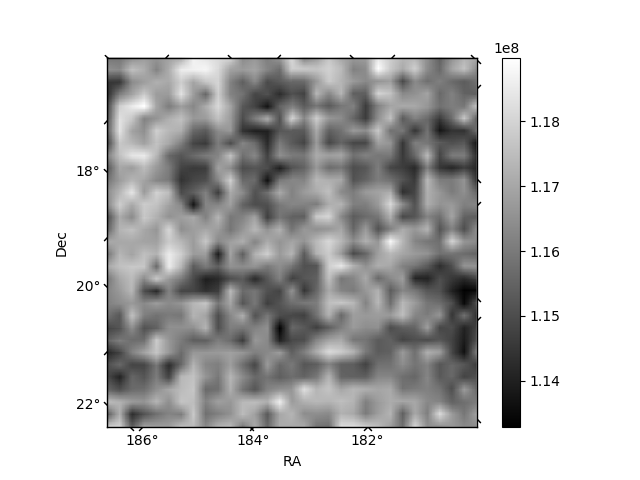
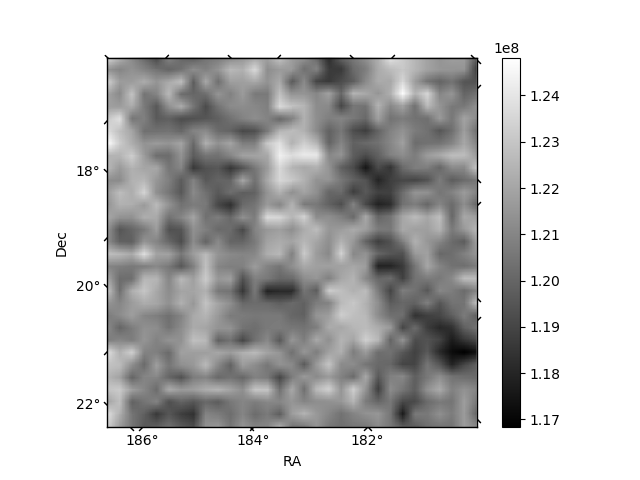
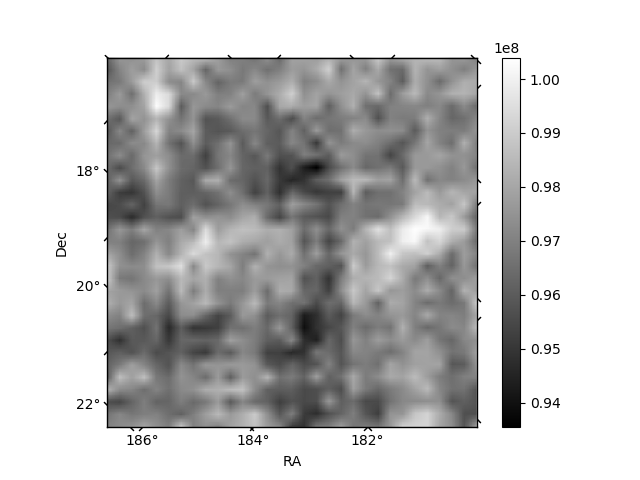
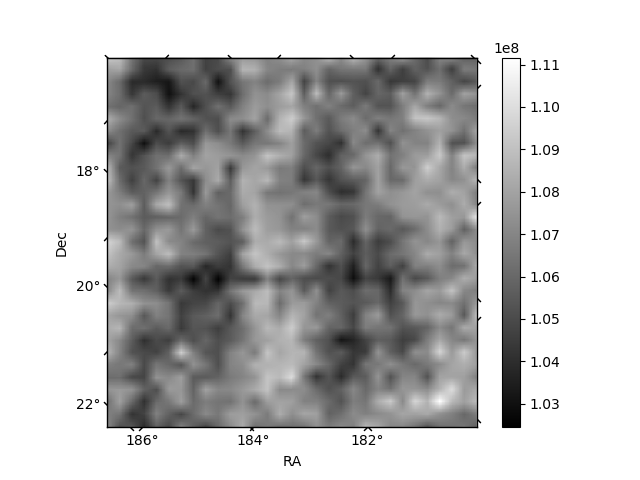
Histogram calculated using DETX and DETY for each event in the final _common_clean file
| Quadrant A | 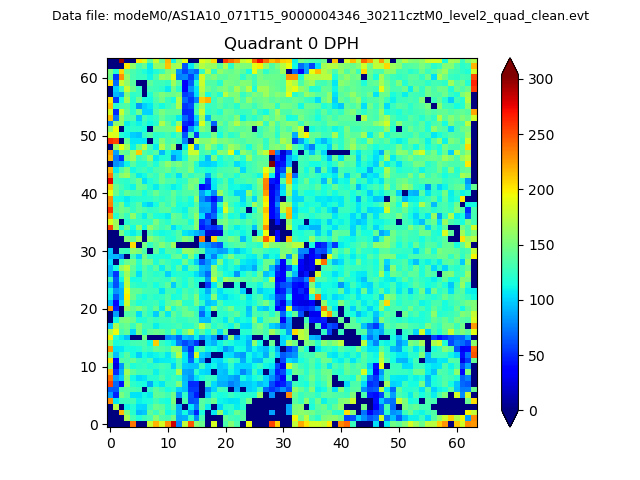 |
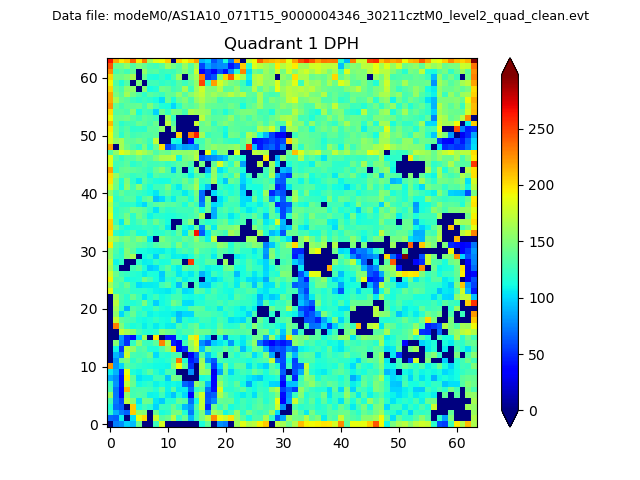 |
Quadrant B |
|---|---|---|---|
| Quadrant D | 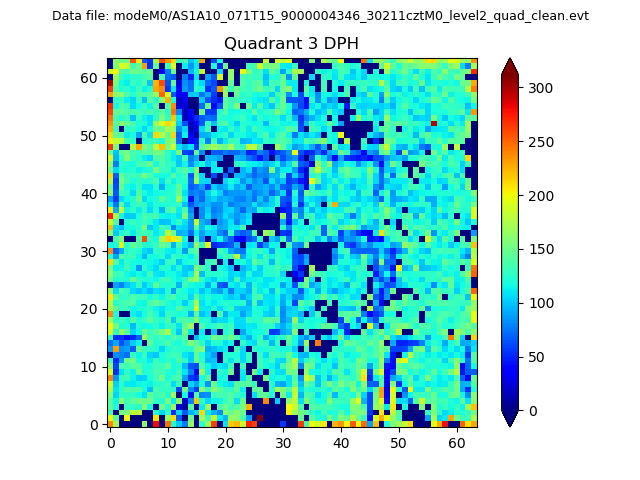 |
 |
Quadrant C |
| Plot type | Count rate plots | Images |
|---|---|---|
| Comparison with Poisson distribution Blue bars denote a histogram of data divided into 1 sec bins. Red curve is a Poisson curve with rate = median count rate of data. |
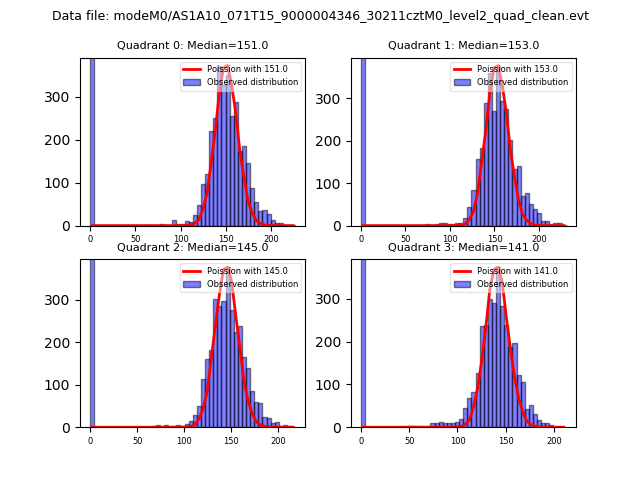 |
 |
| Quadrant-wise count rates Data is divided into 100 sec bins |
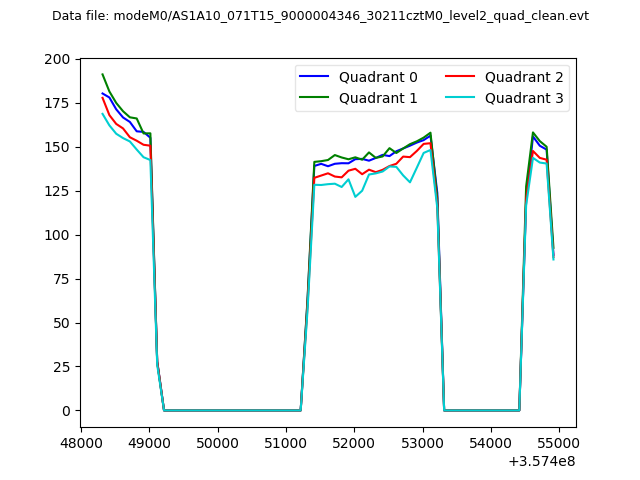 |
|
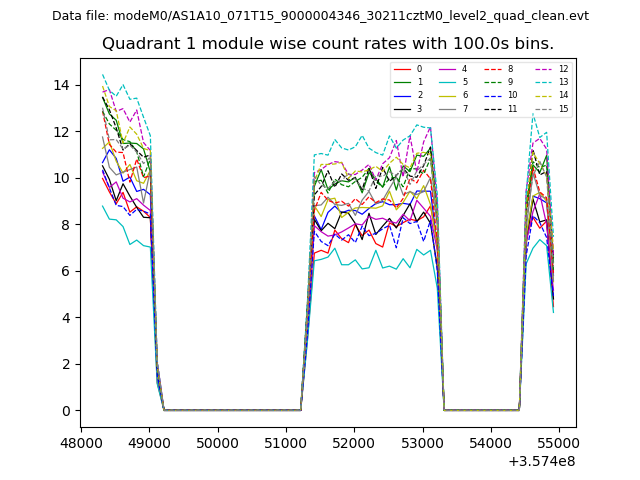
| Module-wise count rates for Quadrant A Data is divided into 100 sec bins |
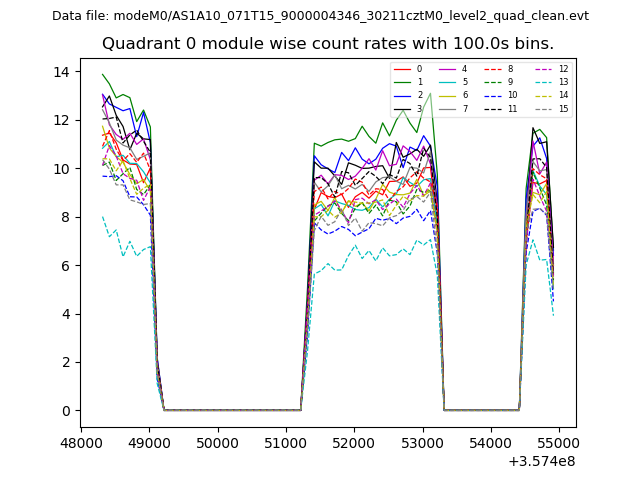 |
 |
| Module-wise count rates for Quadrant B Data is divided into 100 sec bins |
 |
 |
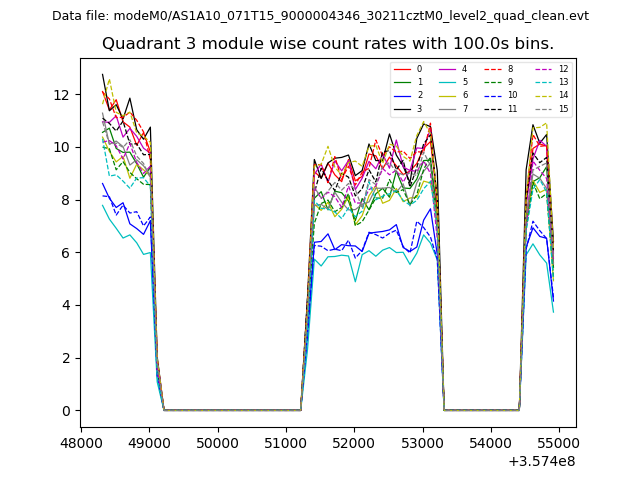
| Module-wise count rates for Quadrant C Data is divided into 100 sec bins |
 |
 |
| Module-wise count rates for Quadrant D Data is divided into 100 sec bins |
 |
 |
| Parameter | Plot |
|---|---|
| CZT HV Monitor | 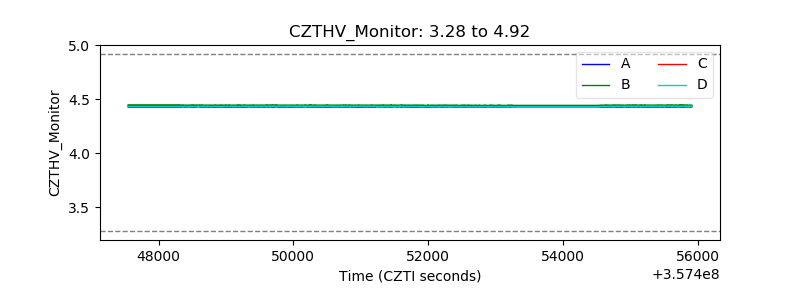 |
| D_VDD | 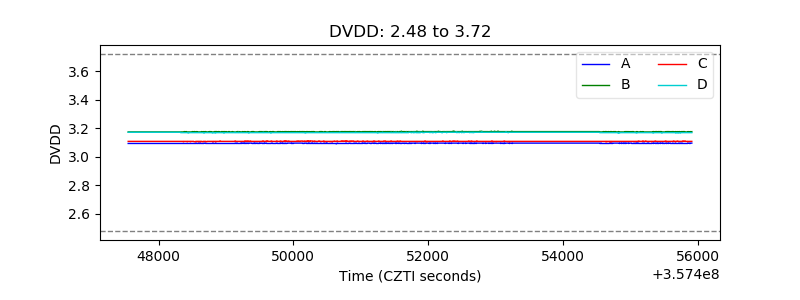 |
| Temperature 1 |  |
| Veto HV Monitor | 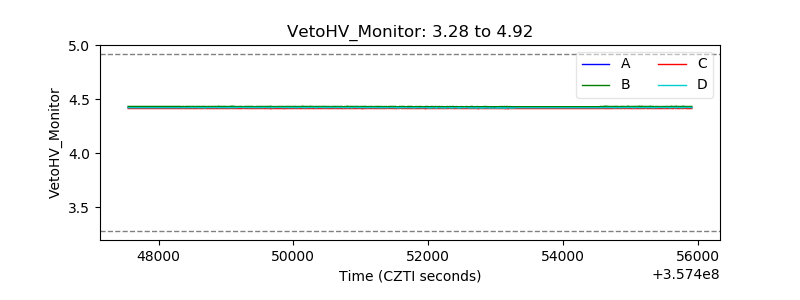 |
| Veto LLD | 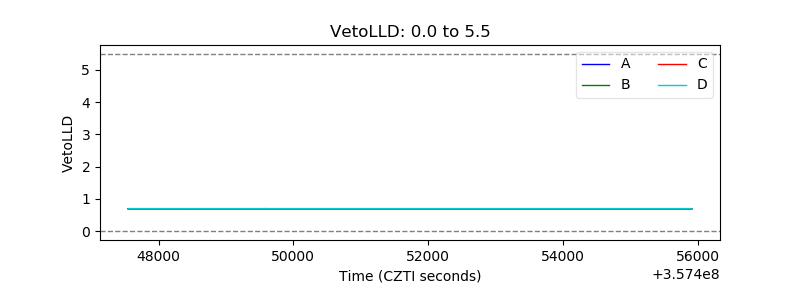 |
| Alpha Counter | 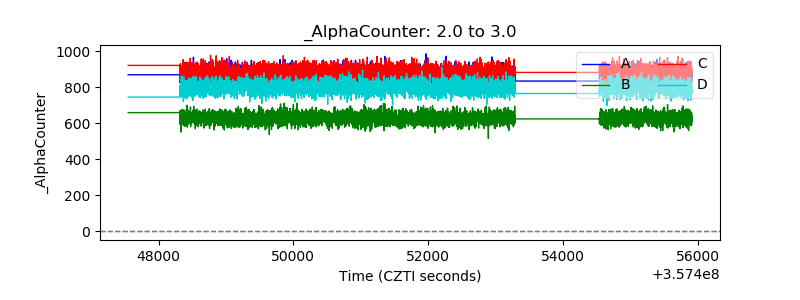 |
| _CPM_Rate | 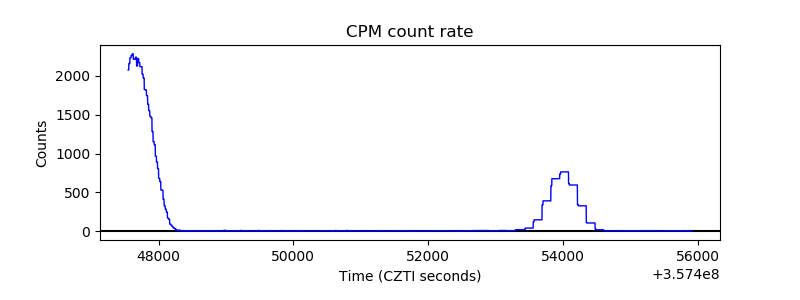 |
| CZT Counter | 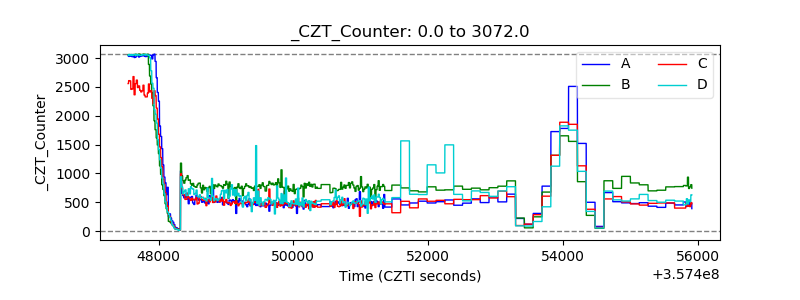 |
| +2.5 Volts monitor |  |
| +5 Volts monitor | 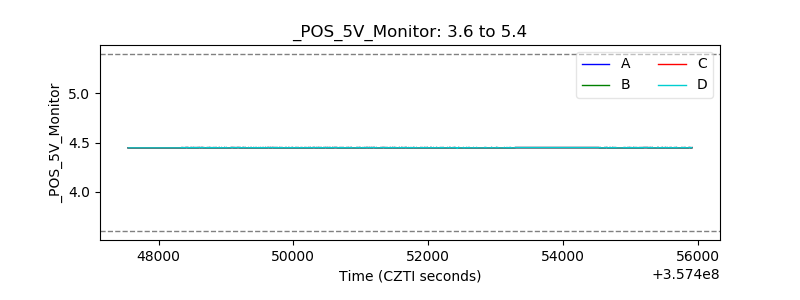 |
| _ROLL_ROT | 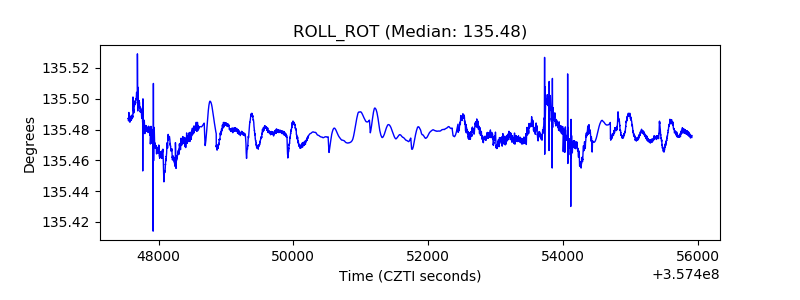 |
| _Roll_DEC | 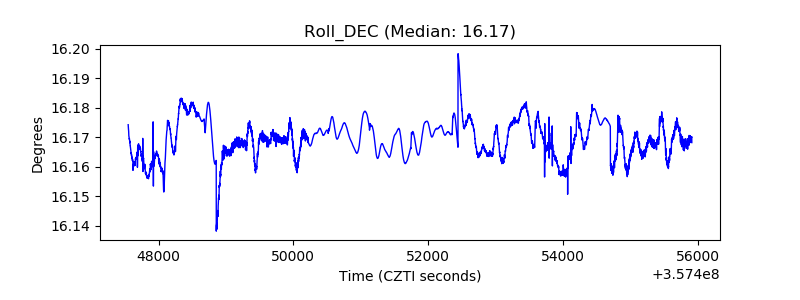 |
| _Roll_RA | 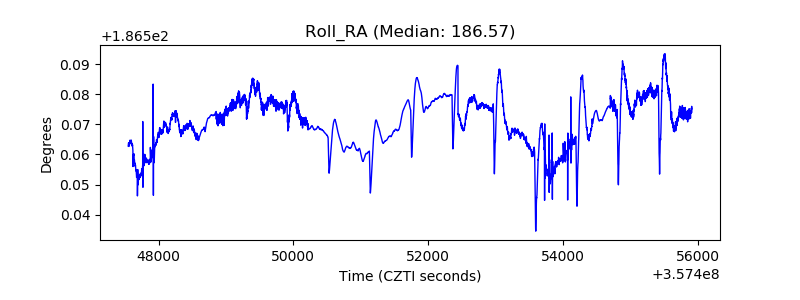 |
| Veto Counter | 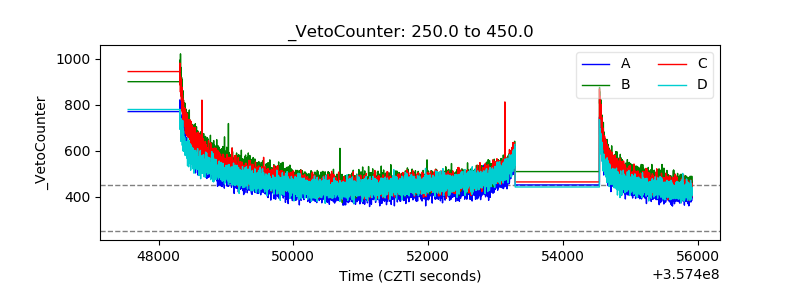 |