| Param | Original file | Final file |
|---|---|---|
| Filename | modeM0/AS1A10_071T15_9000004346_30214cztM0_level2.evt | modeM0/AS1A10_071T15_9000004346_30214cztM0_level2_quad_clean.evt |
| Size (bytes) | 792,973,440 | 91,736,640 |
| Size | 756.2 MB | 87.5 MB |
| Events in quadrant A | 4,279,453 | 568,088 |
| Events in quadrant B | 6,678,324 | 566,872 |
| Events in quadrant C | 4,733,525 | 547,015 |
| Events in quadrant D | 7,741,908 | 497,574 |
| Mode SS | |||
|---|---|---|---|
| Quadrant | BADHDUFLAG | Total packets | Discarded packets |
| A | 0 | 174 | 0 |
| B | 0 | 174 | 0 |
| C | 0 | 174 | 0 |
| D | 0 | 174 | 0 |
| Mode M0 | |||
|---|---|---|---|
| Quadrant | BADHDUFLAG | Total packets | Discarded packets |
| A | 0 | 18202 | 1 |
| B | 0 | 26325 | 1 |
| C | 0 | 19276 | 1 |
| D | 0 | 28652 | 1 |
| Mode M9 | |||
|---|---|---|---|
| Quadrant | BADHDUFLAG | Total packets | Discarded packets |
| A | 0 | 3 | 0 |
| B | 0 | 3 | 0 |
| C | 0 | 3 | 0 |
| D | 0 | 3 | 0 |
| Quadrant | Total seconds | Saturated seconds | Saturation percentage |
|---|---|---|---|
| A | 8610 | 379 | 4.401858% |
| B | 8611 | 565 | 6.561375% |
| C | 8611 | 428 | 4.970387% |
| D | 8611 | 1096 | 12.727906% |
Noise dominated data is calculated using 1-second bins in cleaned event files. If a bin has >2000 counts, and if more than 50% of those come from <1% of pixels, then it is considered to be noise-dominated and hence unusable.
| Quadrant | # 1 sec bins | Bins with >0 counts | Bins with >2000 counts | High rate bins dominated by noise | Noise dominated (total time) | Noise dominated (detector-on time) | Marked lightcurve |
|---|---|---|---|---|---|---|---|
| A | 8890 | 8611 | 0 | 0 | 0.00% | 0.00% | 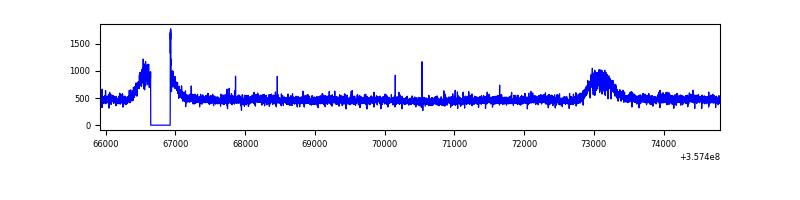 |
| B | 8891 | 8611 | 0 | 0 | 0.00% | 0.00% | 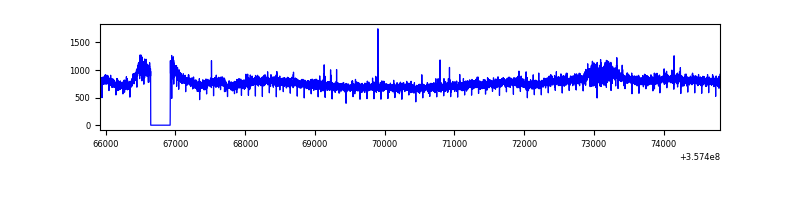 |
| C | 8891 | 8612 | 0 | 0 | 0.00% | 0.00% | 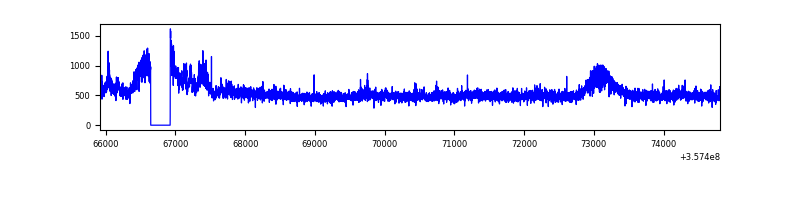 |
| D | 8891 | 8611 | 747 | 747 | 8.40% | 8.67% | 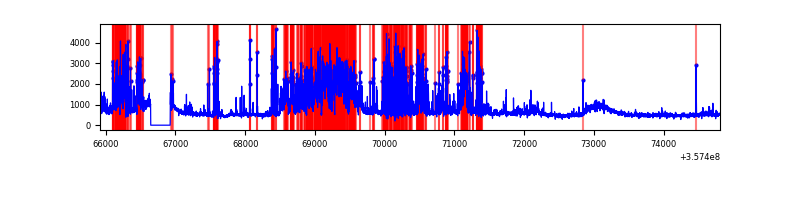 |
Top three noisy pixels from each quadrant. If the there are fewer than three noisy pixels in the level2.evt file, extra rows are filled as -1
| Pixel properties | Quadrant properties | ||||||
|---|---|---|---|---|---|---|---|
| Quadrant | DetID | PixID | Counts | Sigma | Mean | Median | Sigma |
| A | 13 | 254 | 15250 | 62.67 | 1105 | 1079 | 226.1 |
| A | 8 | 192 | 13017 | 52.8 | 1105 | 1079 | 226.1 |
| A | 3 | 137 | 12035 | 48.45 | 1105 | 1079 | 226.1 |
| B | 6 | 159 | 2415177 | 11311.06 | 1080 | 1048 | 213.4 |
| B | 12 | 111 | 27643 | 124.61 | 1080 | 1048 | 213.4 |
| B | 11 | 111 | 25581 | 114.95 | 1080 | 1048 | 213.4 |
| C | 3 | 233 | 425707 | 1693.59 | 1054 | 1058 | 250.7 |
| C | 14 | 238 | 164902 | 653.44 | 1054 | 1058 | 250.7 |
| C | 2 | 114 | 20318 | 76.81 | 1054 | 1058 | 250.7 |
| D | 1 | 52 | 1607352 | 6486.0 | 1031 | 1005 | 247.7 |
| D | 7 | 238 | 1245867 | 5026.42 | 1031 | 1005 | 247.7 |
| D | 7 | 223 | 369316 | 1487.14 | 1031 | 1005 | 247.7 |
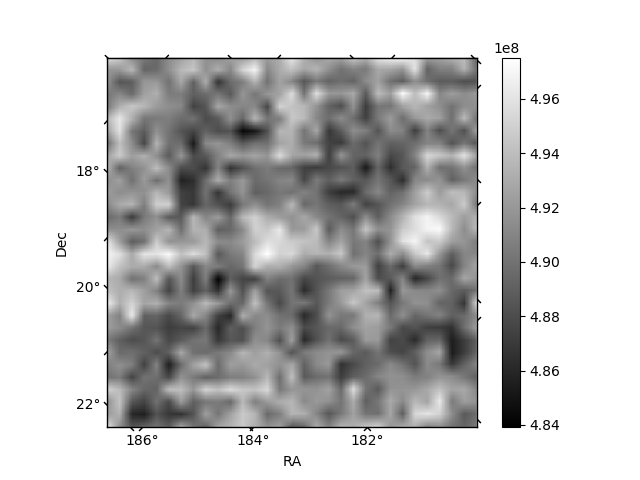
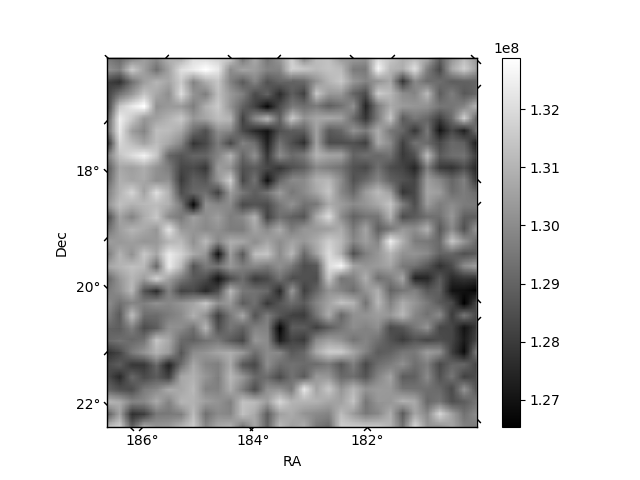
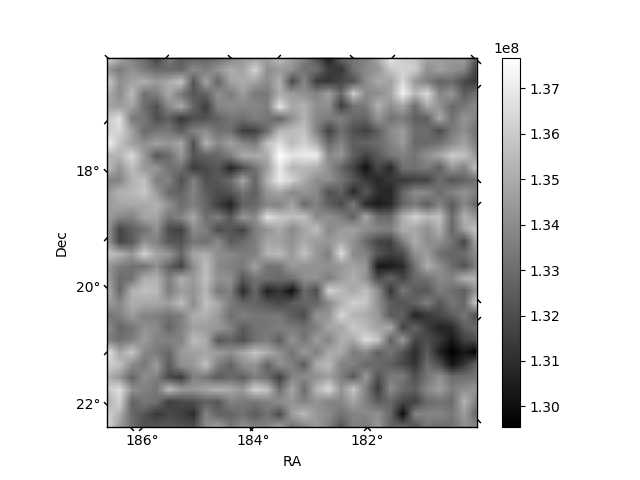
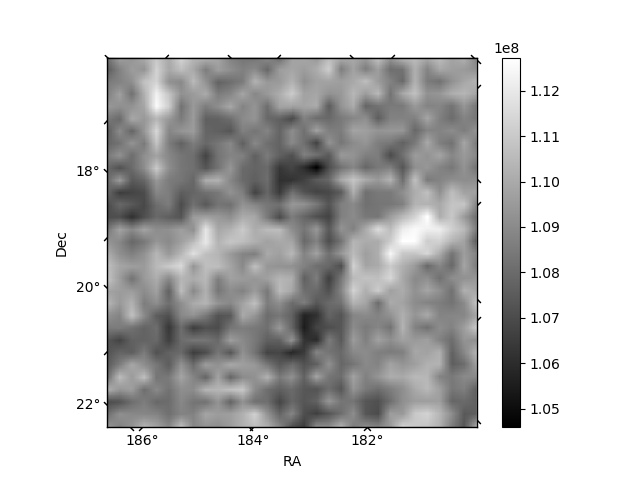
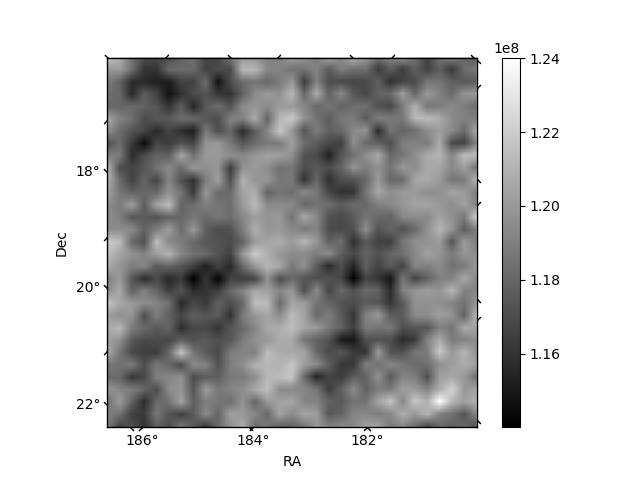
Histogram calculated using DETX and DETY for each event in the final _common_clean file
| Quadrant A | 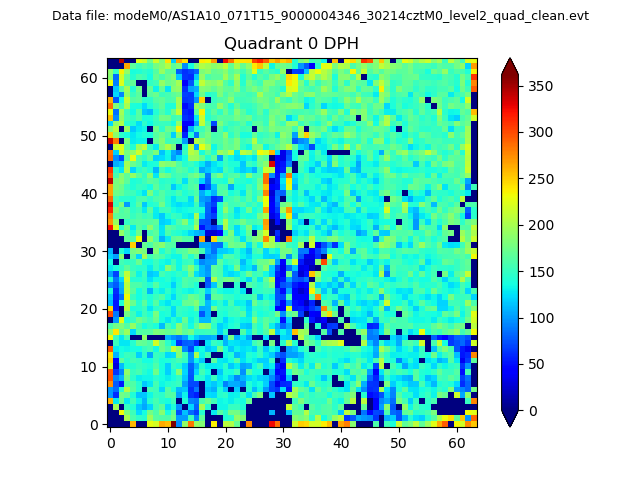 |
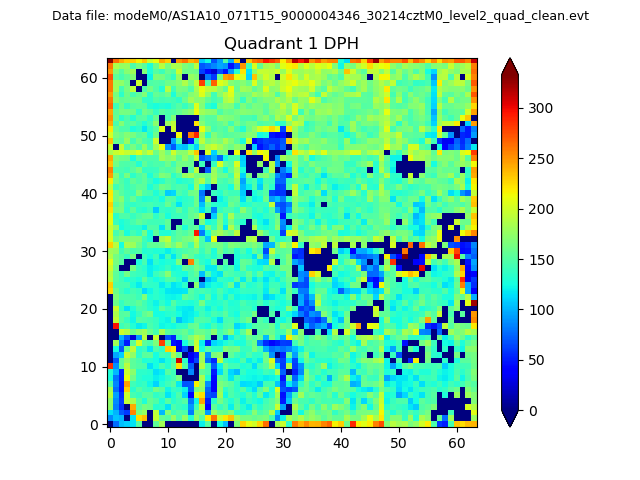 |
Quadrant B |
|---|---|---|---|
| Quadrant D | 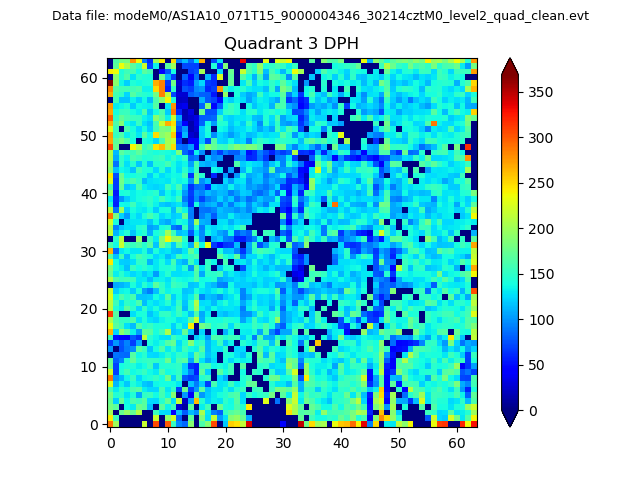 |
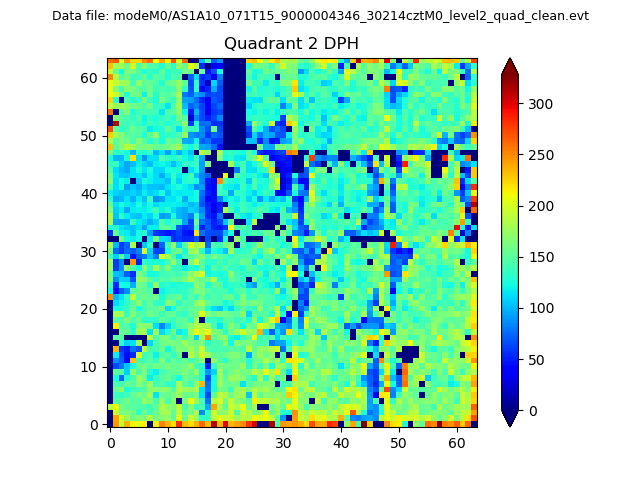 |
Quadrant C |
| Plot type | Count rate plots | Images |
|---|---|---|
| Comparison with Poisson distribution Blue bars denote a histogram of data divided into 1 sec bins. Red curve is a Poisson curve with rate = median count rate of data. |
 |
 |
| Quadrant-wise count rates Data is divided into 100 sec bins |
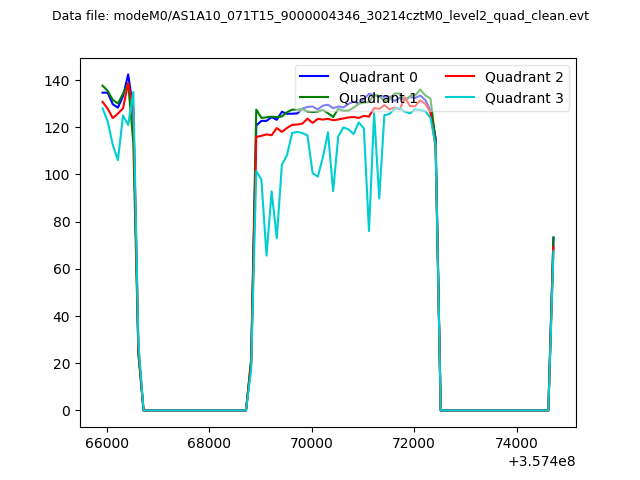 |
|
| Module-wise count rates for Quadrant A Data is divided into 100 sec bins |
 |
 |
| Module-wise count rates for Quadrant B Data is divided into 100 sec bins |
 |
 |
| Module-wise count rates for Quadrant C Data is divided into 100 sec bins |
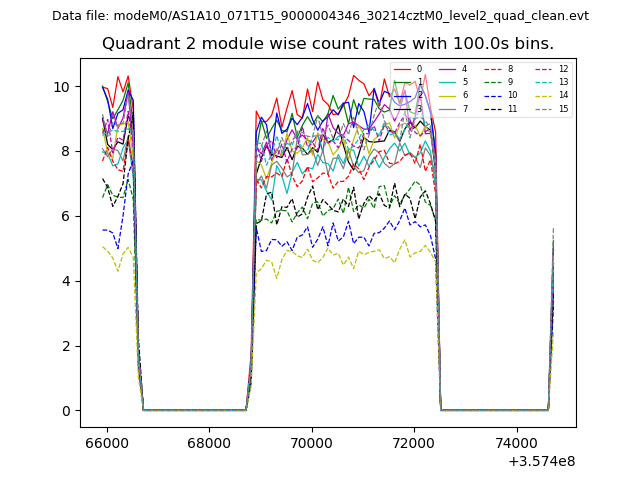 |
 |
| Module-wise count rates for Quadrant D Data is divided into 100 sec bins |
 |
 |
| Parameter | Plot |
|---|---|
| CZT HV Monitor | 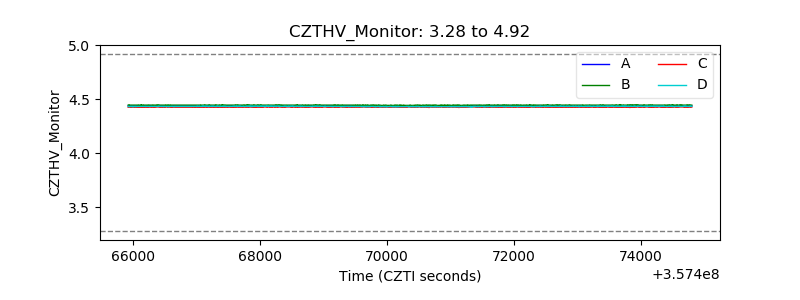 |
| D_VDD | 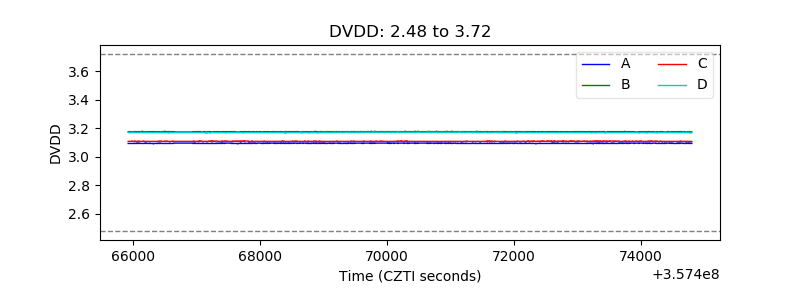 |
| Temperature 1 | 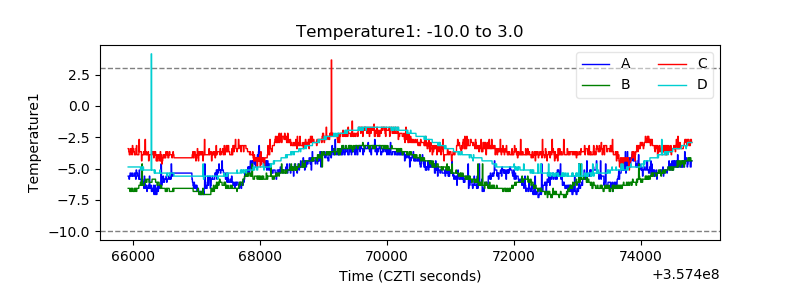 |
| Veto HV Monitor | 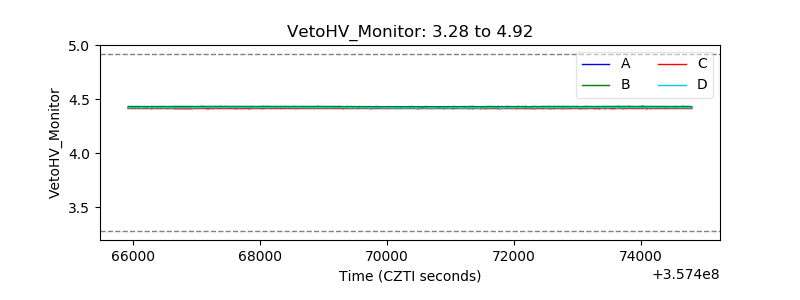 |
| Veto LLD | 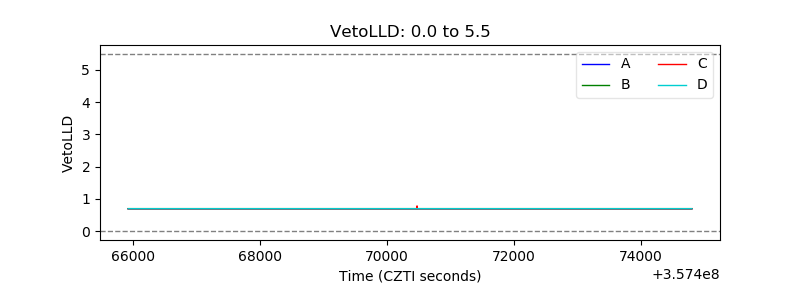 |
| Alpha Counter | 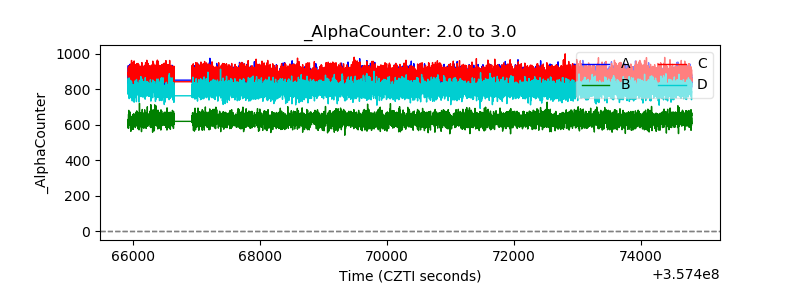 |
| _CPM_Rate | 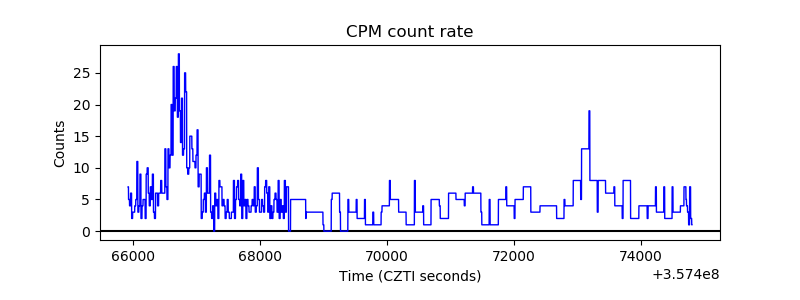 |
| CZT Counter | 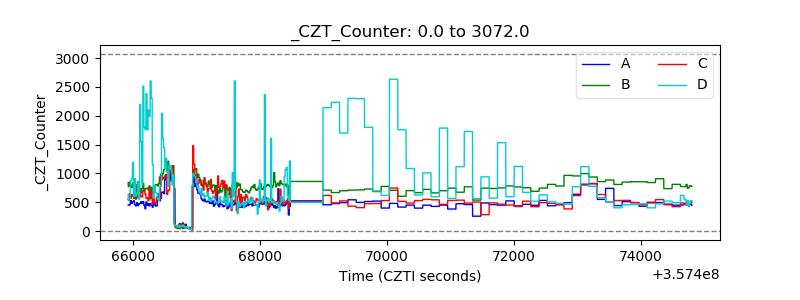 |
| +2.5 Volts monitor |  |
| +5 Volts monitor |  |
| _ROLL_ROT |  |
| _Roll_DEC |  |
| _Roll_RA | 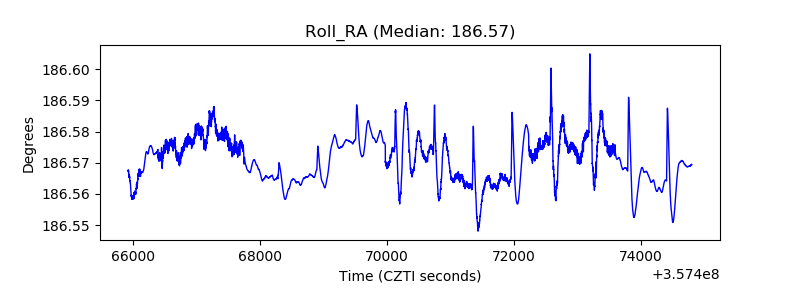 |
| Veto Counter | 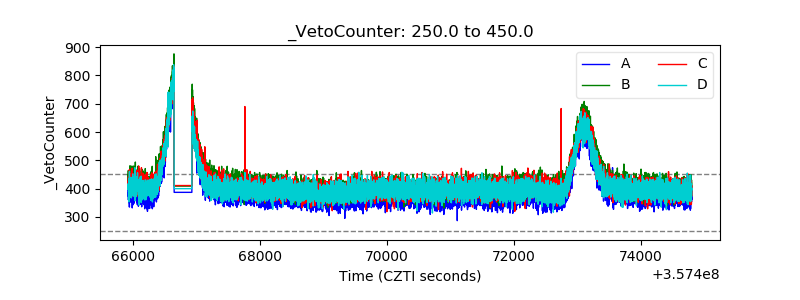 |