| Param | Original file | Final file |
|---|---|---|
| Filename | modeM0/AS1A10_071T15_9000004346_30215cztM0_level2.evt | modeM0/AS1A10_071T15_9000004346_30215cztM0_level2_quad_clean.evt |
| Size (bytes) | 343,874,880 | 42,281,280 |
| Size | 327.9 MB | 40.3 MB |
| Events in quadrant A | 2,111,915 | 251,382 |
| Events in quadrant B | 3,307,196 | 252,679 |
| Events in quadrant C | 2,199,754 | 240,942 |
| Events in quadrant D | 2,506,030 | 235,811 |
| Mode SS | |||
|---|---|---|---|
| Quadrant | BADHDUFLAG | Total packets | Discarded packets |
| A | 0 | 86 | 0 |
| B | 0 | 86 | 0 |
| C | 0 | 86 | 0 |
| D | 0 | 86 | 0 |
| Mode M0 | |||
|---|---|---|---|
| Quadrant | BADHDUFLAG | Total packets | Discarded packets |
| A | 0 | 8962 | 0 |
| B | 0 | 12949 | 0 |
| C | 0 | 9035 | 0 |
| D | 0 | 10018 | 0 |
| Quadrant | Total seconds | Saturated seconds | Saturation percentage |
|---|---|---|---|
| A | 4240 | 214 | 5.047170% |
| B | 4241 | 330 | 7.781184% |
| C | 4241 | 223 | 5.258194% |
| D | 4241 | 186 | 4.385758% |
Noise dominated data is calculated using 1-second bins in cleaned event files. If a bin has >2000 counts, and if more than 50% of those come from <1% of pixels, then it is considered to be noise-dominated and hence unusable.
| Quadrant | # 1 sec bins | Bins with >0 counts | Bins with >2000 counts | High rate bins dominated by noise | Noise dominated (total time) | Noise dominated (detector-on time) | Marked lightcurve |
|---|---|---|---|---|---|---|---|
| A | 4240 | 4240 | 0 | 0 | 0.00% | 0.00% | 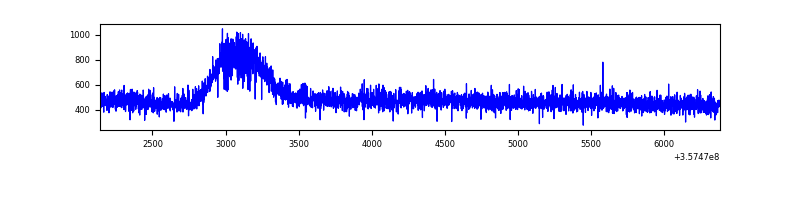 |
| B | 4241 | 4241 | 0 | 0 | 0.00% | 0.00% | 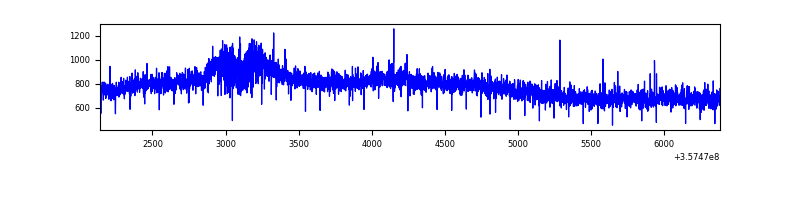 |
| C | 4241 | 4241 | 0 | 0 | 0.00% | 0.00% | 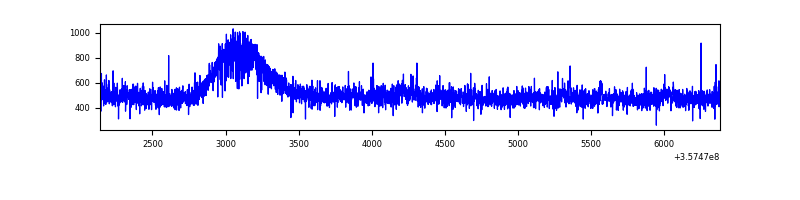 |
| D | 4241 | 4241 | 34 | 34 | 0.80% | 0.80% | 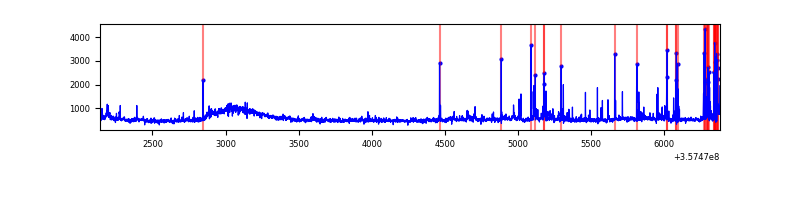 |
Top three noisy pixels from each quadrant. If the there are fewer than three noisy pixels in the level2.evt file, extra rows are filled as -1
| Pixel properties | Quadrant properties | ||||||
|---|---|---|---|---|---|---|---|
| Quadrant | DetID | PixID | Counts | Sigma | Mean | Median | Sigma |
| A | 13 | 254 | 7347 | 59.76 | 547 | 532 | 114.0 |
| A | 3 | 137 | 6050 | 48.39 | 547 | 532 | 114.0 |
| A | 0 | 226 | 4564 | 35.36 | 547 | 532 | 114.0 |
| B | 6 | 159 | 1197658 | 11165.27 | 534 | 518 | 107.2 |
| B | 12 | 111 | 13720 | 123.13 | 534 | 518 | 107.2 |
| B | 11 | 111 | 12696 | 113.58 | 534 | 518 | 107.2 |
| C | 14 | 238 | 82815 | 655.85 | 523 | 524 | 125.5 |
| C | 3 | 233 | 69915 | 553.04 | 523 | 524 | 125.5 |
| C | 2 | 114 | 10123 | 76.5 | 523 | 524 | 125.5 |
| D | 1 | 52 | 247080 | 1919.28 | 528 | 513 | 128.5 |
| D | 7 | 223 | 86504 | 669.35 | 528 | 513 | 128.5 |
| D | 8 | 195 | 83142 | 643.18 | 528 | 513 | 128.5 |
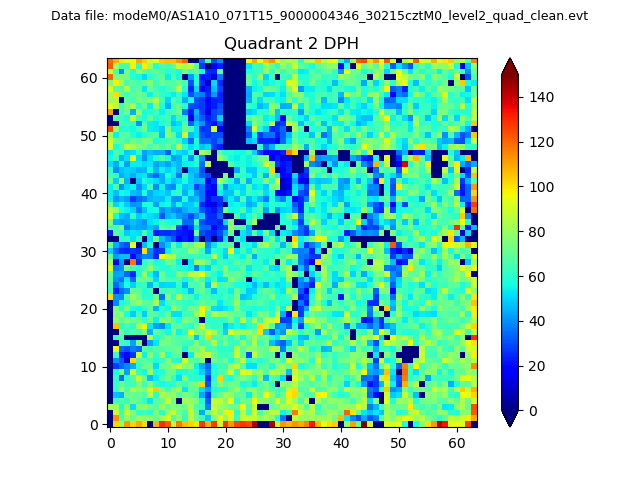
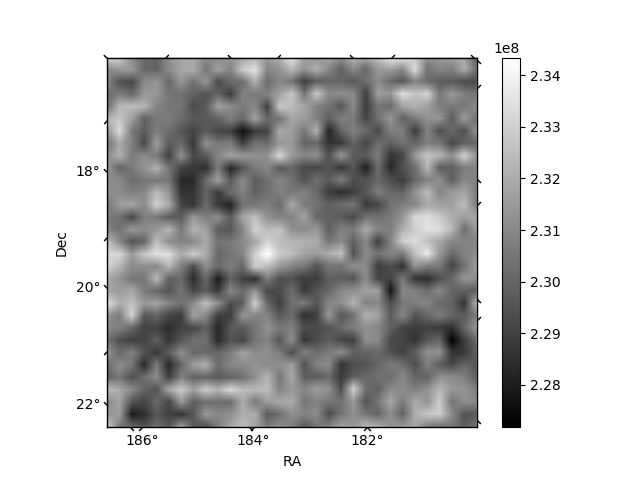
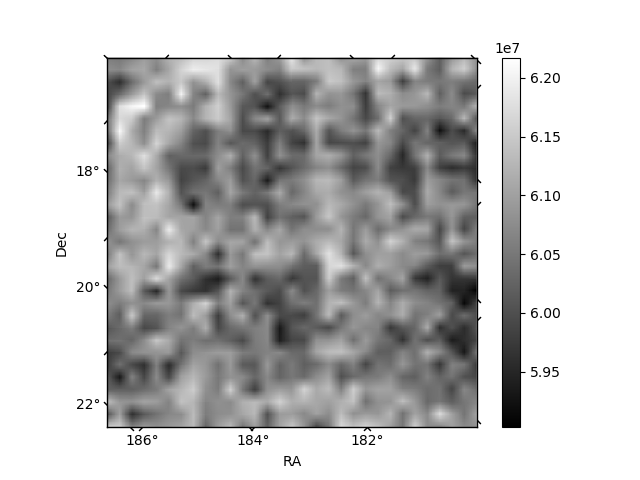
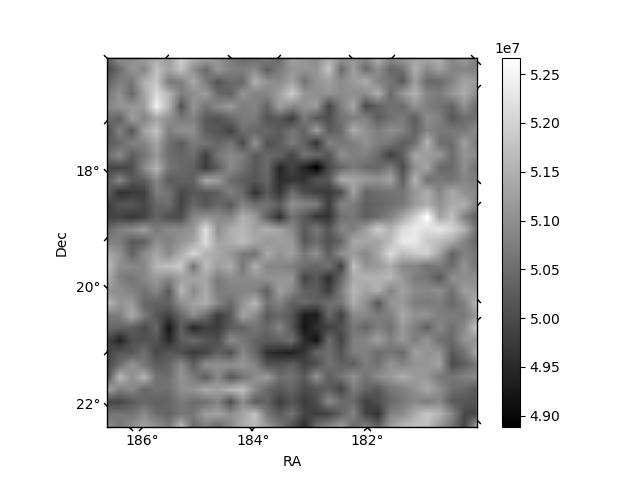
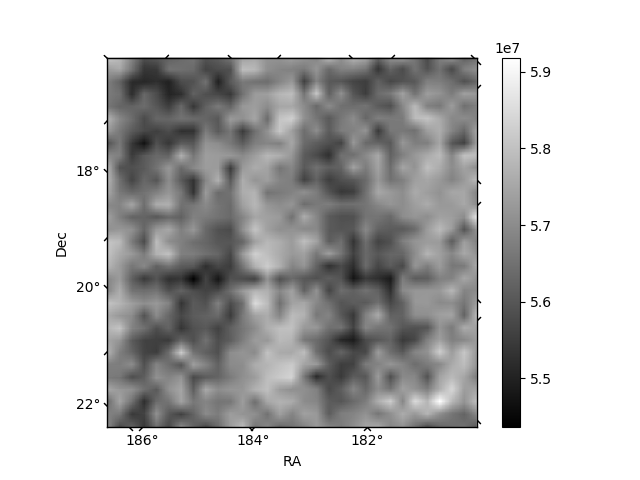
Histogram calculated using DETX and DETY for each event in the final _common_clean file
| Quadrant A | 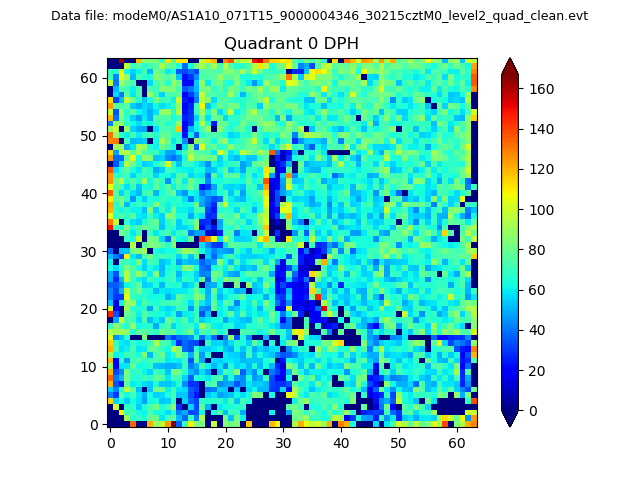 |
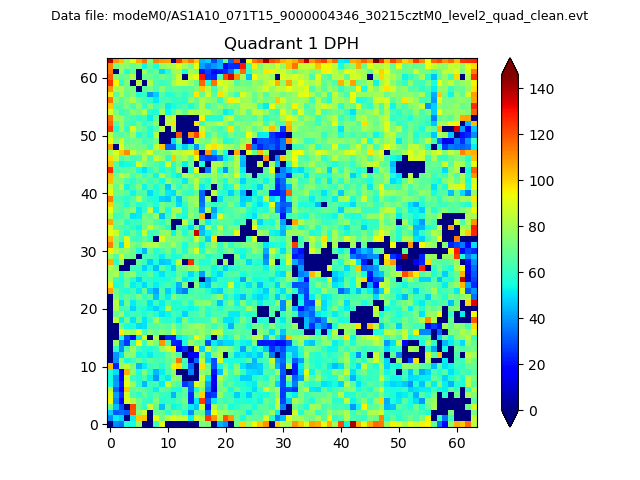 |
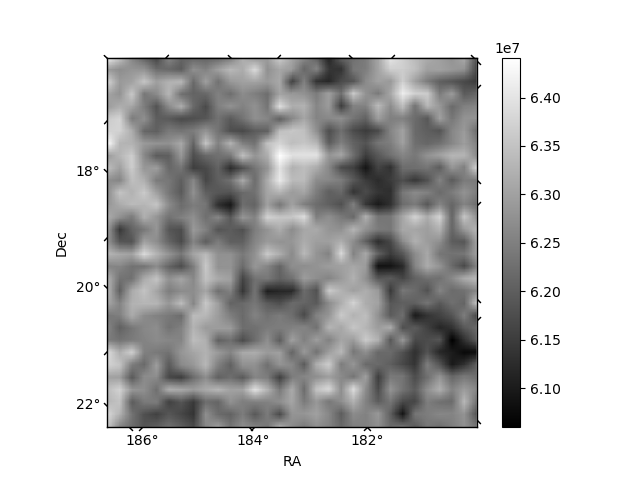
Quadrant B |
|---|---|---|---|
| Quadrant D | 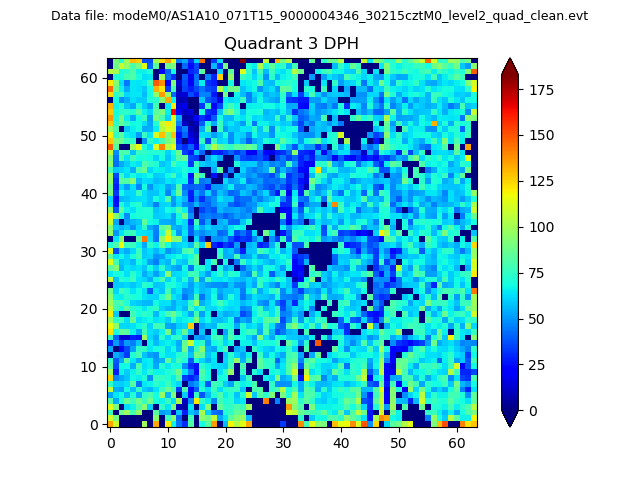 |
 |
Quadrant C |
| Plot type | Count rate plots | Images |
|---|---|---|
| Comparison with Poisson distribution Blue bars denote a histogram of data divided into 1 sec bins. Red curve is a Poisson curve with rate = median count rate of data. |
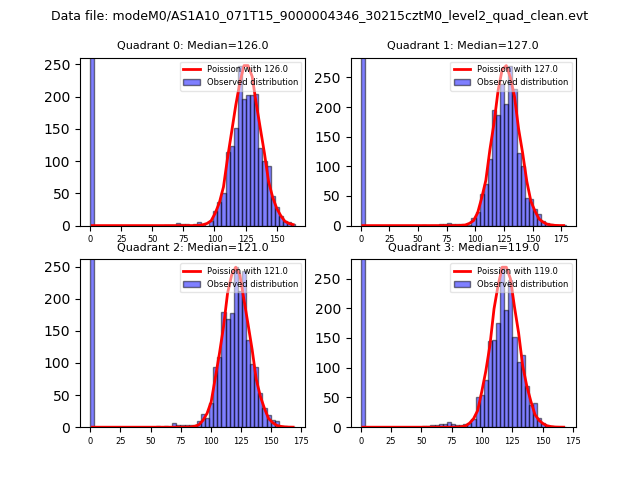 |
 |
| Quadrant-wise count rates Data is divided into 100 sec bins |
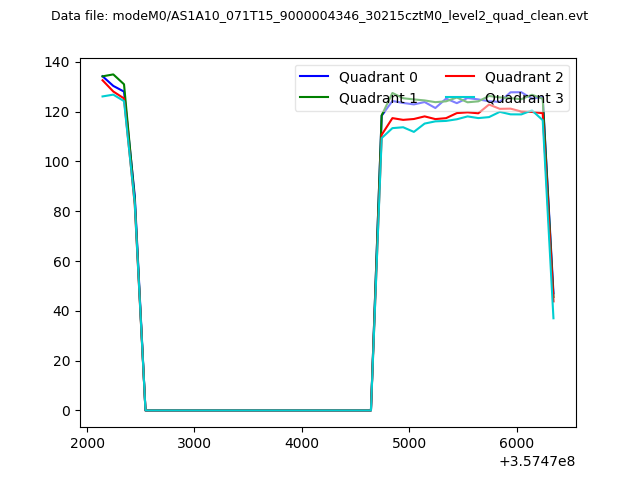 |
|
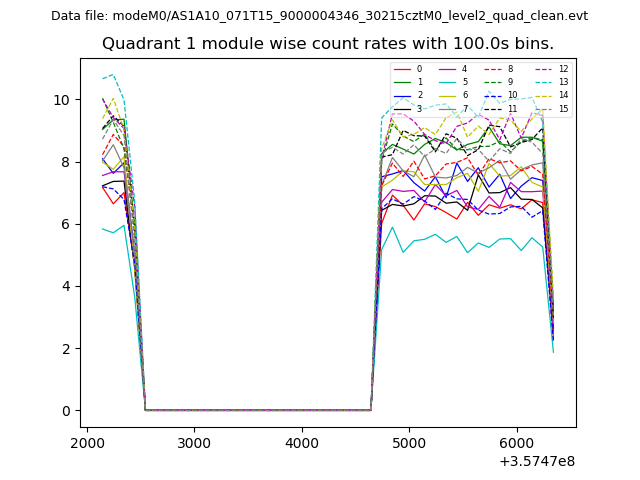
| Module-wise count rates for Quadrant A Data is divided into 100 sec bins |
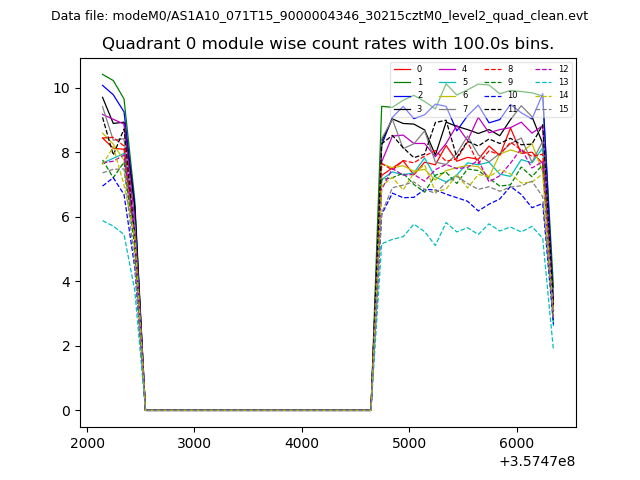 |
 |
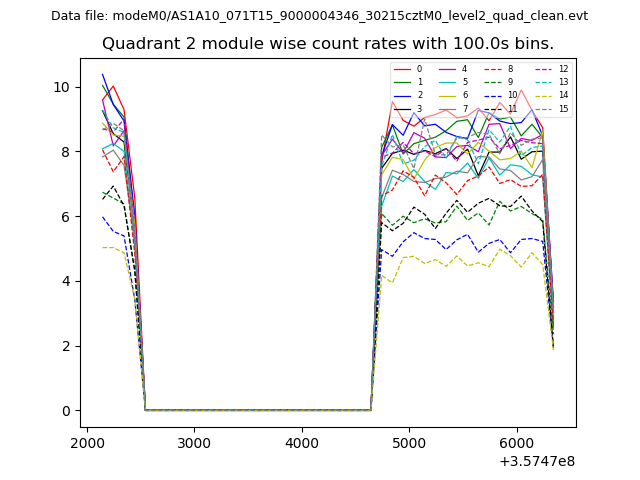
| Module-wise count rates for Quadrant B Data is divided into 100 sec bins |
 |
 |
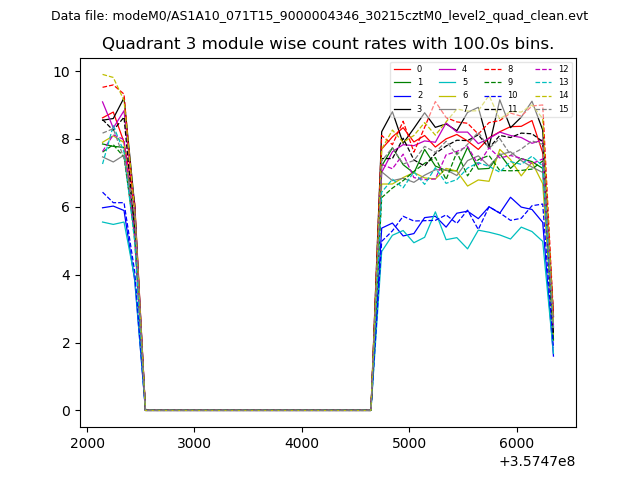
| Module-wise count rates for Quadrant C Data is divided into 100 sec bins |
 |
 |
| Module-wise count rates for Quadrant D Data is divided into 100 sec bins |
 |
 |
| Parameter | Plot |
|---|---|
| CZT HV Monitor | 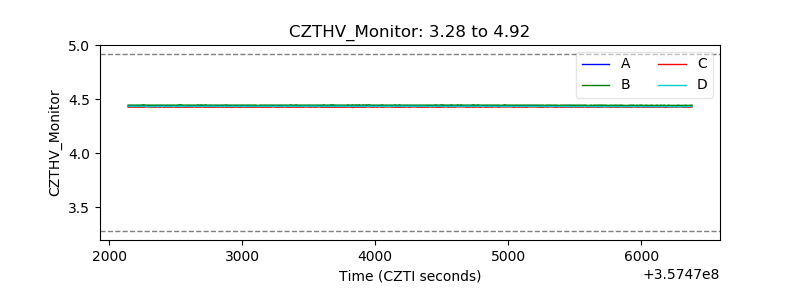 |
| D_VDD | 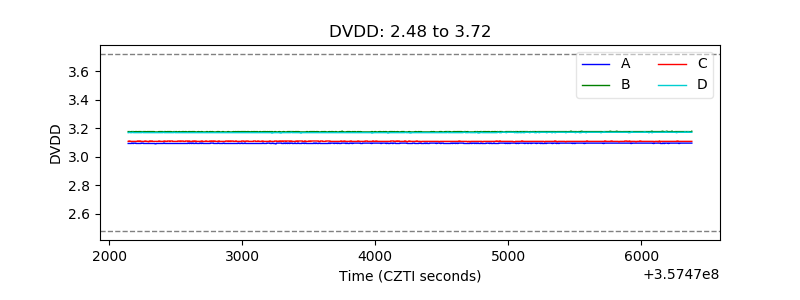 |
| Temperature 1 | 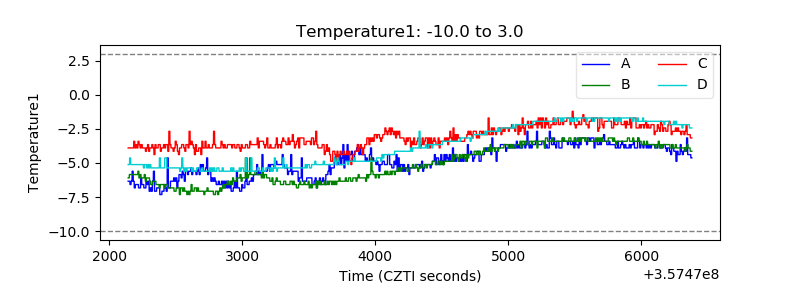 |
| Veto HV Monitor | 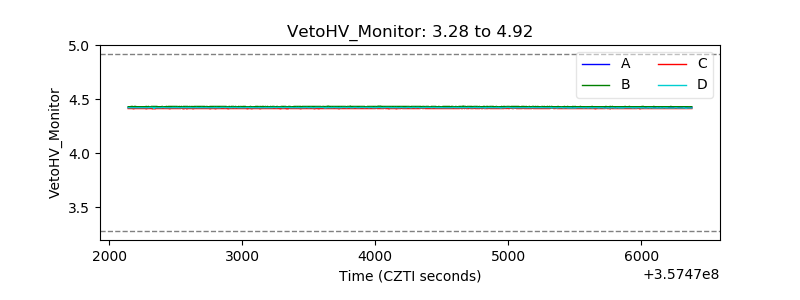 |
| Veto LLD | 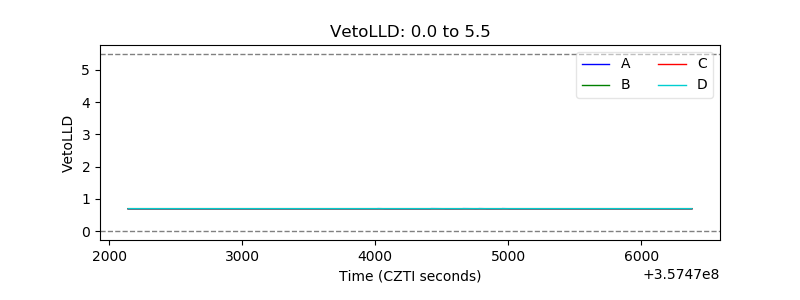 |
| Alpha Counter | 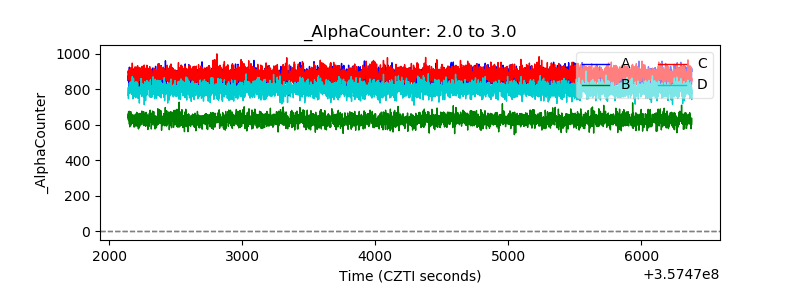 |
| _CPM_Rate | 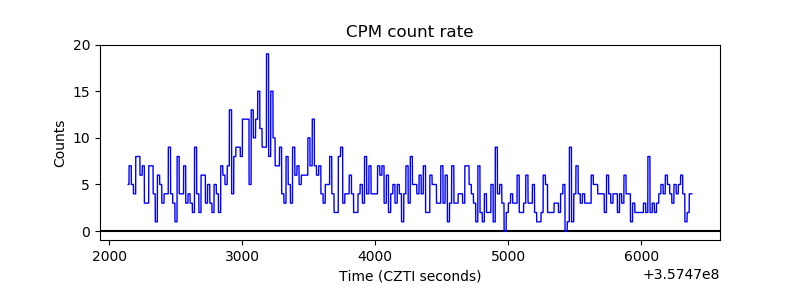 |
| CZT Counter | 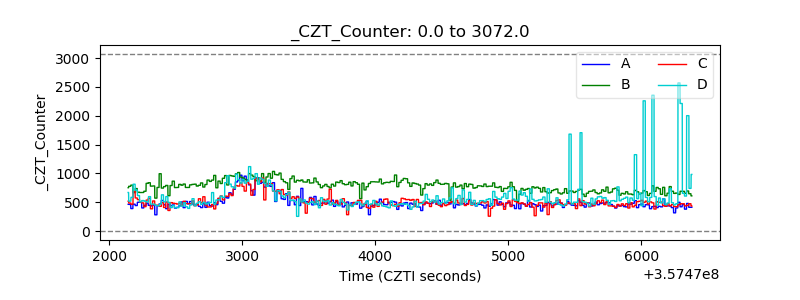 |
| +2.5 Volts monitor |  |
| +5 Volts monitor |  |
| _ROLL_ROT | 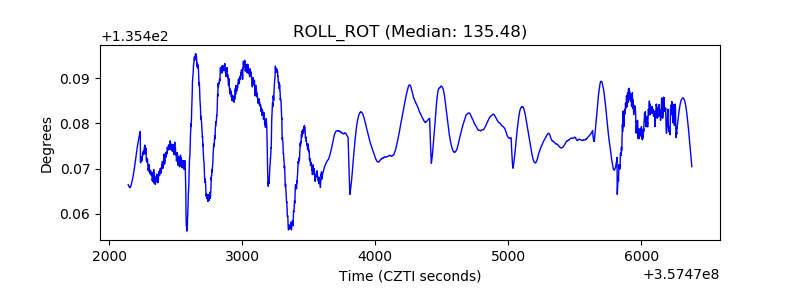 |
| _Roll_DEC |  |
| _Roll_RA | 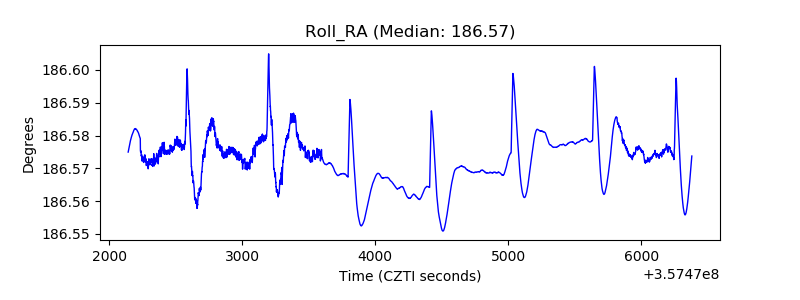 |
| Veto Counter | 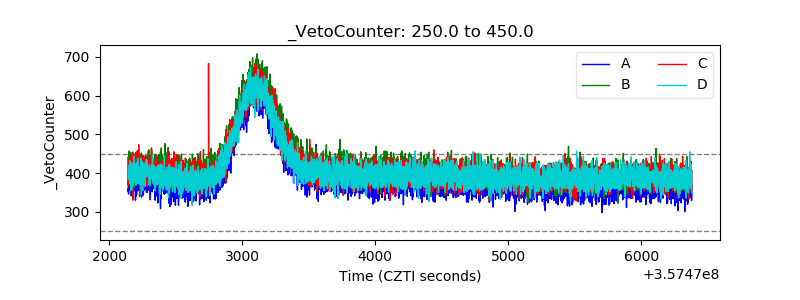 |