| Param | Original file | Final file |
|---|---|---|
| Filename | modeM0/AS1A10_007T01_9000004350_30223cztM0_level2.evt | modeM0/AS1A10_007T01_9000004350_30223cztM0_level2_quad_clean.evt |
| Size (bytes) | 320,322,240 | 49,749,120 |
| Size | 305.5 MB | 47.4 MB |
| Events in quadrant A | 1,998,772 | 313,069 |
| Events in quadrant B | 2,982,352 | 322,263 |
| Events in quadrant C | 2,048,662 | 309,903 |
| Events in quadrant D | 2,420,918 | 300,952 |
| Mode M9 | |||
|---|---|---|---|
| Quadrant | BADHDUFLAG | Total packets | Discarded packets |
| A | 0 | 13 | 0 |
| B | 0 | 13 | 0 |
| C | 0 | 13 | 0 |
| D | 0 | 13 | 0 |
| Mode SS | |||
|---|---|---|---|
| Quadrant | BADHDUFLAG | Total packets | Discarded packets |
| A | 0 | 76 | 0 |
| B | 0 | 76 | 0 |
| C | 0 | 76 | 0 |
| D | 0 | 76 | 0 |
| Mode M0 | |||
|---|---|---|---|
| Quadrant | BADHDUFLAG | Total packets | Discarded packets |
| A | 0 | 8034 | 1 |
| B | 0 | 11319 | 2 |
| C | 0 | 8245 | 1 |
| D | 0 | 9644 | 1 |
| Quadrant | Total seconds | Saturated seconds | Saturation percentage |
|---|---|---|---|
| A | 3673 | 40 | 1.089028% |
| B | 3672 | 91 | 2.478214% |
| C | 3672 | 73 | 1.988017% |
| D | 3672 | 53 | 1.443355% |
Noise dominated data is calculated using 1-second bins in cleaned event files. If a bin has >2000 counts, and if more than 50% of those come from <1% of pixels, then it is considered to be noise-dominated and hence unusable.
| Quadrant | # 1 sec bins | Bins with >0 counts | Bins with >2000 counts | High rate bins dominated by noise | Noise dominated (total time) | Noise dominated (detector-on time) | Marked lightcurve |
|---|---|---|---|---|---|---|---|
| A | 5013 | 3674 | 3 | 3 | 0.06% | 0.08% | 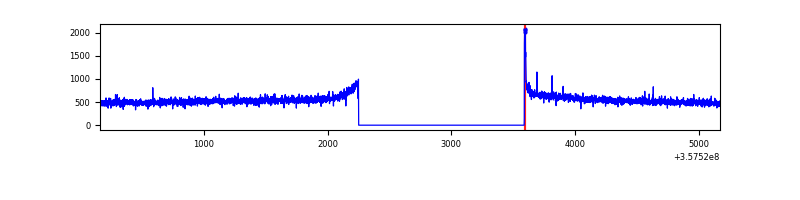 |
| B | 5012 | 3672 | 0 | 0 | 0.00% | 0.00% | 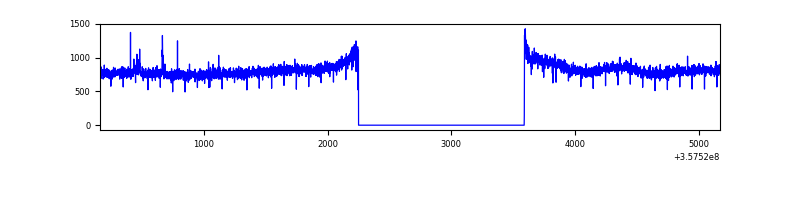 |
| C | 5012 | 3673 | 0 | 0 | 0.00% | 0.00% | 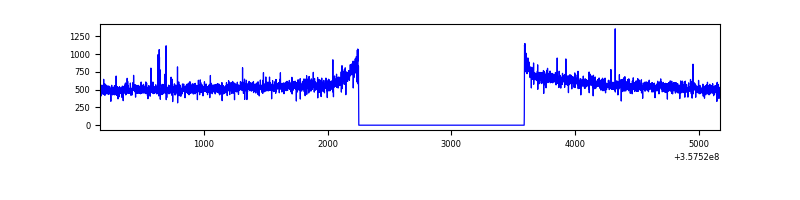 |
| D | 5012 | 3673 | 28 | 28 | 0.56% | 0.76% | 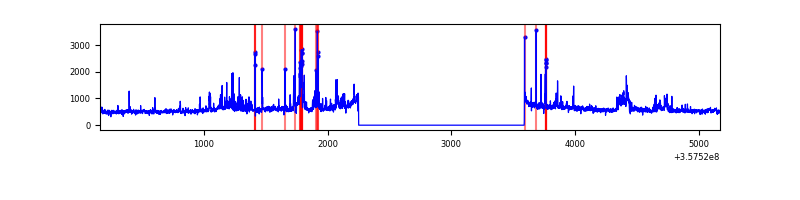 |
Top three noisy pixels from each quadrant. If the there are fewer than three noisy pixels in the level2.evt file, extra rows are filled as -1
| Pixel properties | Quadrant properties | ||||||
|---|---|---|---|---|---|---|---|
| Quadrant | DetID | PixID | Counts | Sigma | Mean | Median | Sigma |
| A | 8 | 192 | 14592 | 135.67 | 514 | 505 | 103.8 |
| A | 13 | 254 | 6844 | 61.05 | 514 | 505 | 103.8 |
| A | 3 | 137 | 4749 | 40.87 | 514 | 505 | 103.8 |
| B | 6 | 159 | 976318 | 10057.84 | 510 | 498 | 97.0 |
| B | 12 | 111 | 11534 | 113.75 | 510 | 498 | 97.0 |
| B | 11 | 111 | 10343 | 101.47 | 510 | 498 | 97.0 |
| C | 14 | 238 | 86207 | 736.98 | 496 | 499 | 116.3 |
| C | 3 | 233 | 14670 | 121.85 | 496 | 499 | 116.3 |
| C | 2 | 114 | 8628 | 69.9 | 496 | 499 | 116.3 |
| D | 1 | 52 | 237976 | 1991.54 | 494 | 484 | 119.3 |
| D | 8 | 195 | 114559 | 956.6 | 494 | 484 | 119.3 |
| D | 7 | 223 | 110650 | 923.82 | 494 | 484 | 119.3 |
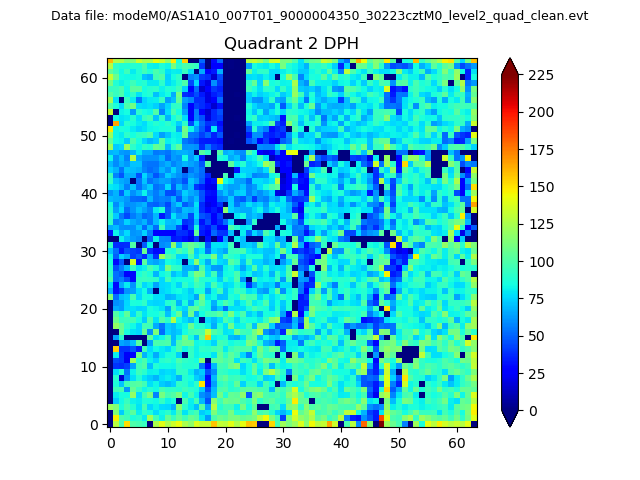
Histogram calculated using DETX and DETY for each event in the final _common_clean file
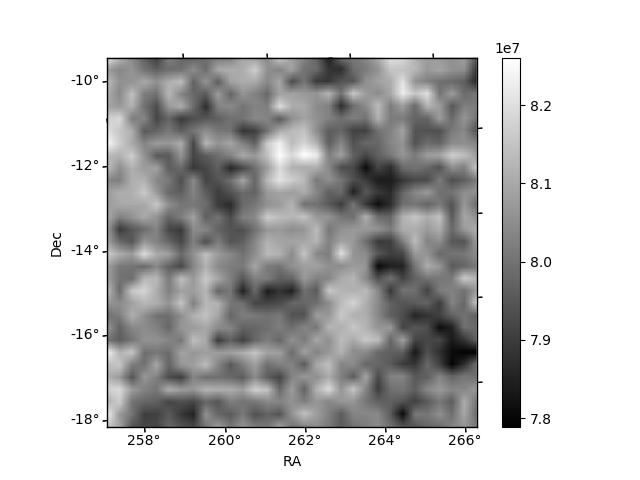
| Quadrant A | 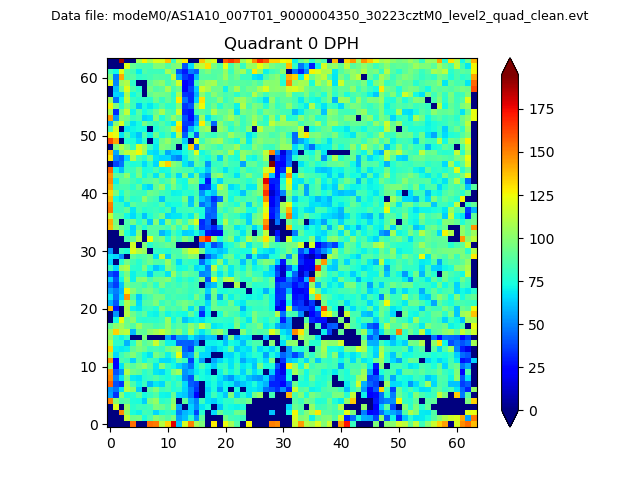 |
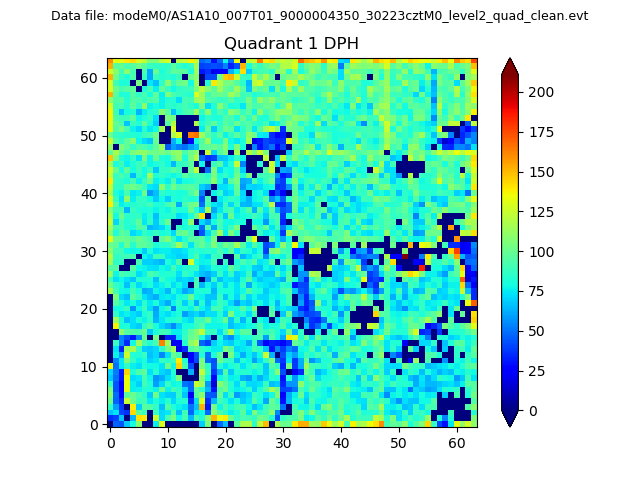 |
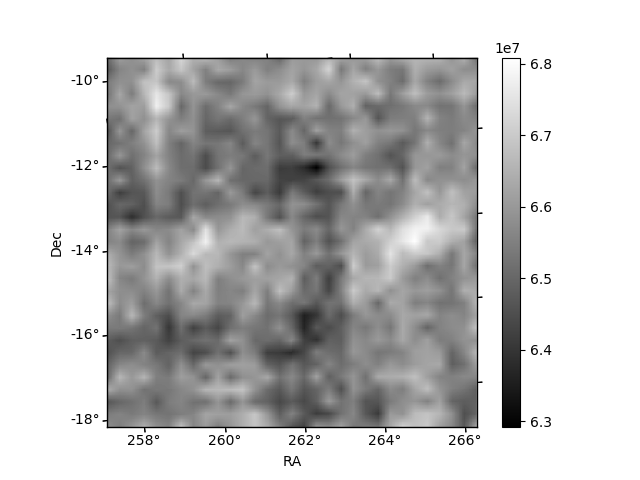
Quadrant B |
|---|---|---|---|
| Quadrant D | 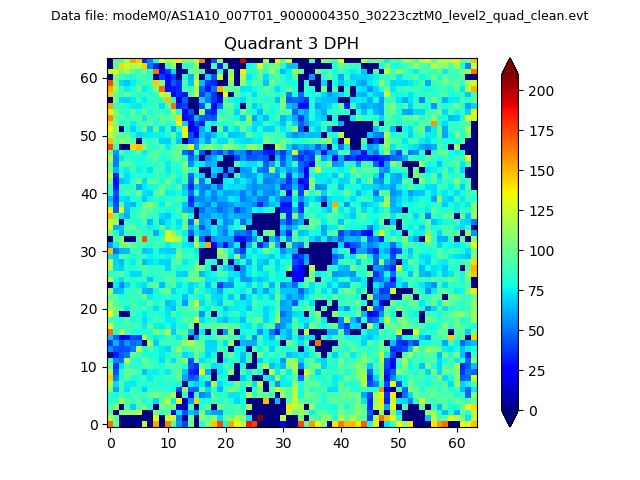 |
 |
Quadrant C |
| Plot type | Count rate plots | Images |
|---|---|---|
| Comparison with Poisson distribution Blue bars denote a histogram of data divided into 1 sec bins. Red curve is a Poisson curve with rate = median count rate of data. |
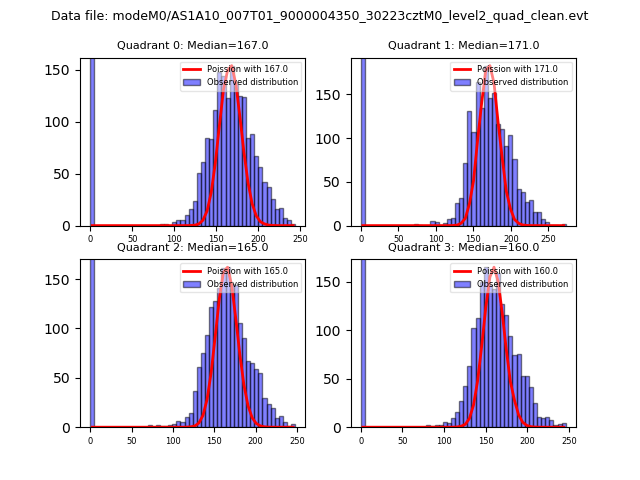 |
 |
| Quadrant-wise count rates Data is divided into 100 sec bins |
 |
|
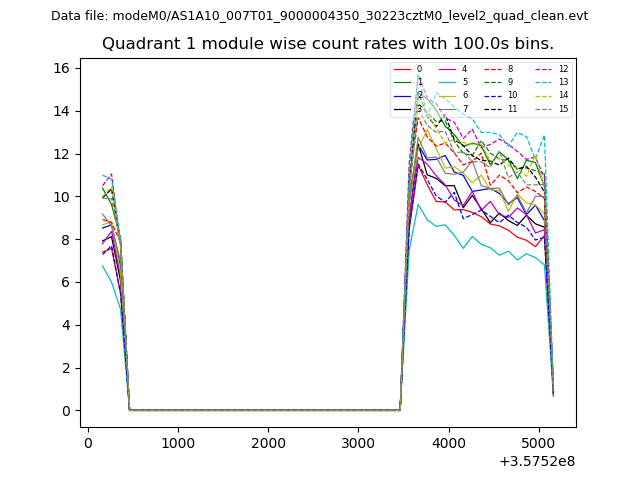
| Module-wise count rates for Quadrant A Data is divided into 100 sec bins |
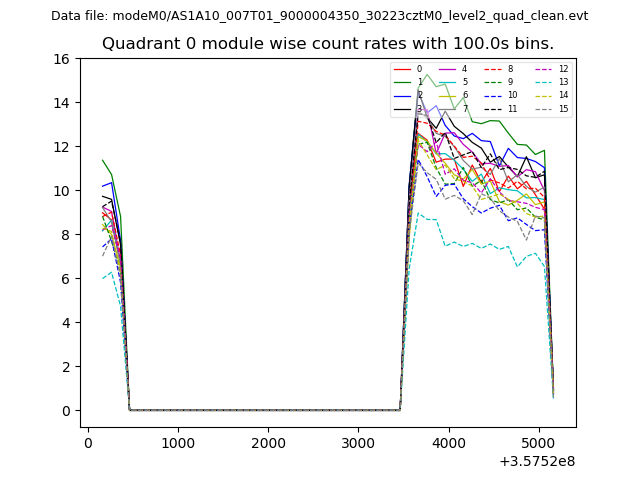 |
 |
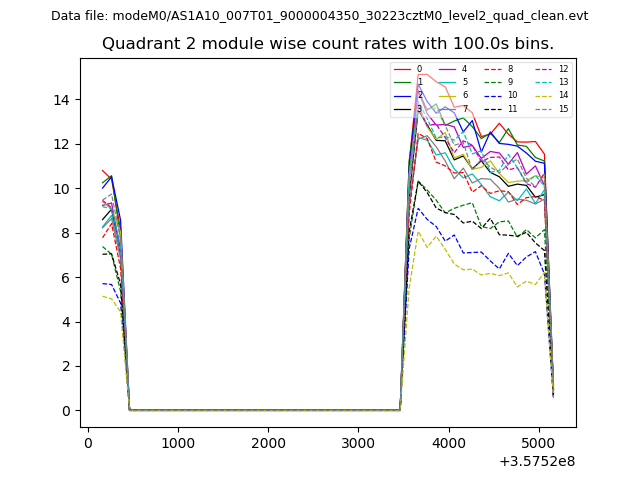
| Module-wise count rates for Quadrant B Data is divided into 100 sec bins |
 |
 |
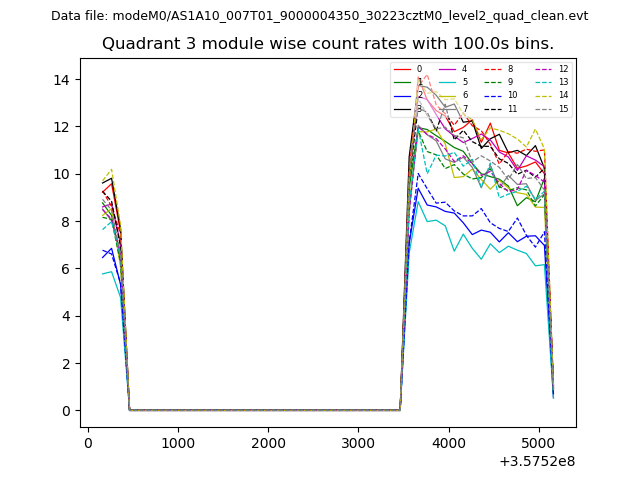
| Module-wise count rates for Quadrant C Data is divided into 100 sec bins |
 |
 |
| Module-wise count rates for Quadrant D Data is divided into 100 sec bins |
 |
 |
| Parameter | Plot |
|---|---|
| CZT HV Monitor | 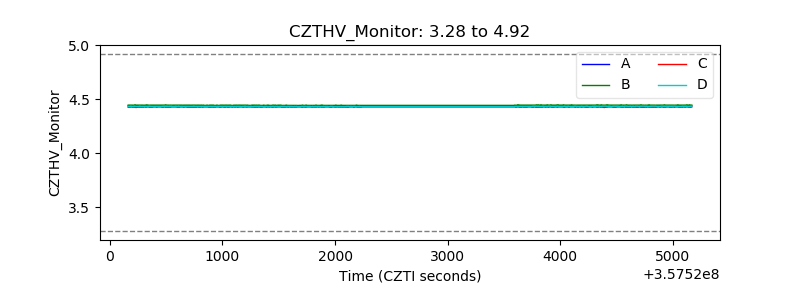 |
| D_VDD | 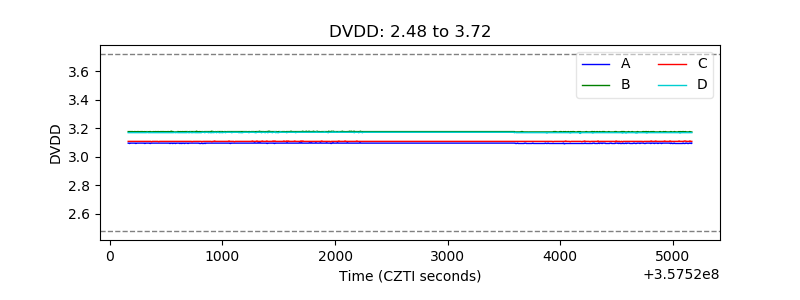 |
| Temperature 1 | 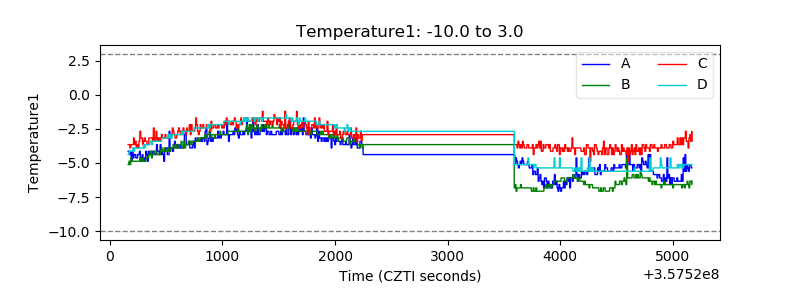 |
| Veto HV Monitor | 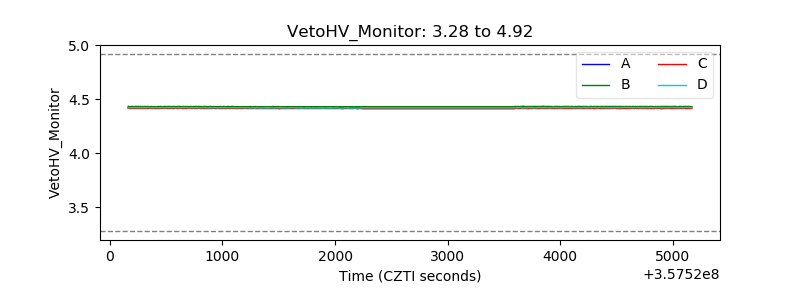 |
| Veto LLD | 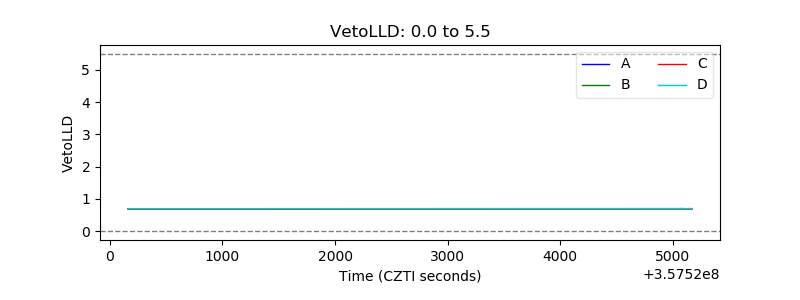 |
| Alpha Counter | 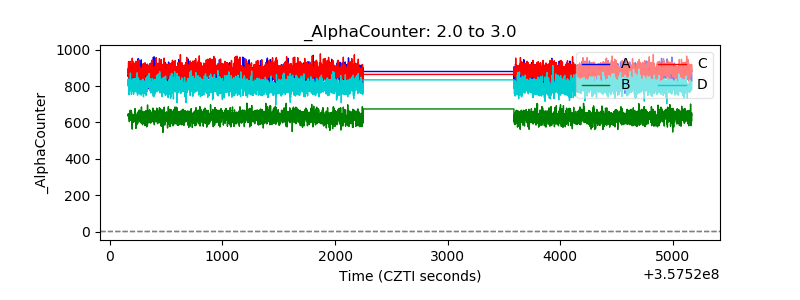 |
| _CPM_Rate | 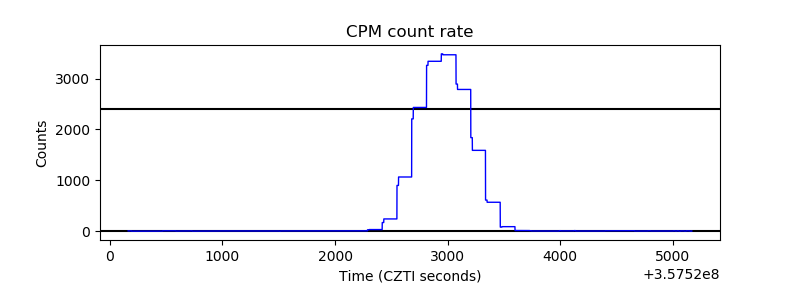 |
| CZT Counter | 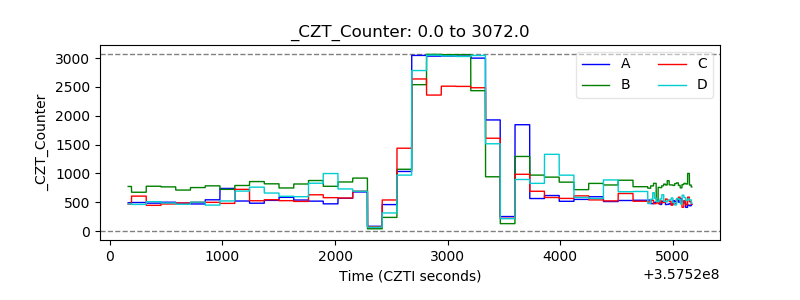 |
| +2.5 Volts monitor | 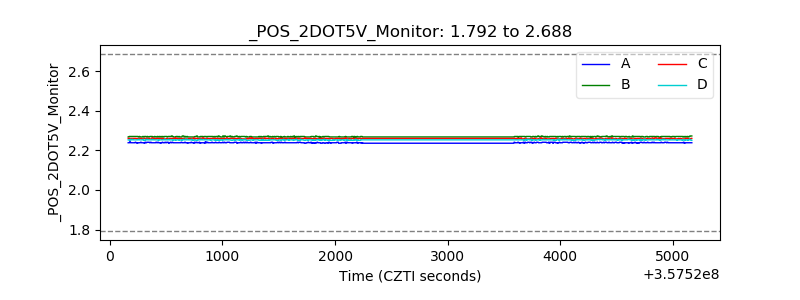 |
| +5 Volts monitor |  |
| _ROLL_ROT | 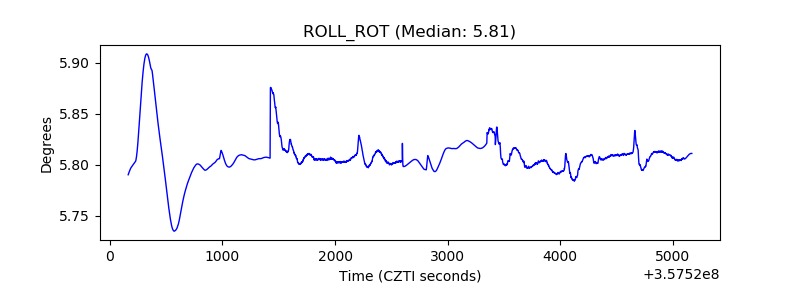 |
| _Roll_DEC | 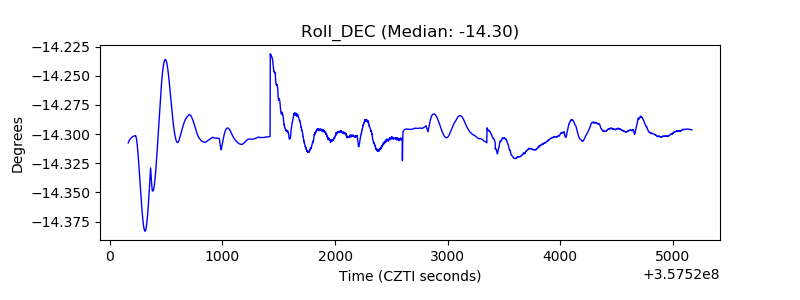 |
| _Roll_RA | 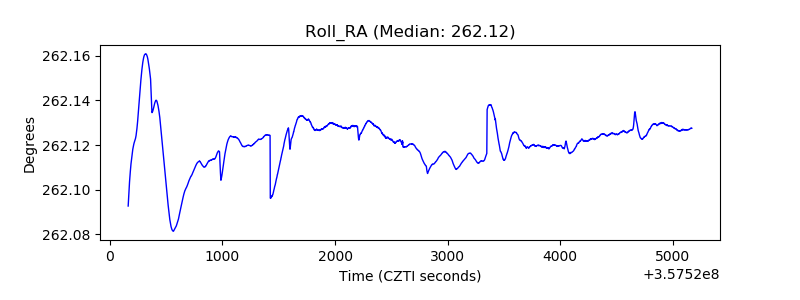 |
| Veto Counter | 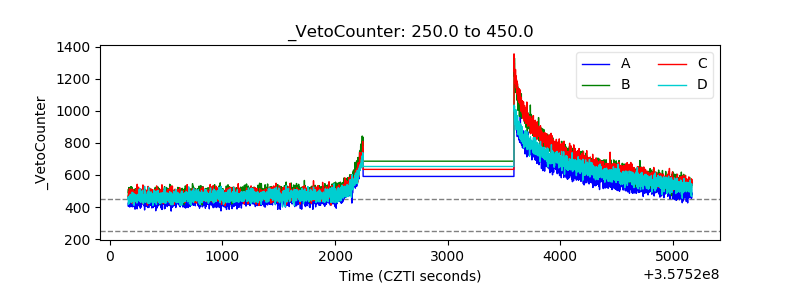 |