| Param | Original file | Final file |
|---|---|---|
| Filename | modeM0/AS1A10_007T01_9000004350_30224cztM0_level2.evt | modeM0/AS1A10_007T01_9000004350_30224cztM0_level2_quad_clean.evt |
| Size (bytes) | 569,724,480 | 109,451,520 |
| Size | 543.3 MB | 104.4 MB |
| Events in quadrant A | 3,536,371 | 717,737 |
| Events in quadrant B | 5,395,884 | 735,544 |
| Events in quadrant C | 3,656,044 | 707,782 |
| Events in quadrant D | 4,217,436 | 691,799 |
| Mode M9 | |||
|---|---|---|---|
| Quadrant | BADHDUFLAG | Total packets | Discarded packets |
| A | 0 | 21 | 0 |
| B | 0 | 22 | 0 |
| C | 0 | 22 | 0 |
| D | 0 | 22 | 0 |
| Mode SS | |||
|---|---|---|---|
| Quadrant | BADHDUFLAG | Total packets | Discarded packets |
| A | 0 | 134 | 0 |
| B | 0 | 134 | 0 |
| C | 0 | 134 | 0 |
| D | 0 | 134 | 0 |
| Mode M0 | |||
|---|---|---|---|
| Quadrant | BADHDUFLAG | Total packets | Discarded packets |
| A | 0 | 14341 | 2 |
| B | 0 | 20471 | 2 |
| C | 0 | 14763 | 2 |
| D | 0 | 16938 | 2 |
| Quadrant | Total seconds | Saturated seconds | Saturation percentage |
|---|---|---|---|
| A | 6628 | 96 | 1.448401% |
| B | 6628 | 170 | 2.564876% |
| C | 6628 | 150 | 2.263126% |
| D | 6628 | 77 | 1.161738% |
Noise dominated data is calculated using 1-second bins in cleaned event files. If a bin has >2000 counts, and if more than 50% of those come from <1% of pixels, then it is considered to be noise-dominated and hence unusable.
| Quadrant | # 1 sec bins | Bins with >0 counts | Bins with >2000 counts | High rate bins dominated by noise | Noise dominated (total time) | Noise dominated (detector-on time) | Marked lightcurve |
|---|---|---|---|---|---|---|---|
| A | 7948 | 6629 | 3 | 3 | 0.04% | 0.05% | 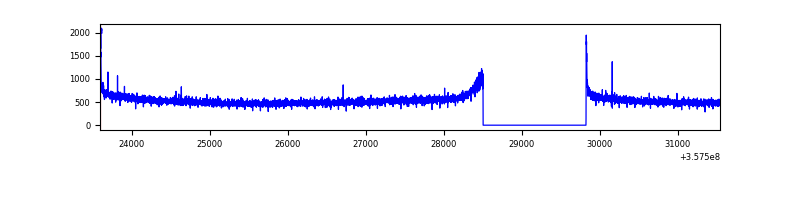 |
| B | 7948 | 6629 | 4 | 4 | 0.05% | 0.06% | 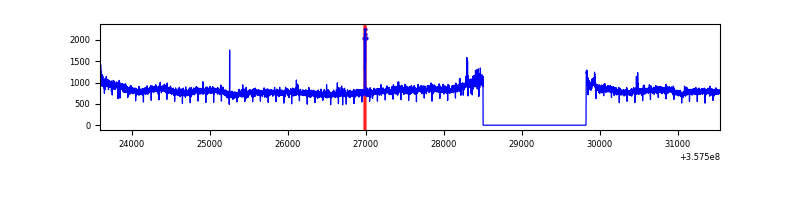 |
| C | 7948 | 6629 | 0 | 0 | 0.00% | 0.00% | 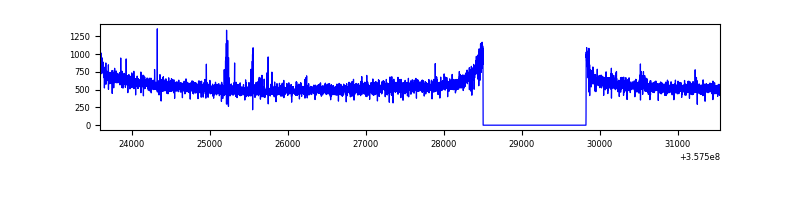 |
| D | 7948 | 6629 | 26 | 26 | 0.33% | 0.39% | 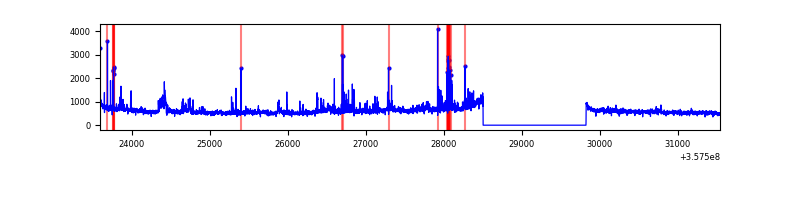 |
Top three noisy pixels from each quadrant. If the there are fewer than three noisy pixels in the level2.evt file, extra rows are filled as -1
| Pixel properties | Quadrant properties | ||||||
|---|---|---|---|---|---|---|---|
| Quadrant | DetID | PixID | Counts | Sigma | Mean | Median | Sigma |
| A | 8 | 192 | 25871 | 138.66 | 910 | 896 | 180.1 |
| A | 13 | 254 | 12166 | 62.57 | 910 | 896 | 180.1 |
| A | 3 | 137 | 8123 | 40.12 | 910 | 896 | 180.1 |
| B | 6 | 159 | 1807585 | 10747.72 | 902 | 881 | 168.1 |
| B | 12 | 111 | 19853 | 112.86 | 902 | 881 | 168.1 |
| B | 5 | 172 | 19571 | 111.18 | 902 | 881 | 168.1 |
| C | 14 | 238 | 155684 | 752.32 | 882 | 892 | 205.8 |
| C | 3 | 233 | 34466 | 163.18 | 882 | 892 | 205.8 |
| C | 14 | 254 | 17966 | 82.98 | 882 | 892 | 205.8 |
| D | 1 | 52 | 303850 | 1442.99 | 882 | 864 | 210.0 |
| D | 8 | 195 | 273462 | 1298.26 | 882 | 864 | 210.0 |
| D | 7 | 223 | 204586 | 970.24 | 882 | 864 | 210.0 |
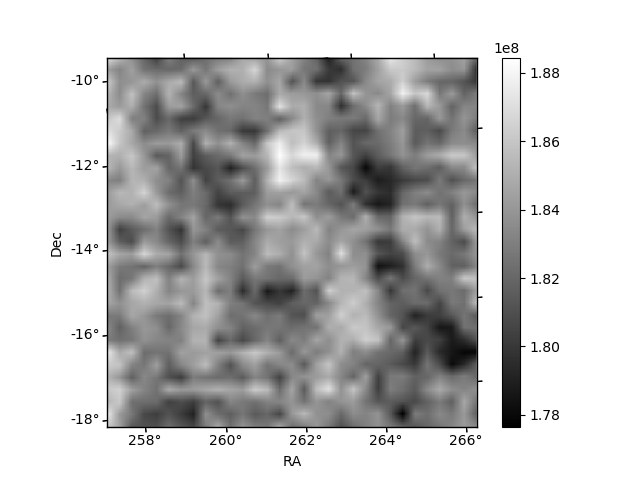
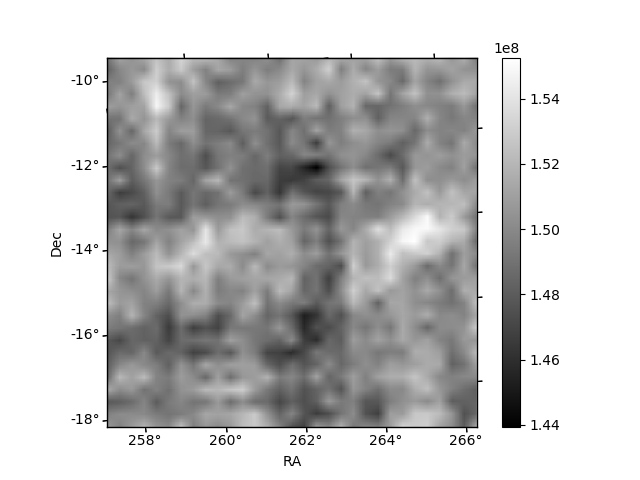
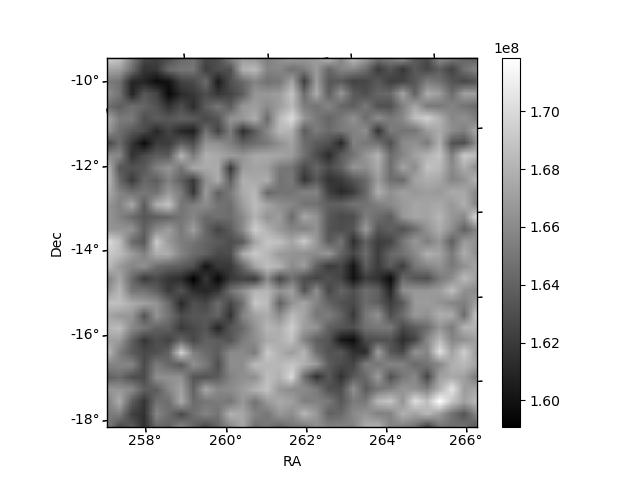
Histogram calculated using DETX and DETY for each event in the final _common_clean file
| Quadrant A |  |
 |
Quadrant B |
|---|---|---|---|
| Quadrant D |  |
 |
Quadrant C |
| Plot type | Count rate plots | Images |
|---|---|---|
| Comparison with Poisson distribution Blue bars denote a histogram of data divided into 1 sec bins. Red curve is a Poisson curve with rate = median count rate of data. |
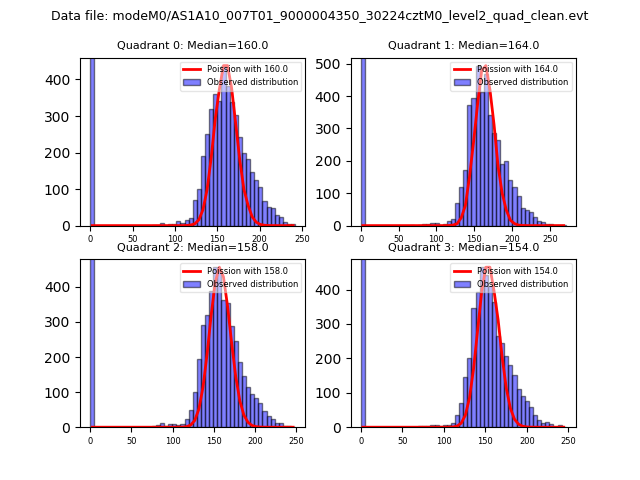 |
 |
| Quadrant-wise count rates Data is divided into 100 sec bins |
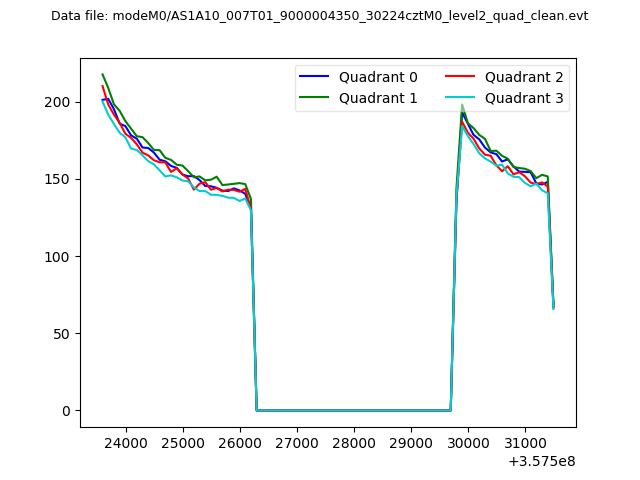 |
|
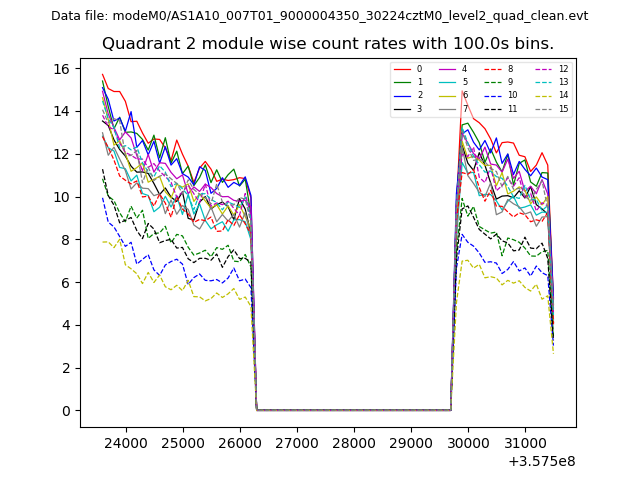
| Module-wise count rates for Quadrant A Data is divided into 100 sec bins |
 |
 |
| Module-wise count rates for Quadrant B Data is divided into 100 sec bins |
 |
 |
| Module-wise count rates for Quadrant C Data is divided into 100 sec bins |
 |
 |
| Module-wise count rates for Quadrant D Data is divided into 100 sec bins |
 |
 |
| Parameter | Plot |
|---|---|
| CZT HV Monitor |  |
| D_VDD | 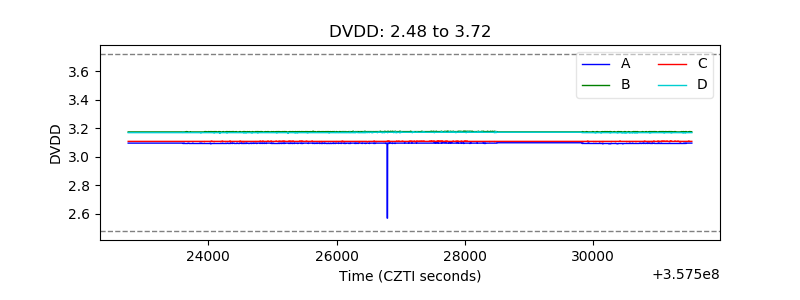 |
| Temperature 1 | 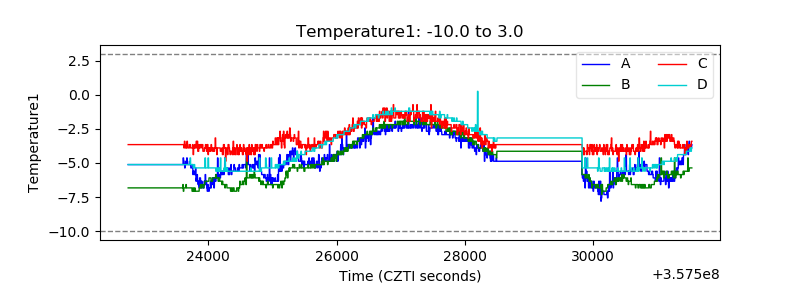 |
| Veto HV Monitor | 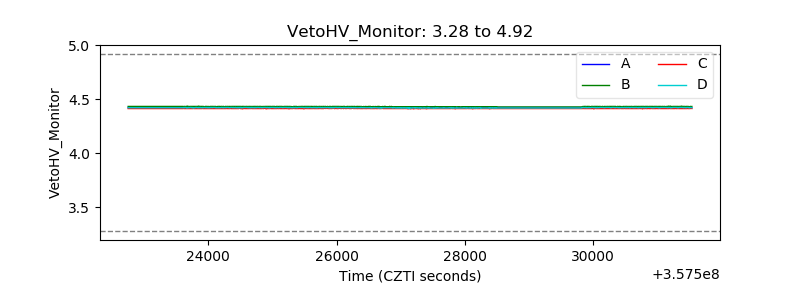 |
| Veto LLD | 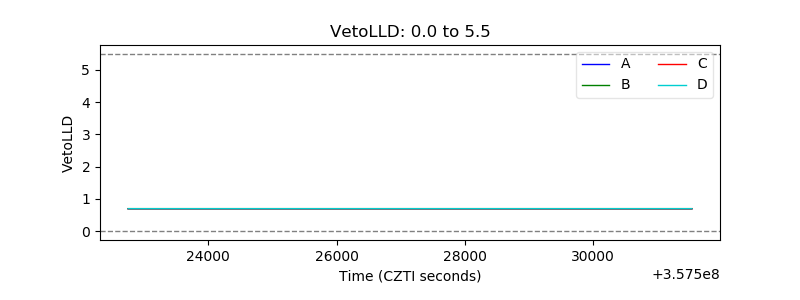 |
| Alpha Counter | 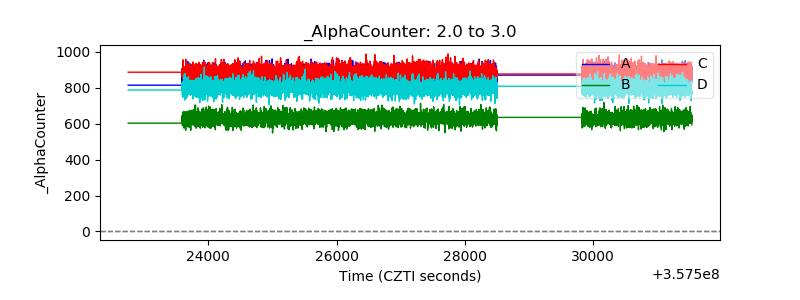 |
| _CPM_Rate | 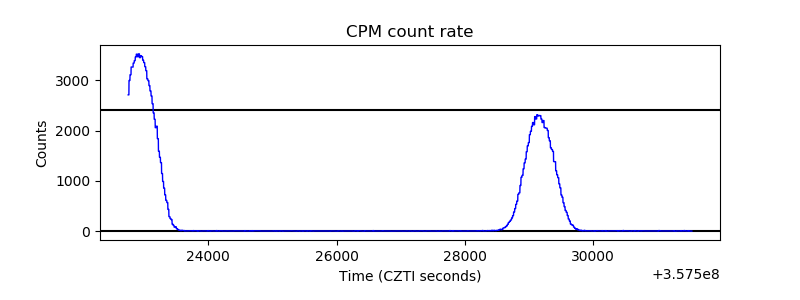 |
| CZT Counter | 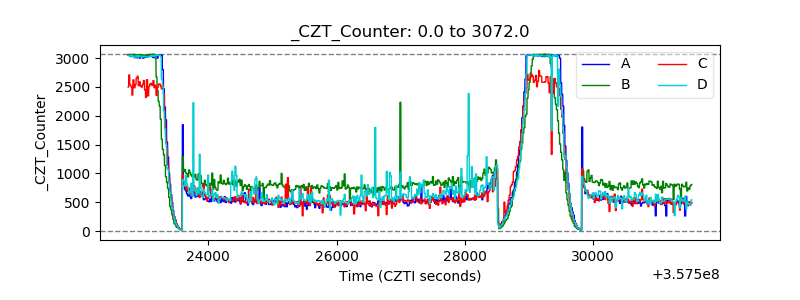 |
| +2.5 Volts monitor |  |
| +5 Volts monitor | 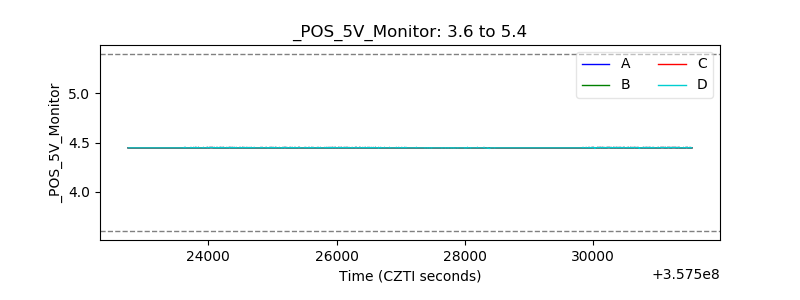 |
| _ROLL_ROT | 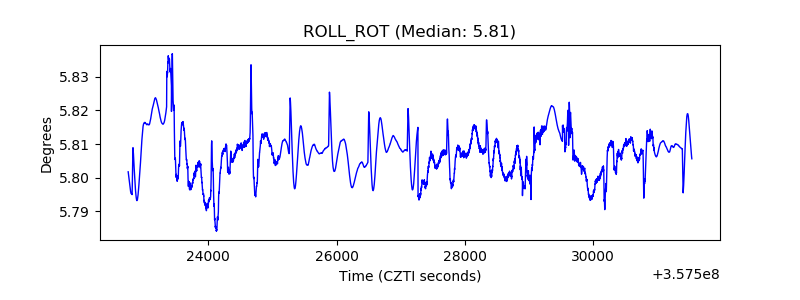 |
| _Roll_DEC | 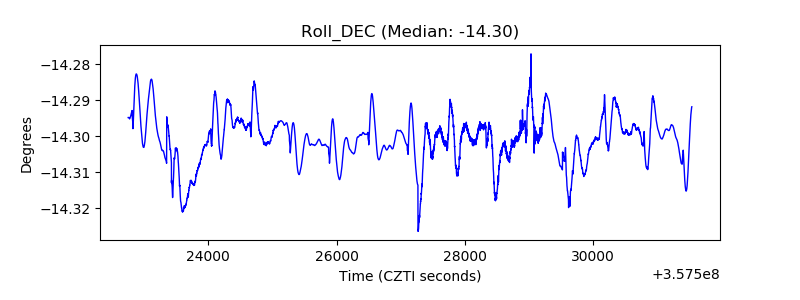 |
| _Roll_RA | 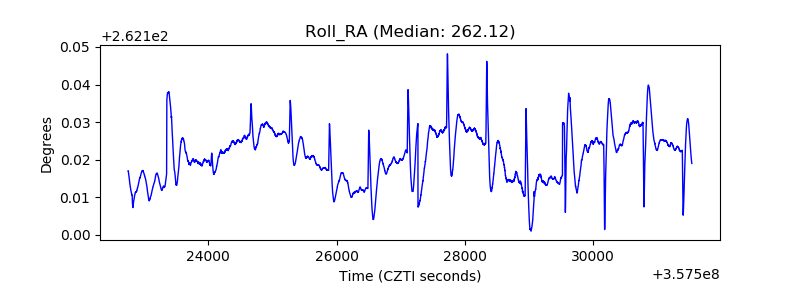 |
| Veto Counter | 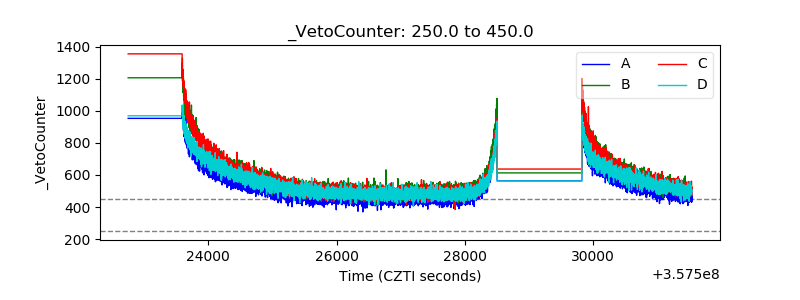 |