| Param | Original file | Final file |
|---|---|---|
| Filename | modeM0/AS1A10_007T01_9000004350_30226cztM0_level2.evt | modeM0/AS1A10_007T01_9000004350_30226cztM0_level2_quad_clean.evt |
| Size (bytes) | 575,424,000 | 100,128,960 |
| Size | 548.8 MB | 95.5 MB |
| Events in quadrant A | 3,488,230 | 644,337 |
| Events in quadrant B | 5,491,155 | 649,379 |
| Events in quadrant C | 3,749,970 | 631,493 |
| Events in quadrant D | 4,227,284 | 623,261 |
| Mode M9 | |||
|---|---|---|---|
| Quadrant | BADHDUFLAG | Total packets | Discarded packets |
| A | 0 | 10 | 0 |
| B | 0 | 11 | 0 |
| C | 0 | 11 | 0 |
| D | 0 | 11 | 0 |
| Mode SS | |||
|---|---|---|---|
| Quadrant | BADHDUFLAG | Total packets | Discarded packets |
| A | 0 | 140 | 0 |
| B | 0 | 140 | 0 |
| C | 0 | 140 | 0 |
| D | 0 | 140 | 0 |
| Mode M0 | |||
|---|---|---|---|
| Quadrant | BADHDUFLAG | Total packets | Discarded packets |
| A | 0 | 14422 | 2 |
| B | 0 | 21148 | 2 |
| C | 0 | 15406 | 2 |
| D | 0 | 16916 | 3 |
| Quadrant | Total seconds | Saturated seconds | Saturation percentage |
|---|---|---|---|
| A | 6951 | 41 | 0.589843% |
| B | 6951 | 107 | 1.539347% |
| C | 6951 | 101 | 1.453028% |
| D | 6950 | 54 | 0.776978% |
Noise dominated data is calculated using 1-second bins in cleaned event files. If a bin has >2000 counts, and if more than 50% of those come from <1% of pixels, then it is considered to be noise-dominated and hence unusable.
| Quadrant | # 1 sec bins | Bins with >0 counts | Bins with >2000 counts | High rate bins dominated by noise | Noise dominated (total time) | Noise dominated (detector-on time) | Marked lightcurve |
|---|---|---|---|---|---|---|---|
| A | 7981 | 6952 | 0 | 0 | 0.00% | 0.00% | 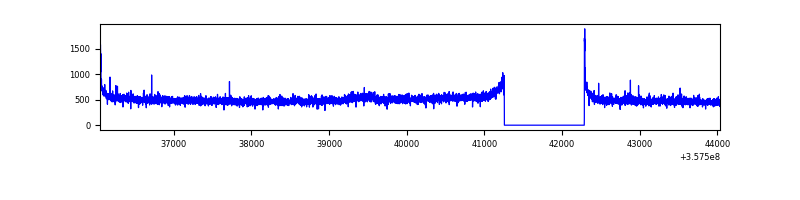 |
| B | 7981 | 6952 | 0 | 0 | 0.00% | 0.00% | 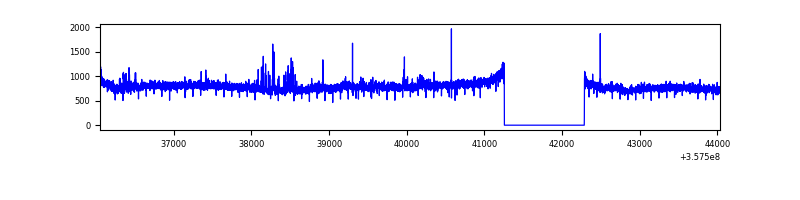 |
| C | 7981 | 6952 | 1 | 1 | 0.01% | 0.01% | 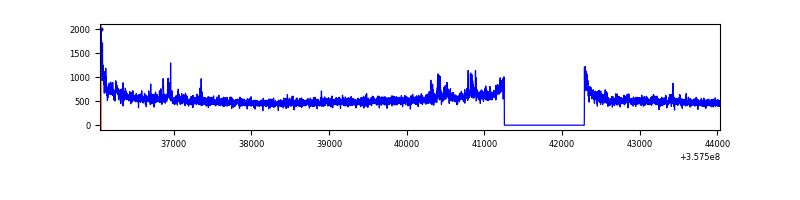 |
| D | 7980 | 6951 | 33 | 33 | 0.41% | 0.47% | 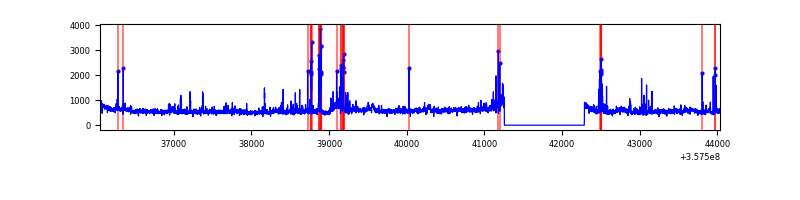 |
Top three noisy pixels from each quadrant. If the there are fewer than three noisy pixels in the level2.evt file, extra rows are filled as -1
| Pixel properties | Quadrant properties | ||||||
|---|---|---|---|---|---|---|---|
| Quadrant | DetID | PixID | Counts | Sigma | Mean | Median | Sigma |
| A | 15 | 174 | 22322 | 119.55 | 892 | 875 | 179.4 |
| A | 8 | 192 | 22266 | 119.23 | 892 | 875 | 179.4 |
| A | 13 | 254 | 12767 | 66.29 | 892 | 875 | 179.4 |
| B | 6 | 159 | 1942270 | 11486.57 | 878 | 856 | 169.0 |
| B | 0 | 190 | 40044 | 231.86 | 878 | 856 | 169.0 |
| B | 0 | 230 | 35312 | 203.86 | 878 | 856 | 169.0 |
| C | 3 | 233 | 252496 | 1264.1 | 856 | 863 | 199.1 |
| C | 14 | 238 | 139226 | 695.08 | 856 | 863 | 199.1 |
| C | 2 | 114 | 16495 | 78.53 | 856 | 863 | 199.1 |
| D | 8 | 195 | 328927 | 1558.36 | 866 | 848 | 210.5 |
| D | 1 | 52 | 309582 | 1466.47 | 866 | 848 | 210.5 |
| D | 7 | 223 | 247965 | 1173.79 | 866 | 848 | 210.5 |
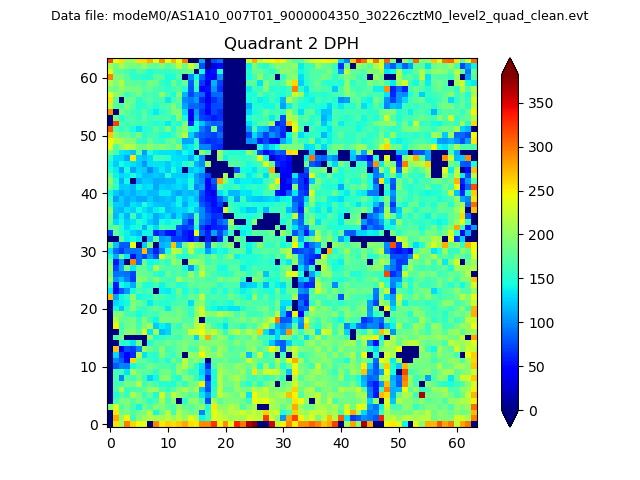
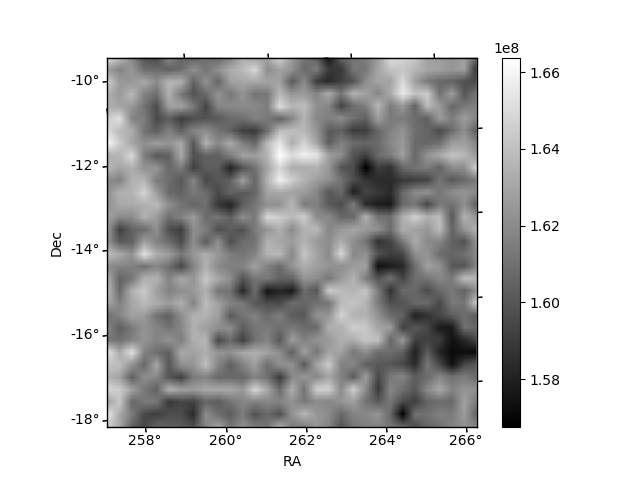
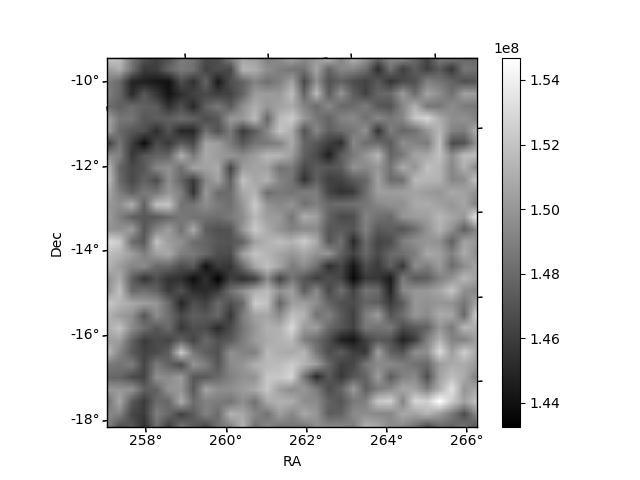
Histogram calculated using DETX and DETY for each event in the final _common_clean file
| Quadrant A | 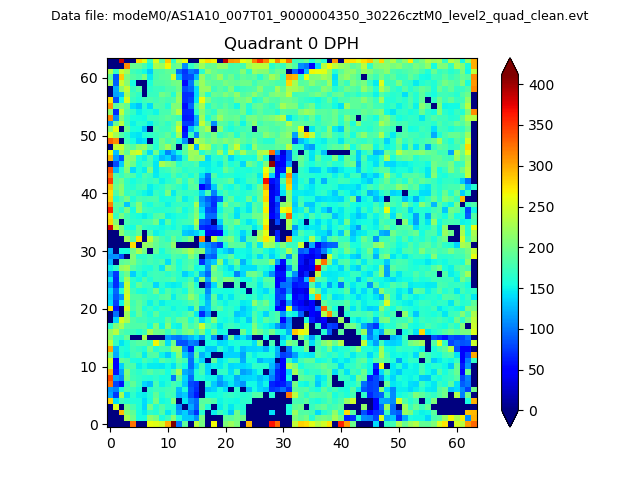 |
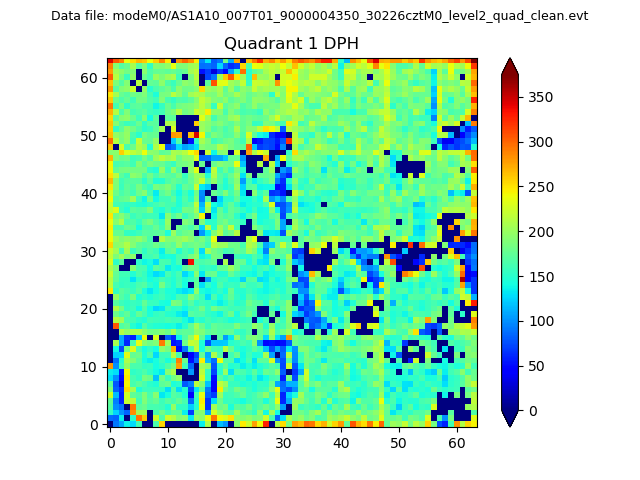 |
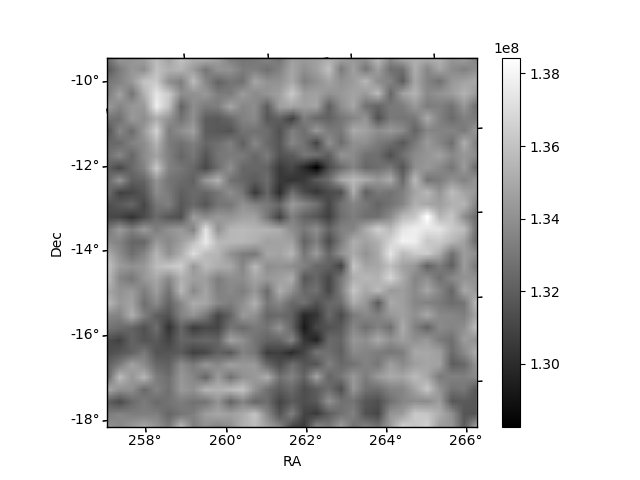
Quadrant B |
|---|---|---|---|
| Quadrant D | 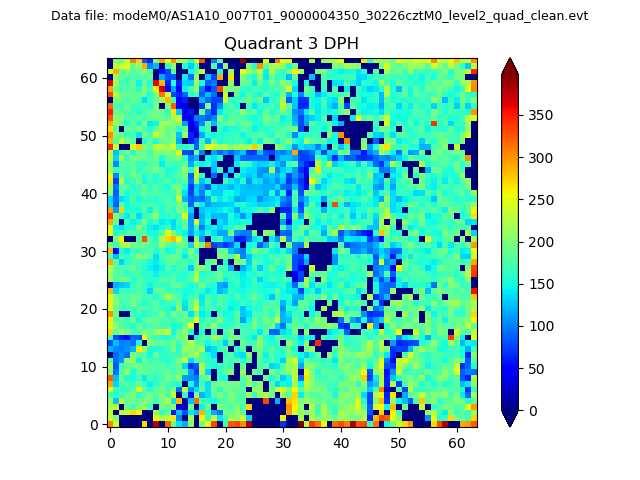 |
 |
Quadrant C |
| Plot type | Count rate plots | Images |
|---|---|---|
| Comparison with Poisson distribution Blue bars denote a histogram of data divided into 1 sec bins. Red curve is a Poisson curve with rate = median count rate of data. |
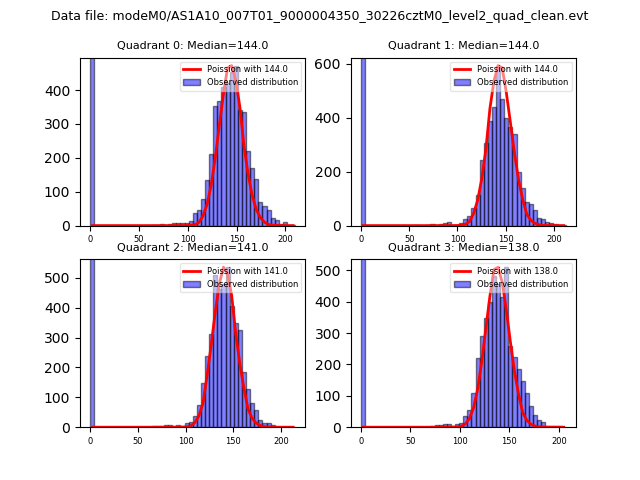 |
 |
| Quadrant-wise count rates Data is divided into 100 sec bins |
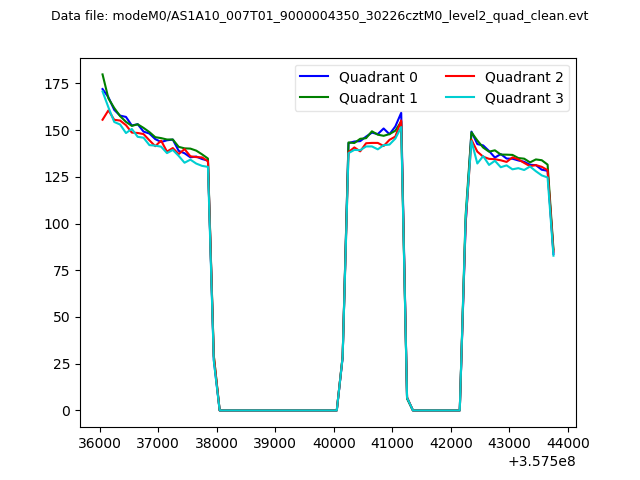 |
|
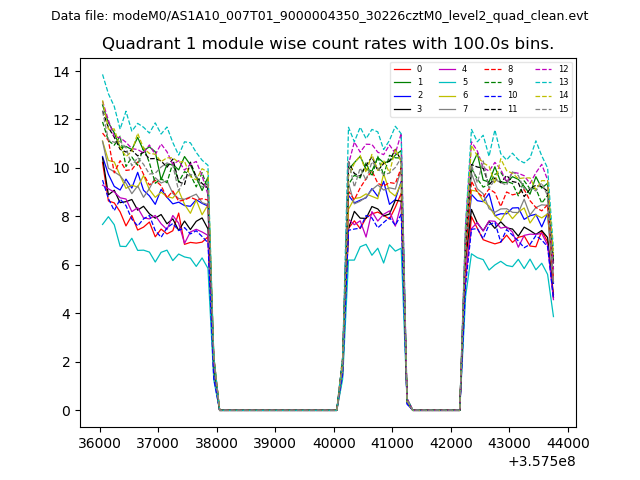
| Module-wise count rates for Quadrant A Data is divided into 100 sec bins |
 |
 |
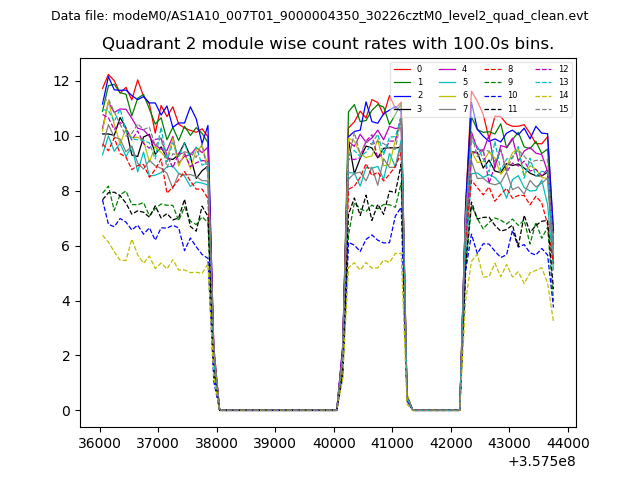
| Module-wise count rates for Quadrant B Data is divided into 100 sec bins |
 |
 |
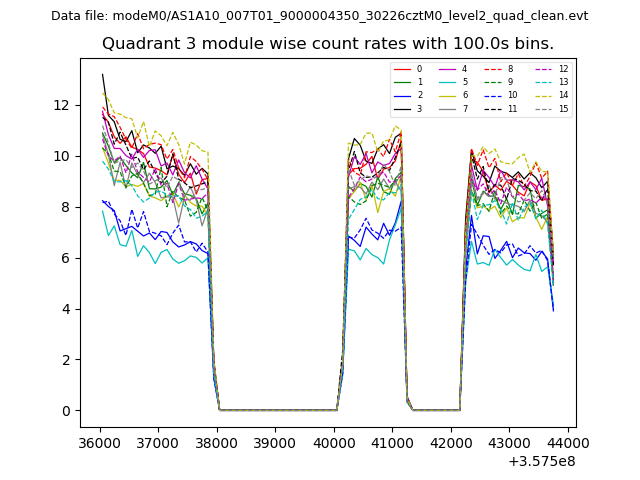
| Module-wise count rates for Quadrant C Data is divided into 100 sec bins |
 |
 |
| Module-wise count rates for Quadrant D Data is divided into 100 sec bins |
 |
 |
| Parameter | Plot |
|---|---|
| CZT HV Monitor | 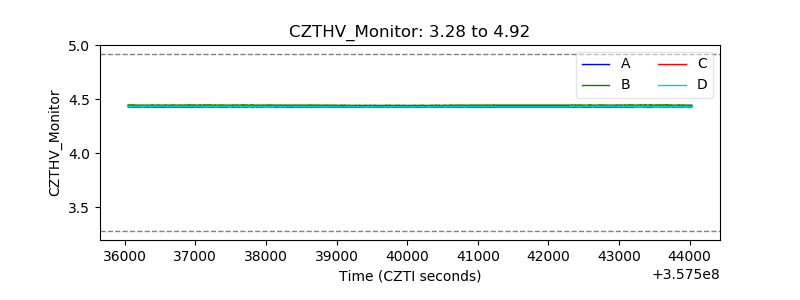 |
| D_VDD | 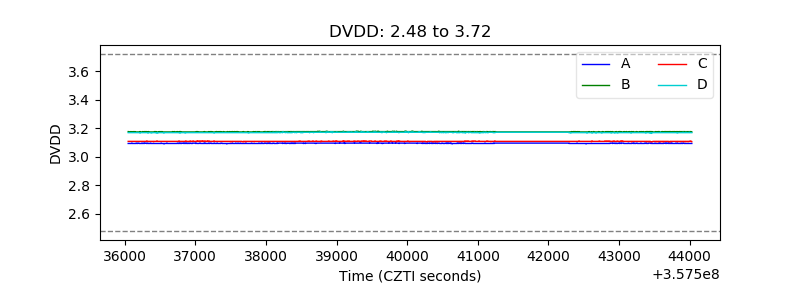 |
| Temperature 1 | 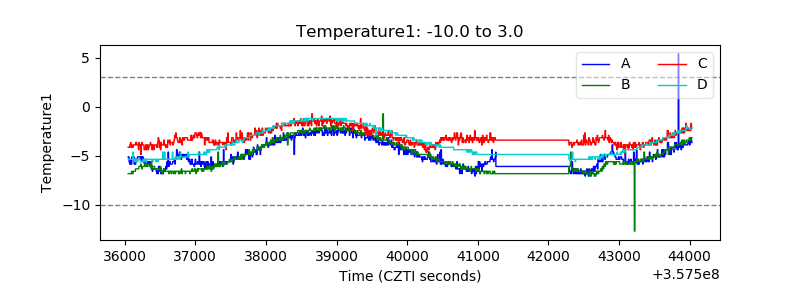 |
| Veto HV Monitor | 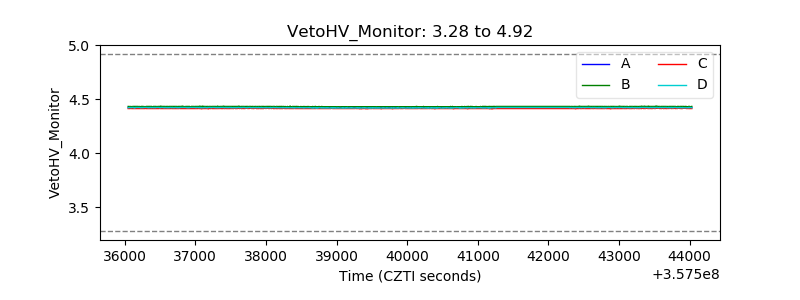 |
| Veto LLD | 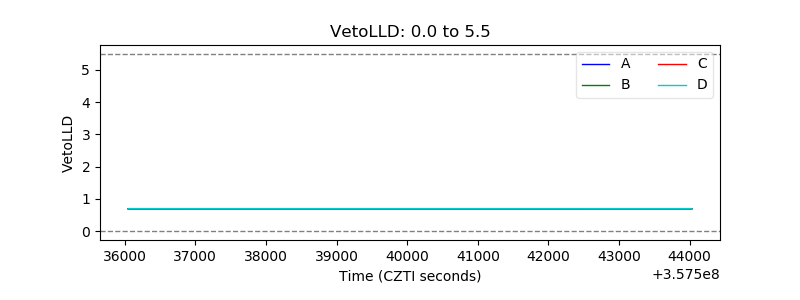 |
| Alpha Counter | 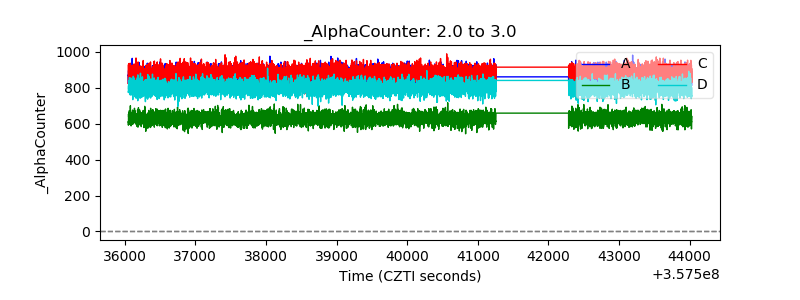 |
| _CPM_Rate |  |
| CZT Counter | 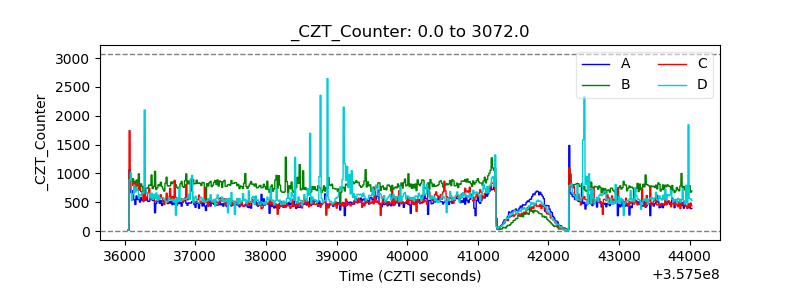 |
| +2.5 Volts monitor | 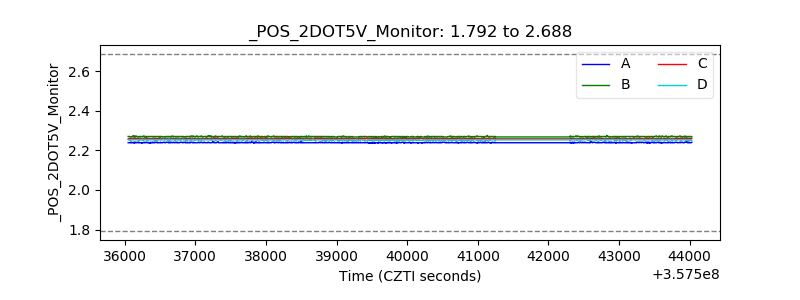 |
| +5 Volts monitor |  |
| _ROLL_ROT | 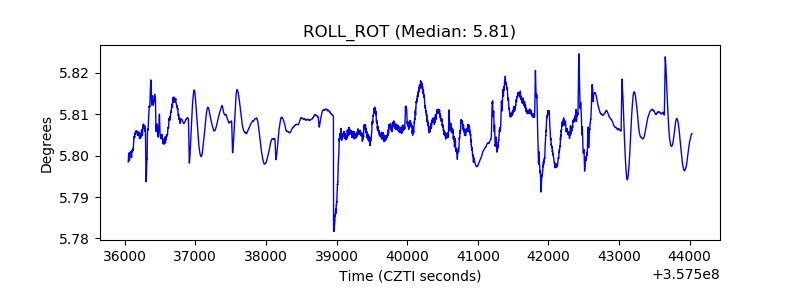 |
| _Roll_DEC | 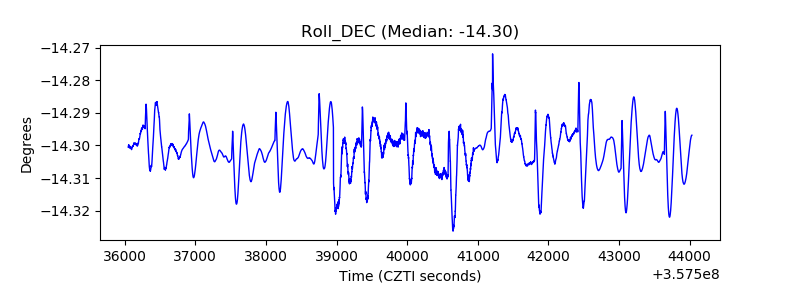 |
| _Roll_RA | 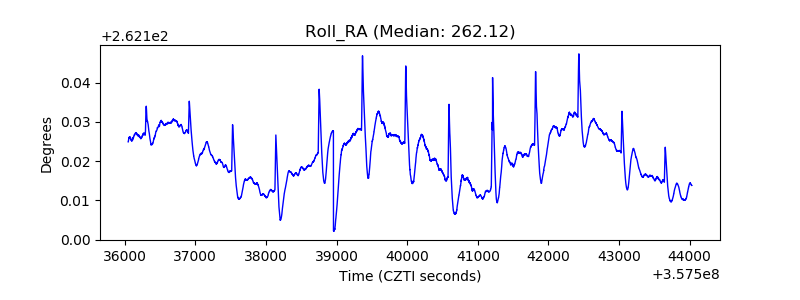 |
| Veto Counter | 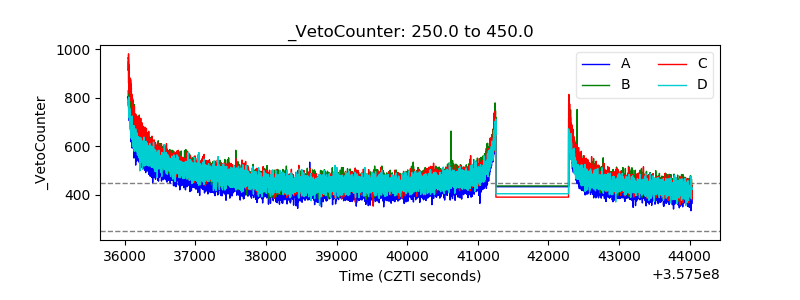 |