| Param | Original file | Final file |
|---|---|---|
| Filename | modeM0/AS1A10_007T01_9000004350_30228cztM0_level2.evt | modeM0/AS1A10_007T01_9000004350_30228cztM0_level2_quad_clean.evt |
| Size (bytes) | 597,945,600 | 92,088,000 |
| Size | 570.2 MB | 87.8 MB |
| Events in quadrant A | 3,847,912 | 569,953 |
| Events in quadrant B | 5,793,561 | 570,847 |
| Events in quadrant C | 3,951,086 | 563,464 |
| Events in quadrant D | 4,004,079 | 558,334 |
| Mode SS | |||
|---|---|---|---|
| Quadrant | BADHDUFLAG | Total packets | Discarded packets |
| A | 0 | 152 | 0 |
| B | 0 | 152 | 0 |
| C | 0 | 152 | 0 |
| D | 0 | 152 | 0 |
| Mode M0 | |||
|---|---|---|---|
| Quadrant | BADHDUFLAG | Total packets | Discarded packets |
| A | 0 | 16276 | 0 |
| B | 0 | 23076 | 0 |
| C | 0 | 16304 | 0 |
| D | 0 | 16496 | 0 |
| Quadrant | Total seconds | Saturated seconds | Saturation percentage |
|---|---|---|---|
| A | 7553 | 285 | 3.773335% |
| B | 7554 | 364 | 4.818639% |
| C | 7554 | 329 | 4.355308% |
| D | 7554 | 189 | 2.501986% |
Noise dominated data is calculated using 1-second bins in cleaned event files. If a bin has >2000 counts, and if more than 50% of those come from <1% of pixels, then it is considered to be noise-dominated and hence unusable.
| Quadrant | # 1 sec bins | Bins with >0 counts | Bins with >2000 counts | High rate bins dominated by noise | Noise dominated (total time) | Noise dominated (detector-on time) | Marked lightcurve |
|---|---|---|---|---|---|---|---|
| A | 7553 | 7553 | 21 | 21 | 0.28% | 0.28% | 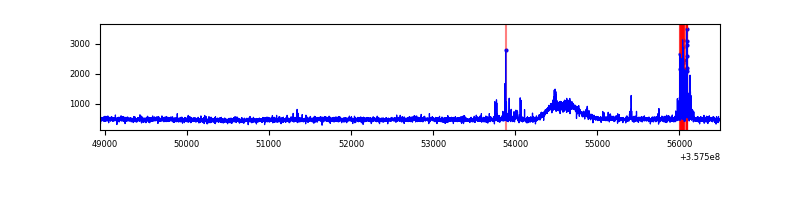 |
| B | 7554 | 7554 | 1 | 1 | 0.01% | 0.01% | 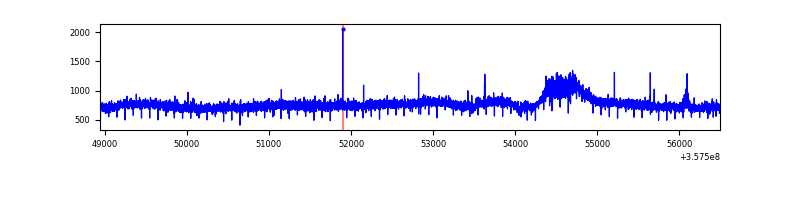 |
| C | 7554 | 7554 | 39 | 39 | 0.52% | 0.52% | 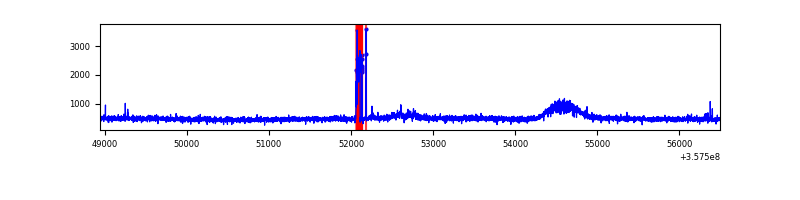 |
| D | 7554 | 7554 | 4 | 4 | 0.05% | 0.05% | 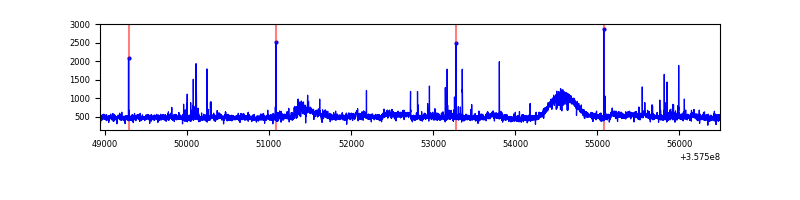 |
Top three noisy pixels from each quadrant. If the there are fewer than three noisy pixels in the level2.evt file, extra rows are filled as -1
| Pixel properties | Quadrant properties | ||||||
|---|---|---|---|---|---|---|---|
| Quadrant | DetID | PixID | Counts | Sigma | Mean | Median | Sigma |
| A | 14 | 239 | 164747 | 839.55 | 954 | 931 | 195.1 |
| A | 13 | 254 | 13842 | 66.17 | 954 | 931 | 195.1 |
| A | 3 | 137 | 10082 | 46.9 | 954 | 931 | 195.1 |
| B | 6 | 159 | 2105384 | 11335.89 | 934 | 906 | 185.6 |
| B | 12 | 111 | 23192 | 120.04 | 934 | 906 | 185.6 |
| B | 11 | 111 | 21272 | 109.7 | 934 | 906 | 185.6 |
| C | 3 | 233 | 208843 | 954.84 | 917 | 923 | 217.8 |
| C | 14 | 238 | 146606 | 669.03 | 917 | 923 | 217.8 |
| C | 2 | 114 | 17808 | 77.54 | 917 | 923 | 217.8 |
| D | 8 | 195 | 320120 | 1383.7 | 935 | 910 | 230.7 |
| D | 12 | 227 | 53419 | 227.61 | 935 | 910 | 230.7 |
| D | 2 | 250 | 43695 | 185.46 | 935 | 910 | 230.7 |
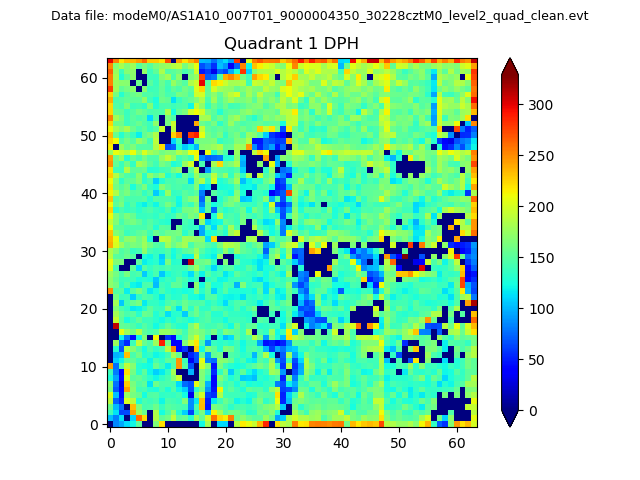
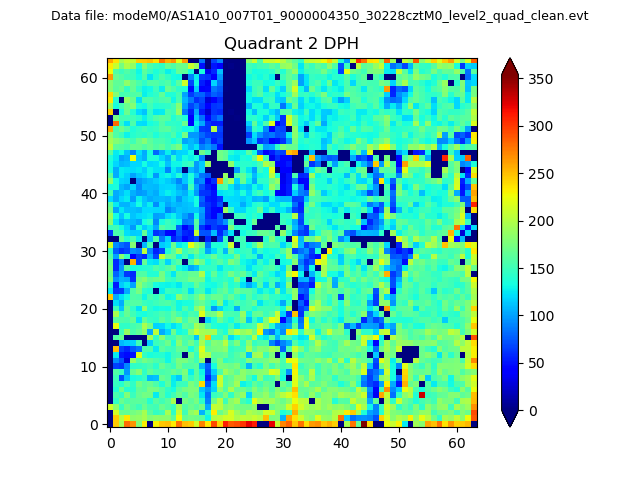
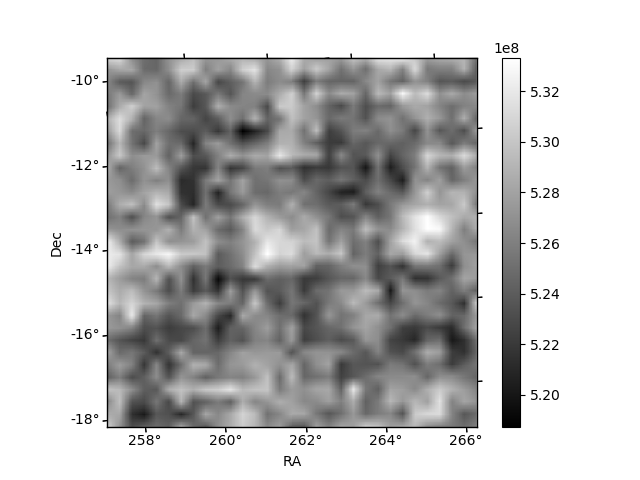
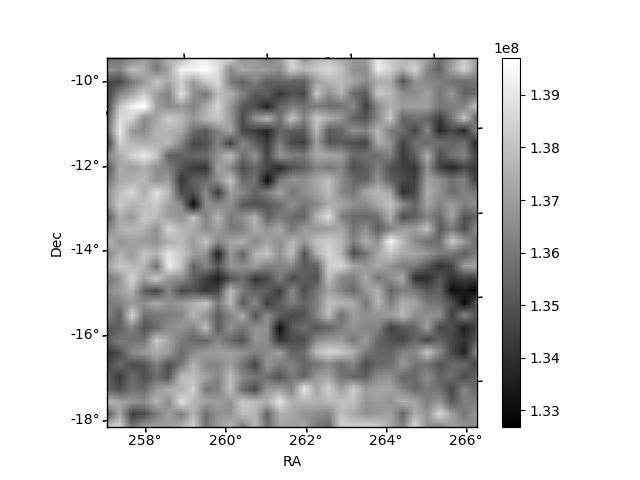
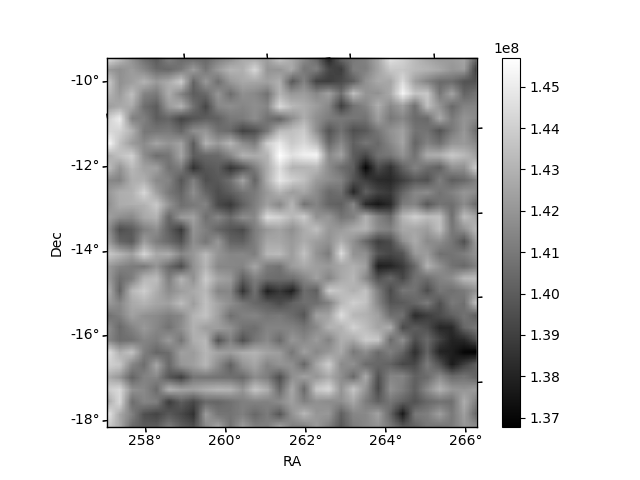
Histogram calculated using DETX and DETY for each event in the final _common_clean file
| Quadrant A |  |
 |
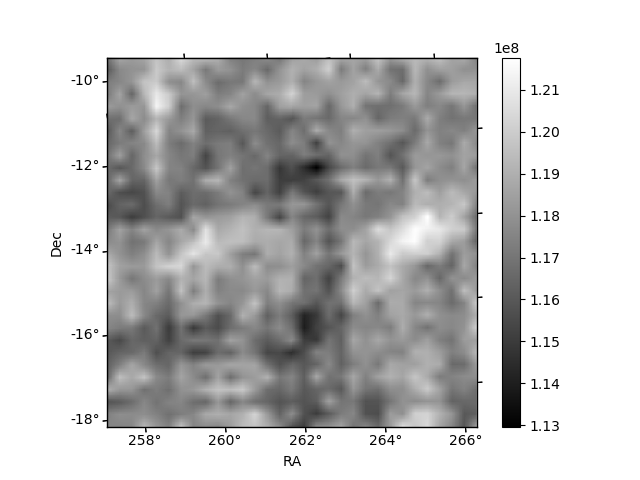
Quadrant B |
|---|---|---|---|
| Quadrant D | 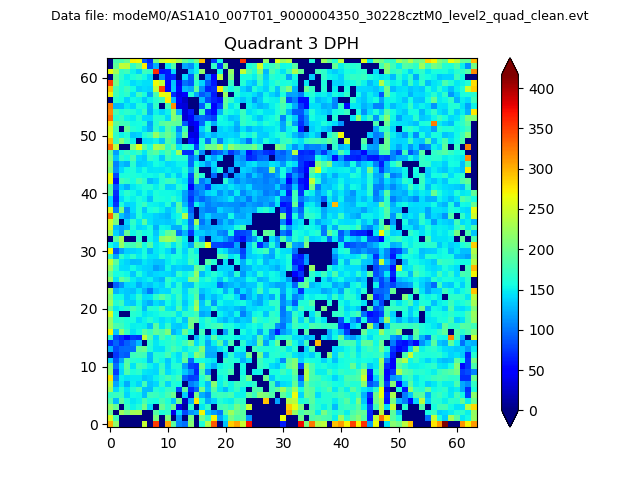 |
 |
Quadrant C |
| Plot type | Count rate plots | Images |
|---|---|---|
| Comparison with Poisson distribution Blue bars denote a histogram of data divided into 1 sec bins. Red curve is a Poisson curve with rate = median count rate of data. |
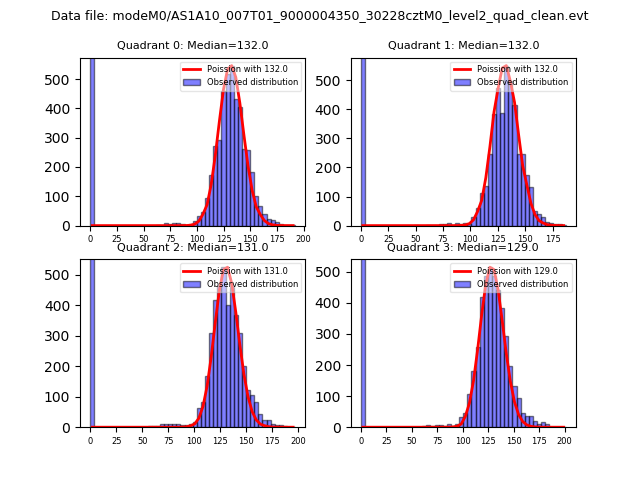 |
 |
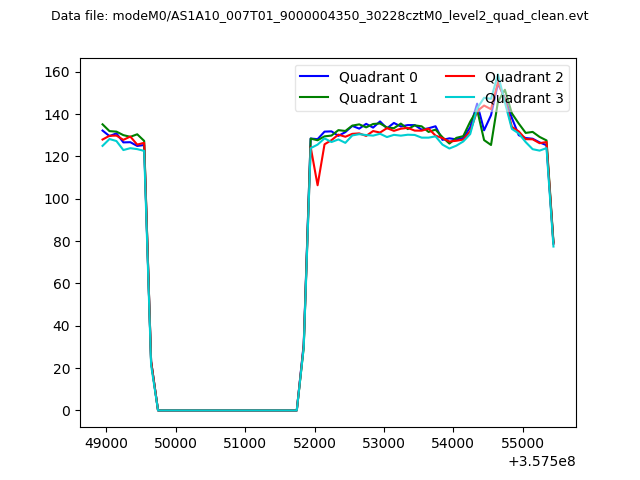
| Quadrant-wise count rates Data is divided into 100 sec bins |
 |
|
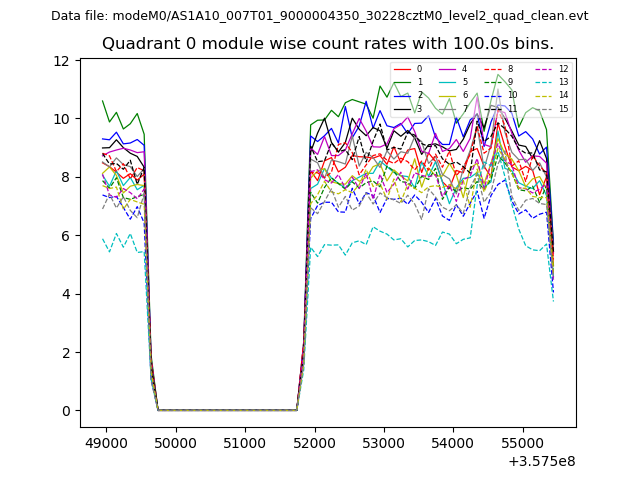
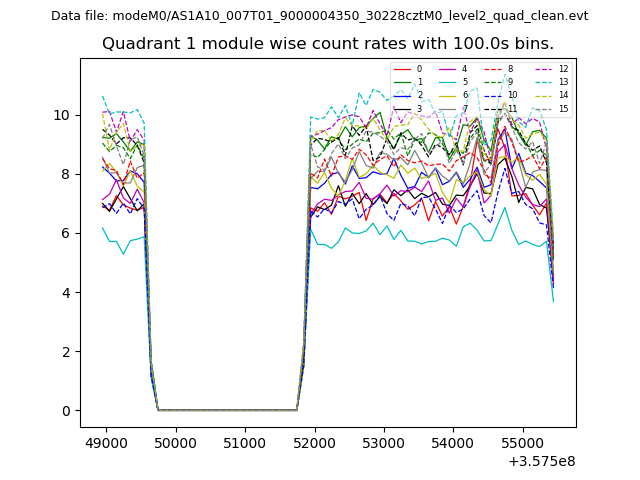
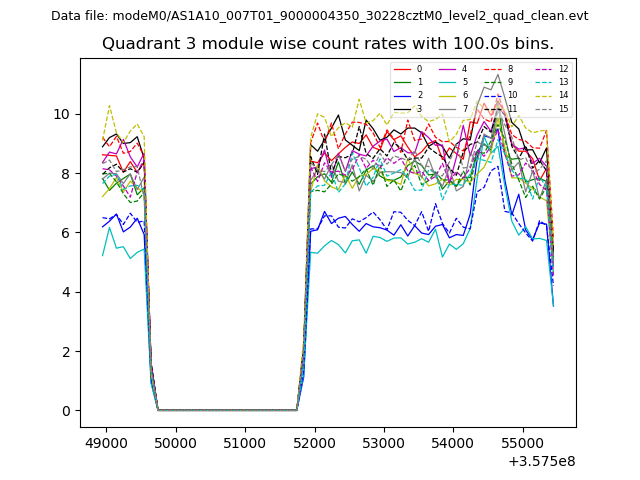
| Module-wise count rates for Quadrant A Data is divided into 100 sec bins |
 |
 |
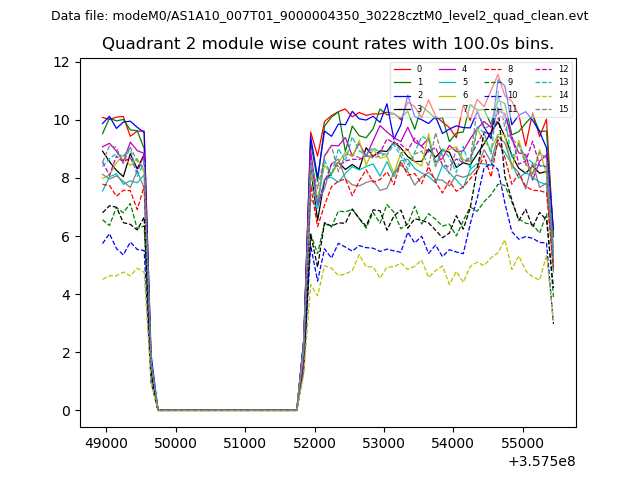
| Module-wise count rates for Quadrant B Data is divided into 100 sec bins |
 |
 |
| Module-wise count rates for Quadrant C Data is divided into 100 sec bins |
 |
 |
| Module-wise count rates for Quadrant D Data is divided into 100 sec bins |
 |
 |
| Parameter | Plot |
|---|---|
| CZT HV Monitor | 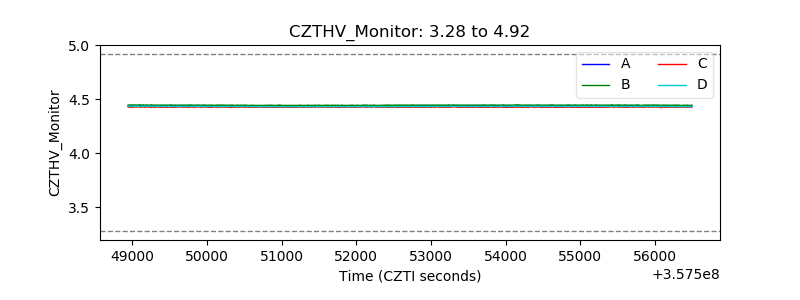 |
| D_VDD | 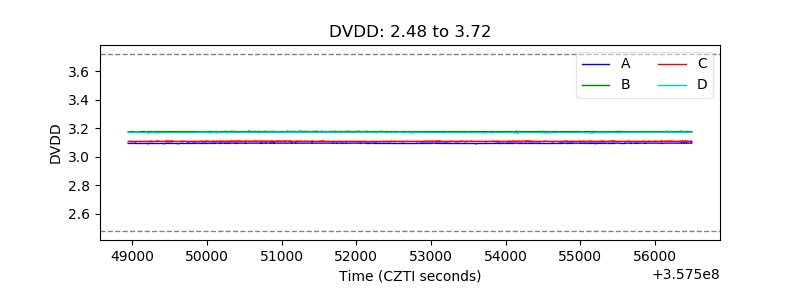 |
| Temperature 1 | 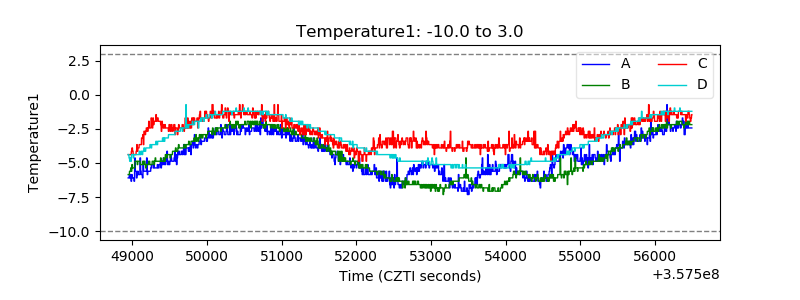 |
| Veto HV Monitor | 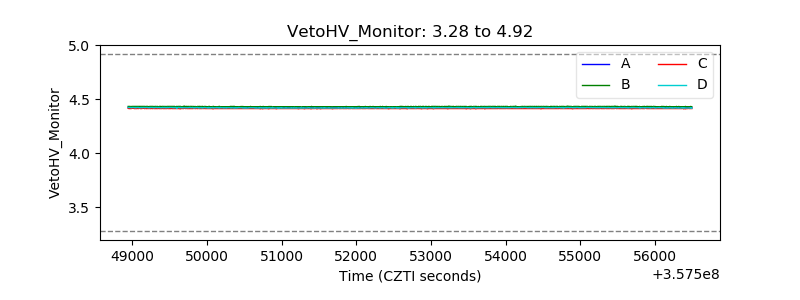 |
| Veto LLD |  |
| Alpha Counter | 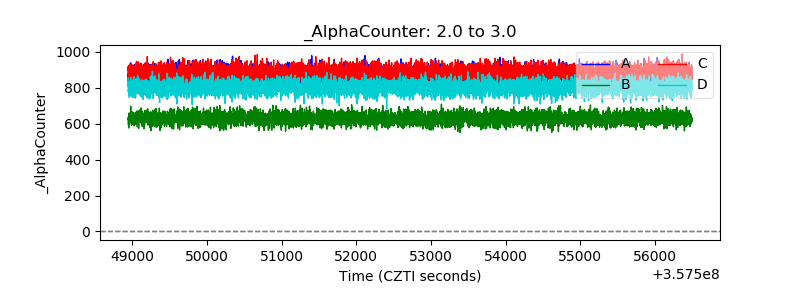 |
| _CPM_Rate | 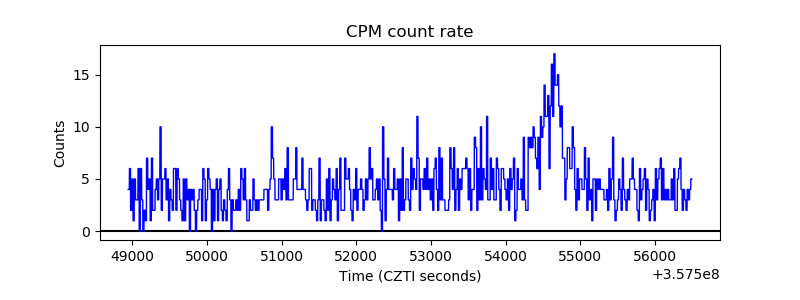 |
| CZT Counter | 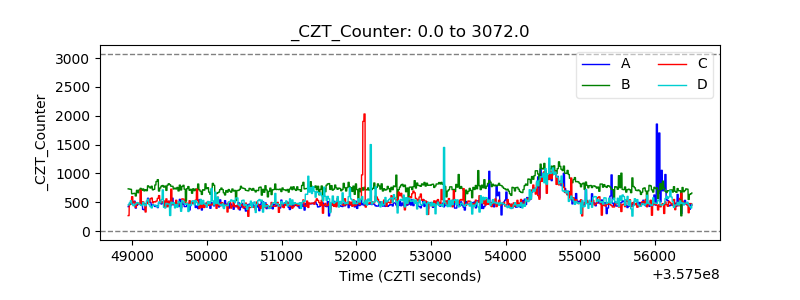 |
| +2.5 Volts monitor |  |
| +5 Volts monitor |  |
| _ROLL_ROT | 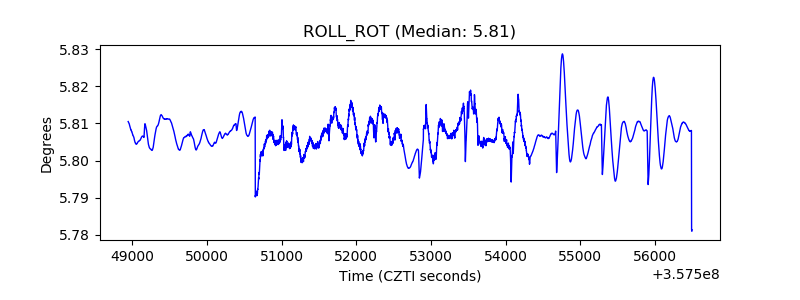 |
| _Roll_DEC | 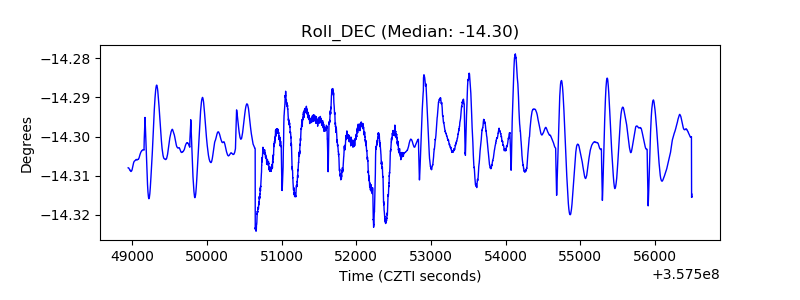 |
| _Roll_RA | 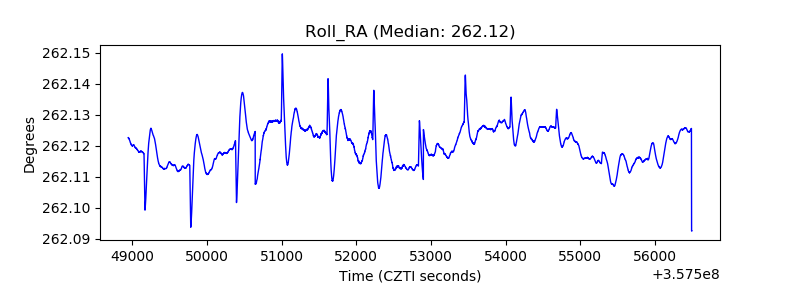 |
| Veto Counter | 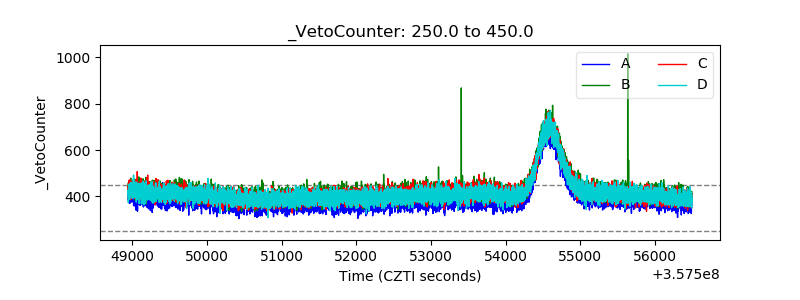 |