| Param | Original file | Final file |
|---|---|---|
| Filename | modeM0/AS1A10_007T01_9000004350_30229cztM0_level2.evt | modeM0/AS1A10_007T01_9000004350_30229cztM0_level2_quad_clean.evt |
| Size (bytes) | 632,108,160 | 85,455,360 |
| Size | 602.8 MB | 81.5 MB |
| Events in quadrant A | 3,969,472 | 519,707 |
| Events in quadrant B | 5,825,303 | 521,645 |
| Events in quadrant C | 4,072,330 | 511,011 |
| Events in quadrant D | 4,758,020 | 502,459 |
| Mode M9 | |||
|---|---|---|---|
| Quadrant | BADHDUFLAG | Total packets | Discarded packets |
| A | 0 | 1 | 0 |
| B | 0 | 1 | 0 |
| C | 0 | 1 | 0 |
| D | 0 | 1 | 0 |
| Mode SS | |||
|---|---|---|---|
| Quadrant | BADHDUFLAG | Total packets | Discarded packets |
| A | 0 | 156 | 0 |
| B | 0 | 156 | 0 |
| C | 0 | 156 | 0 |
| D | 0 | 156 | 0 |
| Mode M0 | |||
|---|---|---|---|
| Quadrant | BADHDUFLAG | Total packets | Discarded packets |
| A | 0 | 16655 | 1 |
| B | 0 | 23321 | 5 |
| C | 0 | 16756 | 1 |
| D | 0 | 18831 | 1 |
| Quadrant | Total seconds | Saturated seconds | Saturation percentage |
|---|---|---|---|
| A | 7653 | 220 | 2.874690% |
| B | 7652 | 274 | 3.580763% |
| C | 7652 | 264 | 3.450078% |
| D | 7653 | 310 | 4.050699% |
Noise dominated data is calculated using 1-second bins in cleaned event files. If a bin has >2000 counts, and if more than 50% of those come from <1% of pixels, then it is considered to be noise-dominated and hence unusable.
| Quadrant | # 1 sec bins | Bins with >0 counts | Bins with >2000 counts | High rate bins dominated by noise | Noise dominated (total time) | Noise dominated (detector-on time) | Marked lightcurve |
|---|---|---|---|---|---|---|---|
| A | 7743 | 7655 | 34 | 34 | 0.44% | 0.44% | 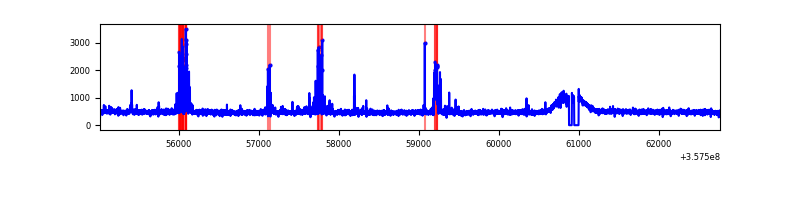 |
| B | 7742 | 7654 | 3 | 3 | 0.04% | 0.04% | 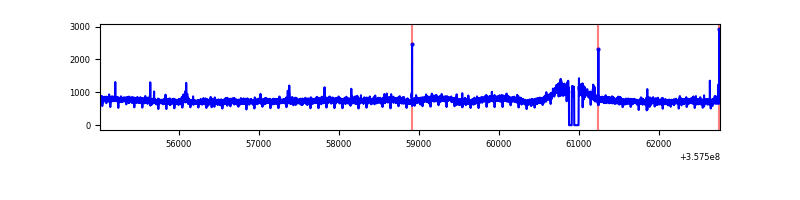 |
| C | 7742 | 7654 | 4 | 4 | 0.05% | 0.05% | 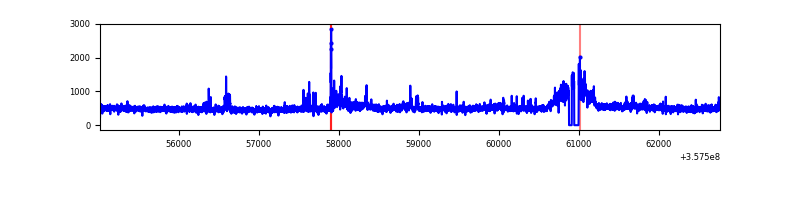 |
| D | 7743 | 7654 | 113 | 113 | 1.46% | 1.48% | 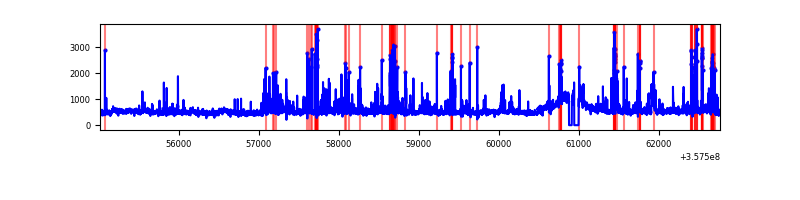 |
Top three noisy pixels from each quadrant. If the there are fewer than three noisy pixels in the level2.evt file, extra rows are filled as -1
| Pixel properties | Quadrant properties | ||||||
|---|---|---|---|---|---|---|---|
| Quadrant | DetID | PixID | Counts | Sigma | Mean | Median | Sigma |
| A | 14 | 239 | 270371 | 1385.89 | 957 | 936 | 194.4 |
| A | 13 | 254 | 14293 | 68.7 | 957 | 936 | 194.4 |
| A | 3 | 137 | 10143 | 47.36 | 957 | 936 | 194.4 |
| B | 6 | 159 | 2098456 | 11350.32 | 936 | 913 | 184.8 |
| B | 12 | 111 | 23180 | 120.49 | 936 | 913 | 184.8 |
| B | 11 | 111 | 21324 | 110.45 | 936 | 913 | 184.8 |
| C | 3 | 233 | 330999 | 1518.4 | 912 | 919 | 217.4 |
| C | 14 | 238 | 154053 | 704.43 | 912 | 919 | 217.4 |
| C | 2 | 114 | 17870 | 77.98 | 912 | 919 | 217.4 |
| D | 1 | 52 | 858414 | 3703.88 | 924 | 900 | 231.5 |
| D | 8 | 195 | 297196 | 1279.8 | 924 | 900 | 231.5 |
| D | 2 | 250 | 45179 | 191.25 | 924 | 900 | 231.5 |
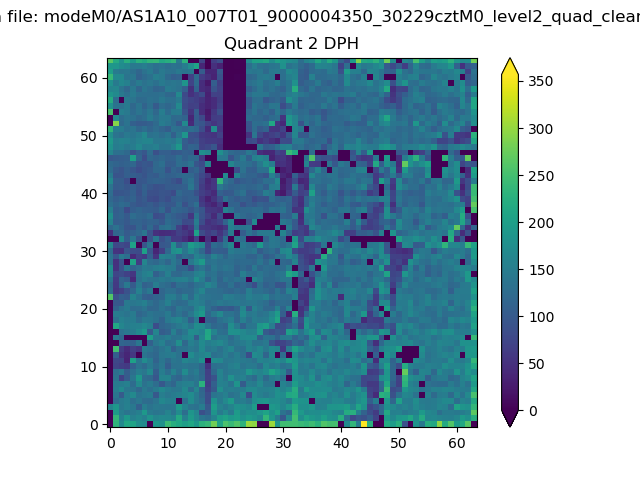
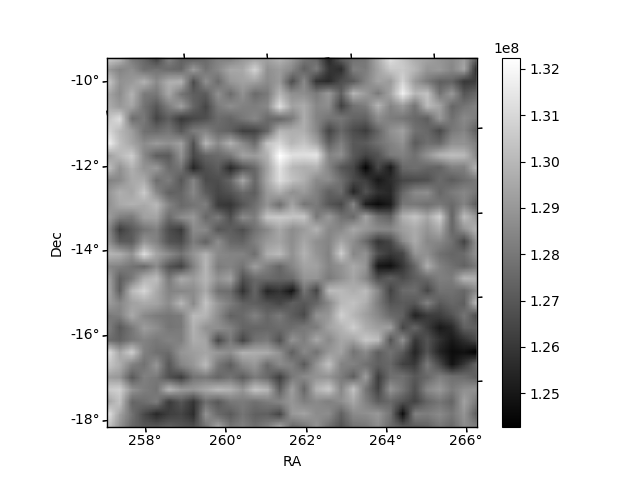
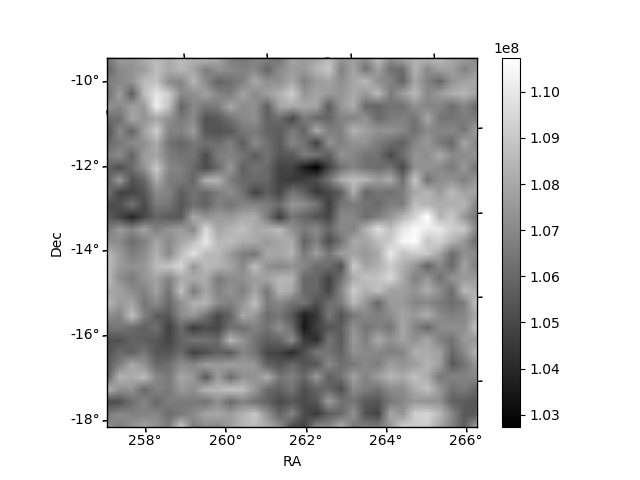
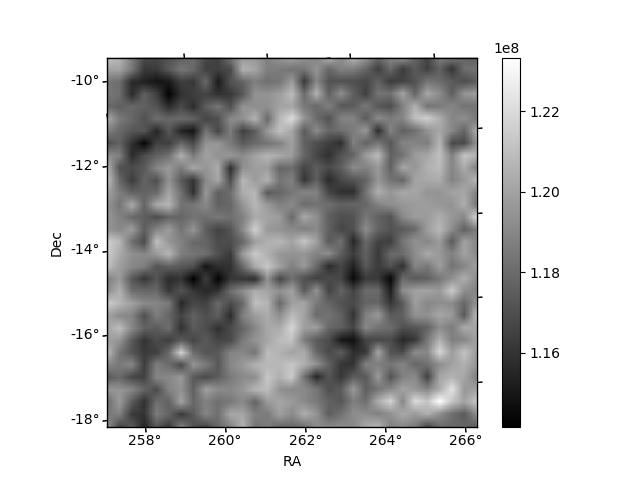
Histogram calculated using DETX and DETY for each event in the final _common_clean file
| Quadrant A | 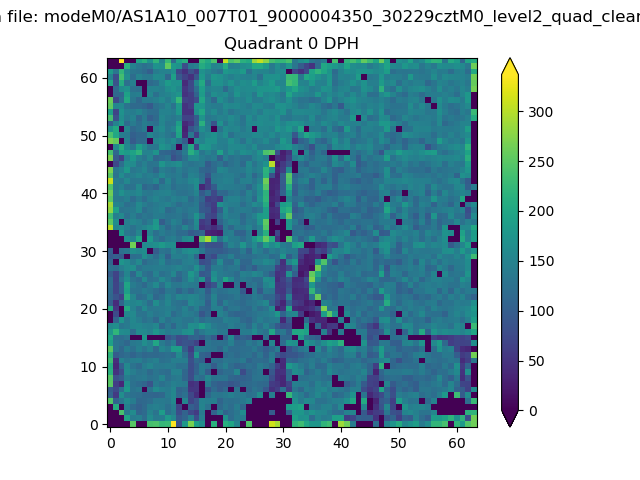 |
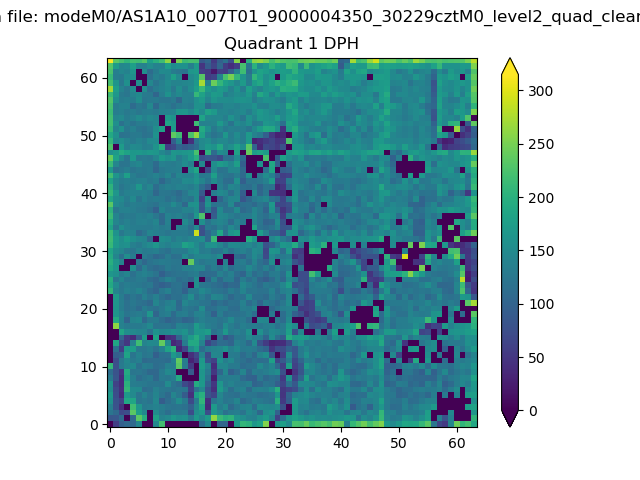 |
Quadrant B |
|---|---|---|---|
| Quadrant D | 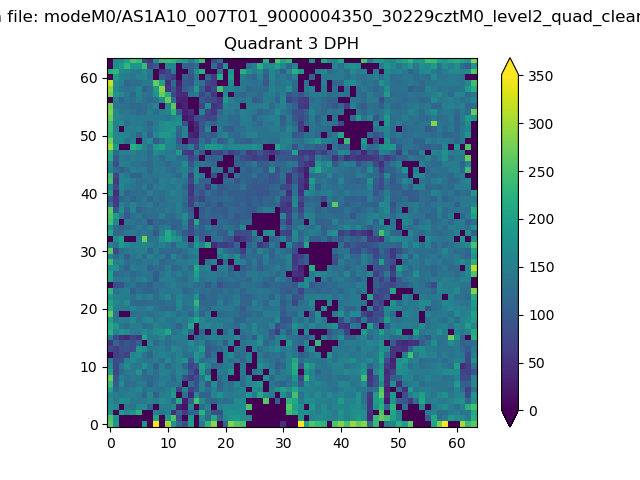 |
 |
Quadrant C |
| Plot type | Count rate plots | Images |
|---|---|---|
| Comparison with Poisson distribution Blue bars denote a histogram of data divided into 1 sec bins. Red curve is a Poisson curve with rate = median count rate of data. |
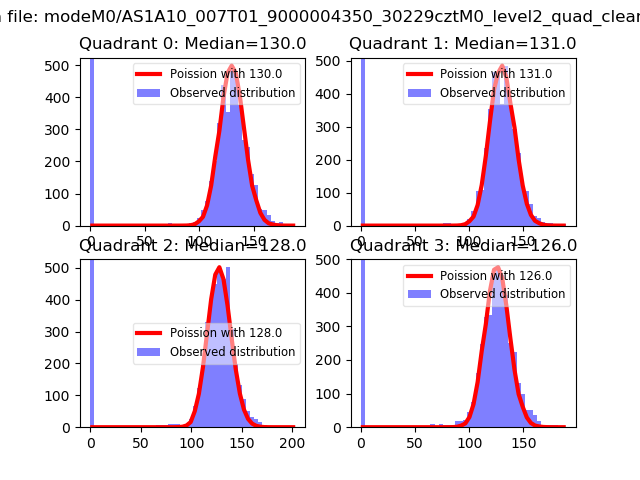 |
 |
| Quadrant-wise count rates Data is divided into 100 sec bins |
 |
|
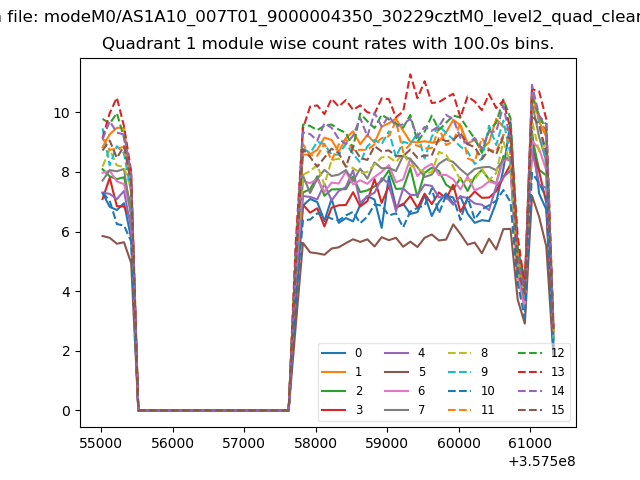
| Module-wise count rates for Quadrant A Data is divided into 100 sec bins |
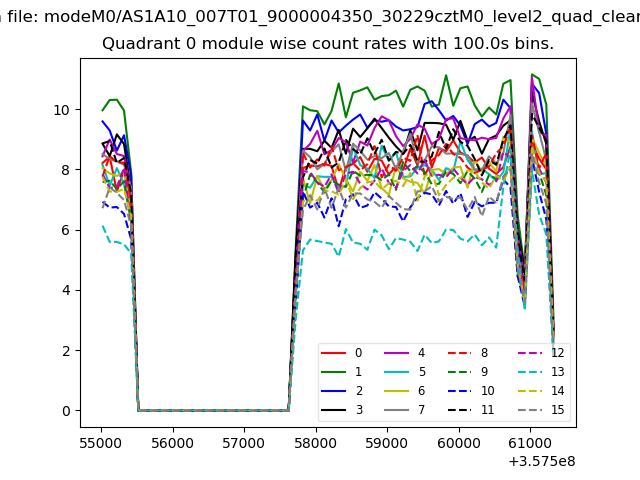 |
 |
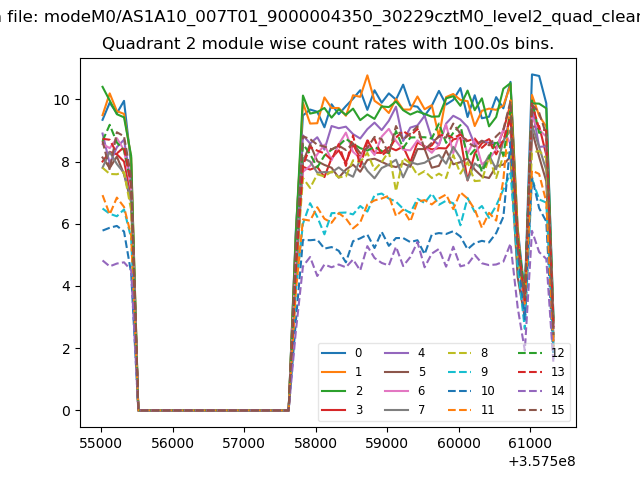
| Module-wise count rates for Quadrant B Data is divided into 100 sec bins |
 |
 |
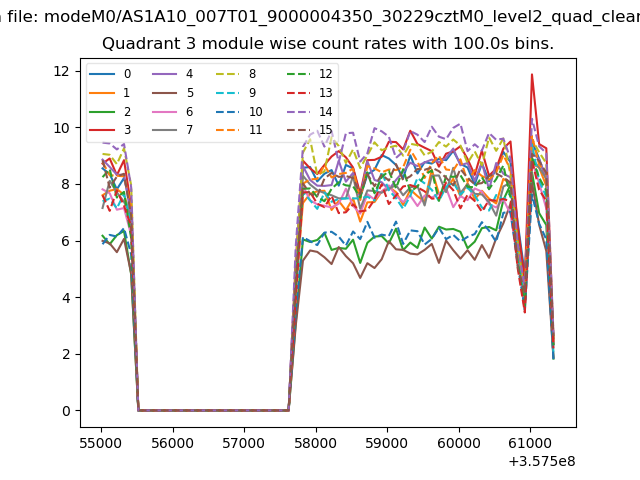
| Module-wise count rates for Quadrant C Data is divided into 100 sec bins |
 |
 |
| Module-wise count rates for Quadrant D Data is divided into 100 sec bins |
 |
 |
| Parameter | Plot |
|---|---|
| CZT HV Monitor | 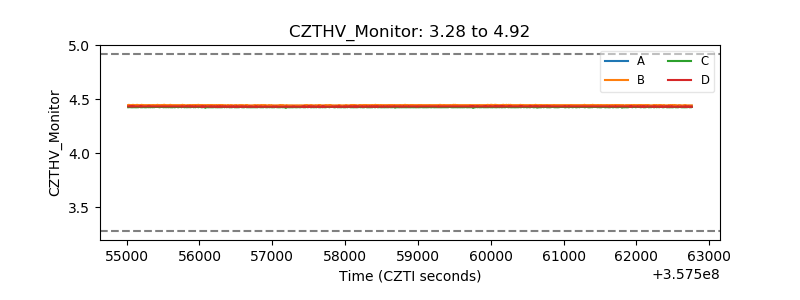 |
| D_VDD | 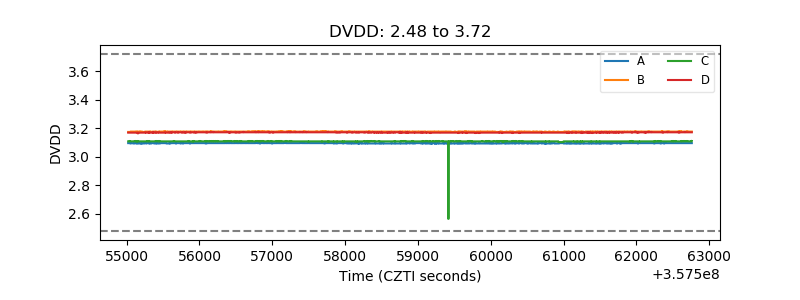 |
| Temperature 1 | 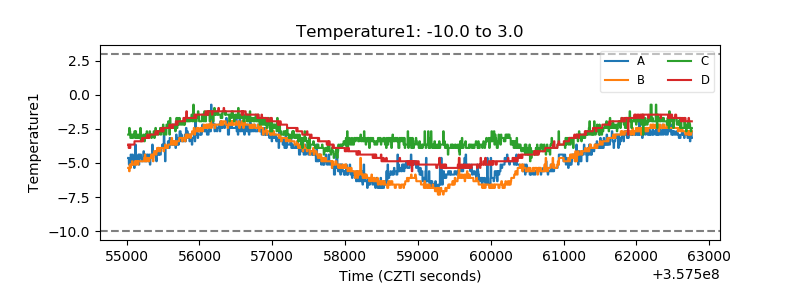 |
| Veto HV Monitor | 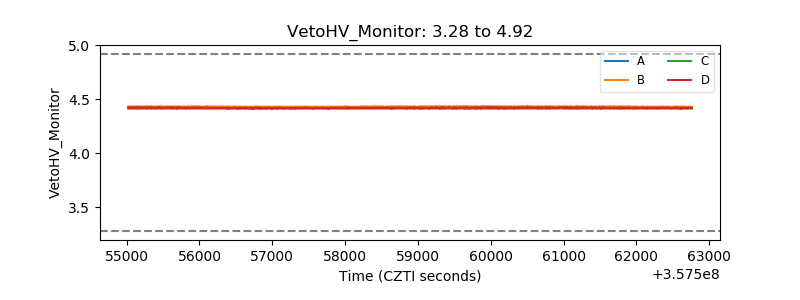 |
| Veto LLD | 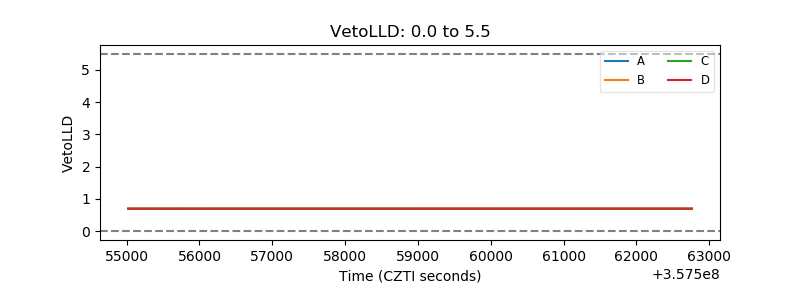 |
| Alpha Counter | 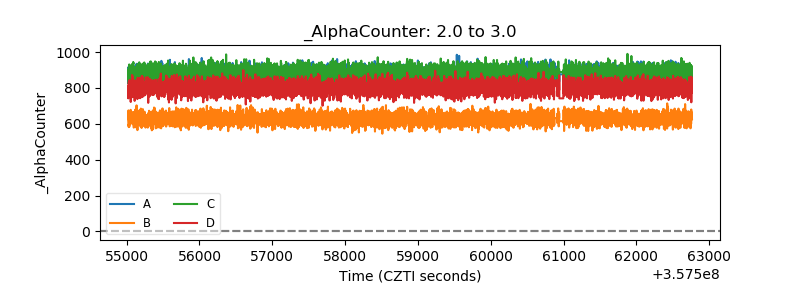 |
| _CPM_Rate |  |
| CZT Counter | 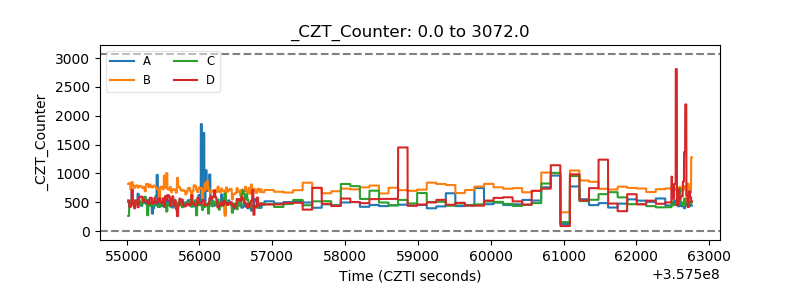 |
| +2.5 Volts monitor |  |
| +5 Volts monitor |  |
| _ROLL_ROT | 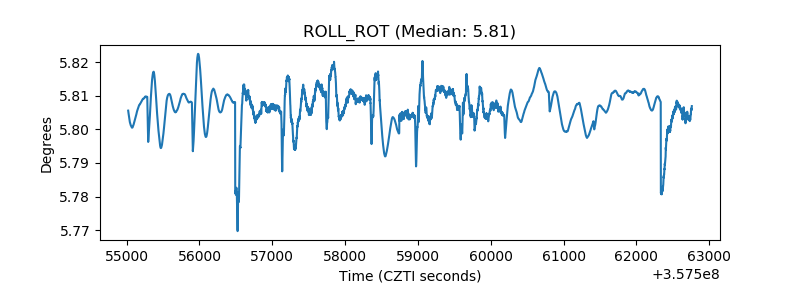 |
| _Roll_DEC | 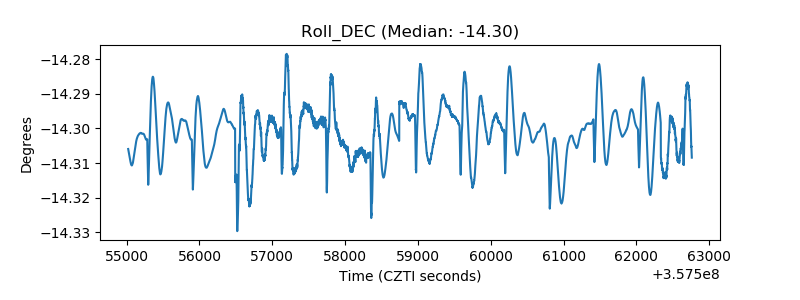 |
| _Roll_RA | 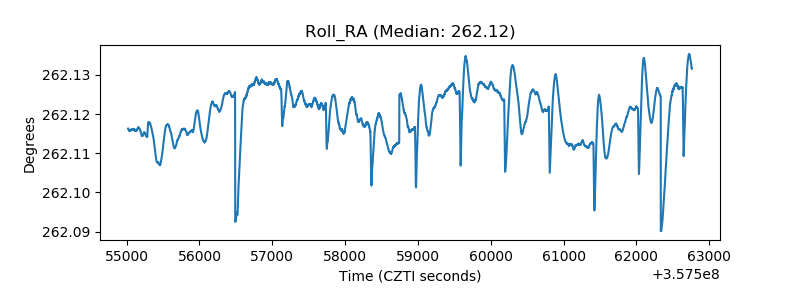 |
| Veto Counter | 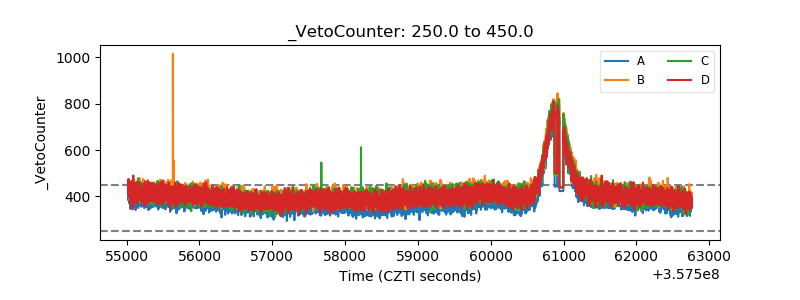 |