| Param | Original file | Final file |
|---|---|---|
| Filename | modeM0/AS1A10_007T01_9000004350_30233cztM0_level2.evt | modeM0/AS1A10_007T01_9000004350_30233cztM0_level2_quad_clean.evt |
| Size (bytes) | 592,246,080 | 91,618,560 |
| Size | 564.8 MB | 87.4 MB |
| Events in quadrant A | 3,734,335 | 571,438 |
| Events in quadrant B | 5,633,897 | 577,007 |
| Events in quadrant C | 3,632,097 | 566,801 |
| Events in quadrant D | 4,444,432 | 554,087 |
| Mode M9 | |||
|---|---|---|---|
| Quadrant | BADHDUFLAG | Total packets | Discarded packets |
| A | 0 | 17 | 0 |
| B | 0 | 17 | 0 |
| C | 0 | 17 | 0 |
| D | 0 | 17 | 0 |
| Mode SS | |||
|---|---|---|---|
| Quadrant | BADHDUFLAG | Total packets | Discarded packets |
| A | 0 | 150 | 0 |
| B | 0 | 150 | 0 |
| C | 0 | 150 | 0 |
| D | 0 | 150 | 0 |
| Mode M0 | |||
|---|---|---|---|
| Quadrant | BADHDUFLAG | Total packets | Discarded packets |
| A | 0 | 15545 | 2 |
| B | 0 | 21910 | 2 |
| C | 0 | 15199 | 3 |
| D | 0 | 17783 | 2 |
| Quadrant | Total seconds | Saturated seconds | Saturation percentage |
|---|---|---|---|
| A | 7254 | 103 | 1.419906% |
| B | 7255 | 141 | 1.943487% |
| C | 7254 | 119 | 1.640474% |
| D | 7254 | 202 | 2.784671% |
Noise dominated data is calculated using 1-second bins in cleaned event files. If a bin has >2000 counts, and if more than 50% of those come from <1% of pixels, then it is considered to be noise-dominated and hence unusable.
| Quadrant | # 1 sec bins | Bins with >0 counts | Bins with >2000 counts | High rate bins dominated by noise | Noise dominated (total time) | Noise dominated (detector-on time) | Marked lightcurve |
|---|---|---|---|---|---|---|---|
| A | 9004 | 7254 | 9 | 9 | 0.10% | 0.12% | 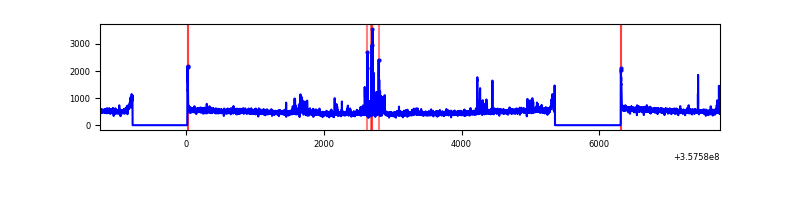 |
| B | 9005 | 7257 | 1 | 1 | 0.01% | 0.01% | 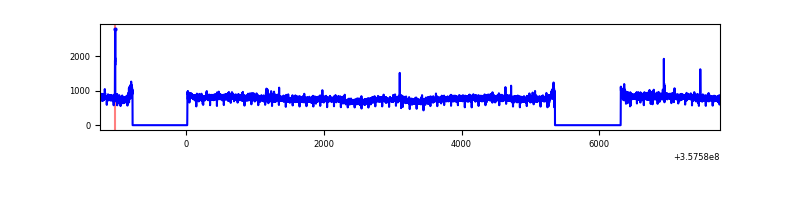 |
| C | 9004 | 7256 | 0 | 0 | 0.00% | 0.00% | 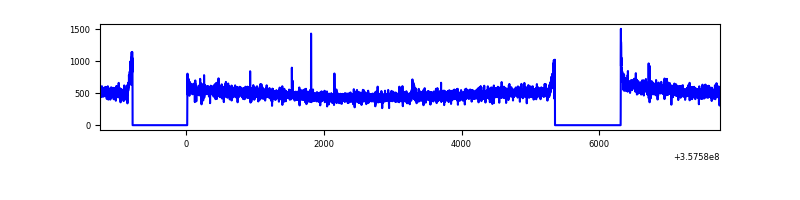 |
| D | 9004 | 7256 | 123 | 123 | 1.37% | 1.70% | 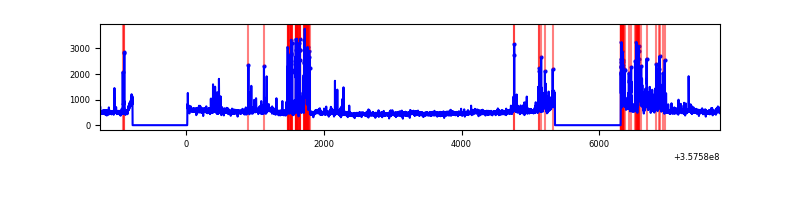 |
Top three noisy pixels from each quadrant. If the there are fewer than three noisy pixels in the level2.evt file, extra rows are filled as -1
| Pixel properties | Quadrant properties | ||||||
|---|---|---|---|---|---|---|---|
| Quadrant | DetID | PixID | Counts | Sigma | Mean | Median | Sigma |
| A | 14 | 239 | 197956 | 1077.88 | 907 | 889 | 182.8 |
| A | 8 | 192 | 27455 | 145.3 | 907 | 889 | 182.8 |
| A | 13 | 254 | 13765 | 70.42 | 907 | 889 | 182.8 |
| B | 6 | 159 | 2051255 | 11838.64 | 902 | 878 | 173.2 |
| B | 12 | 111 | 21895 | 121.35 | 902 | 878 | 173.2 |
| B | 11 | 111 | 20004 | 110.43 | 902 | 878 | 173.2 |
| C | 14 | 238 | 144441 | 688.86 | 881 | 889 | 208.4 |
| C | 3 | 233 | 29820 | 138.83 | 881 | 889 | 208.4 |
| C | 2 | 114 | 17260 | 78.56 | 881 | 889 | 208.4 |
| D | 12 | 233 | 642545 | 2901.59 | 877 | 856 | 221.2 |
| D | 8 | 195 | 290753 | 1310.85 | 877 | 856 | 221.2 |
| D | 13 | 104 | 81503 | 364.67 | 877 | 856 | 221.2 |
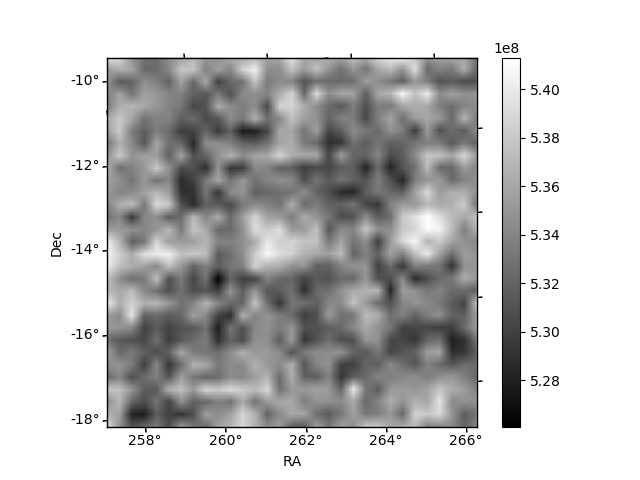
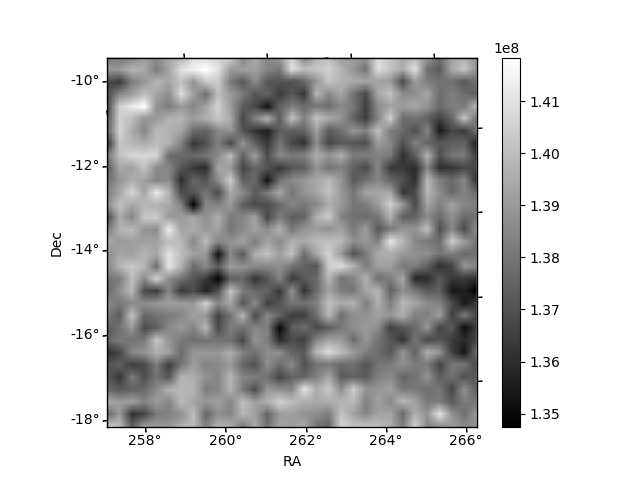
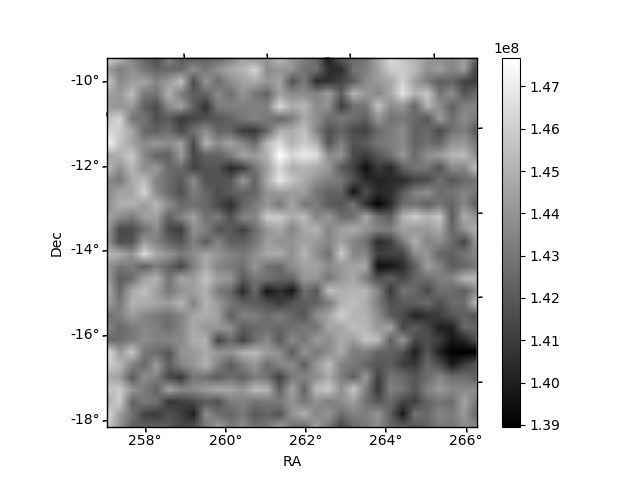
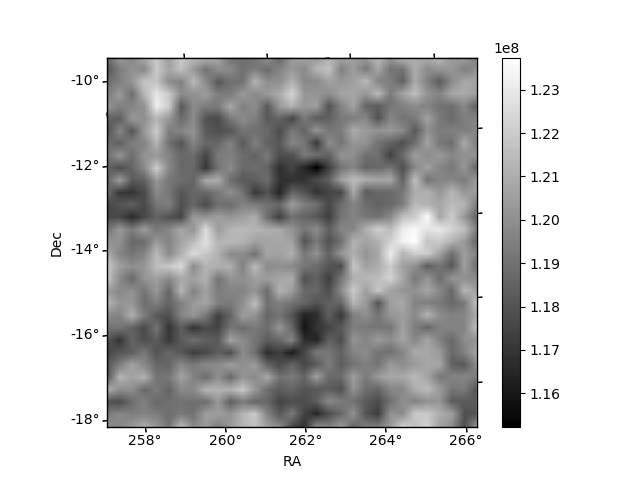
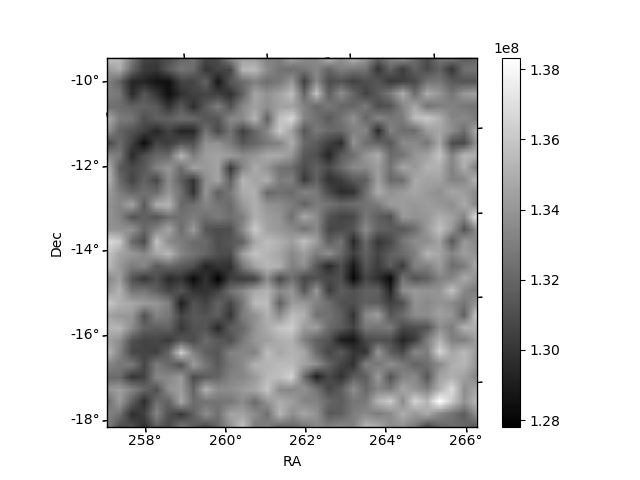
Histogram calculated using DETX and DETY for each event in the final _common_clean file
| Quadrant A | 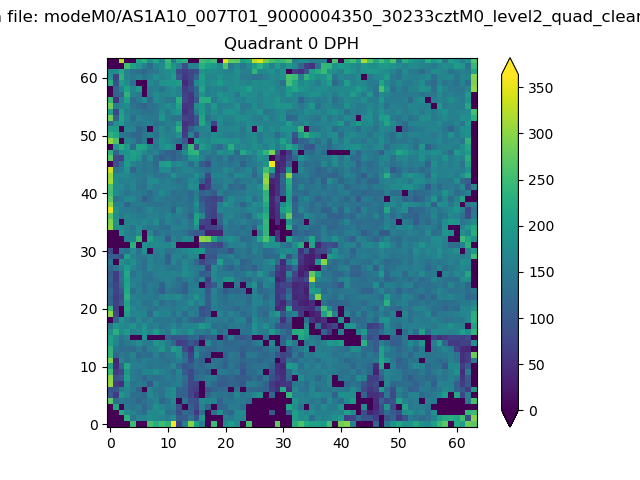 |
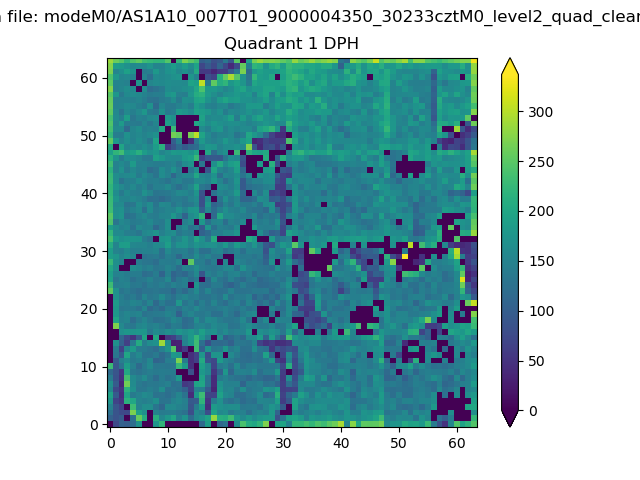 |
Quadrant B |
|---|---|---|---|
| Quadrant D | 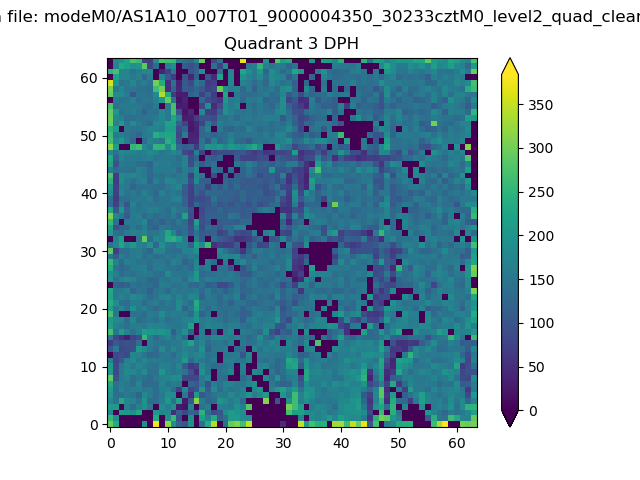 |
 |
Quadrant C |
| Plot type | Count rate plots | Images |
|---|---|---|
| Comparison with Poisson distribution Blue bars denote a histogram of data divided into 1 sec bins. Red curve is a Poisson curve with rate = median count rate of data. |
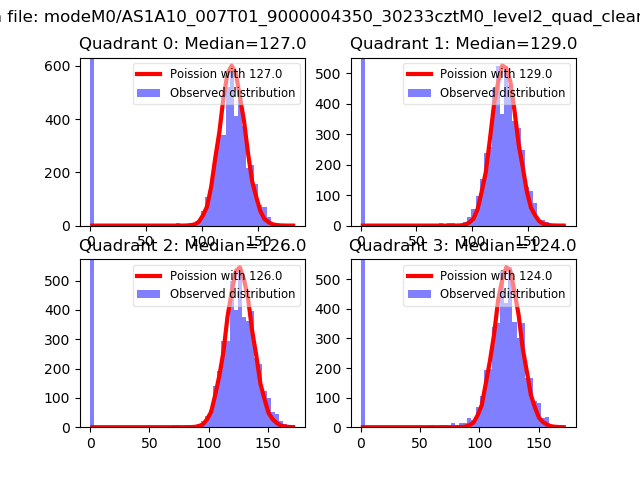 |
 |
| Quadrant-wise count rates Data is divided into 100 sec bins |
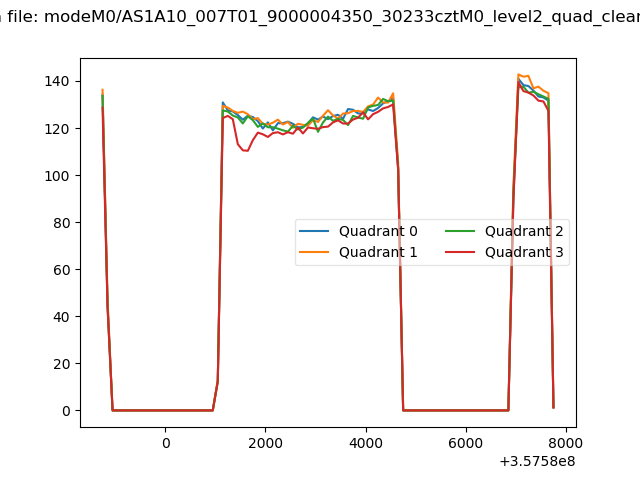 |
|
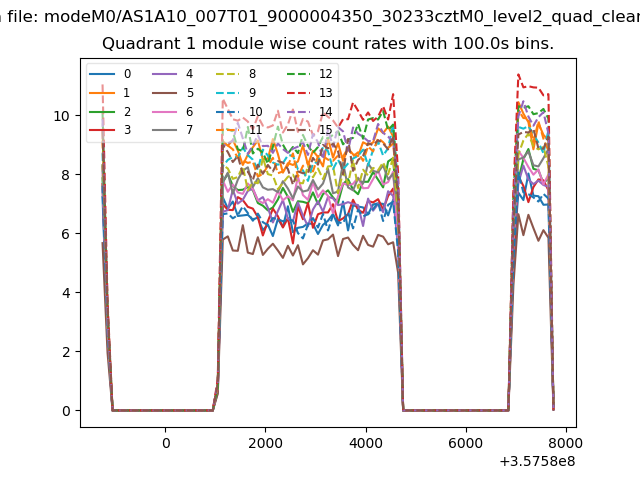
| Module-wise count rates for Quadrant A Data is divided into 100 sec bins |
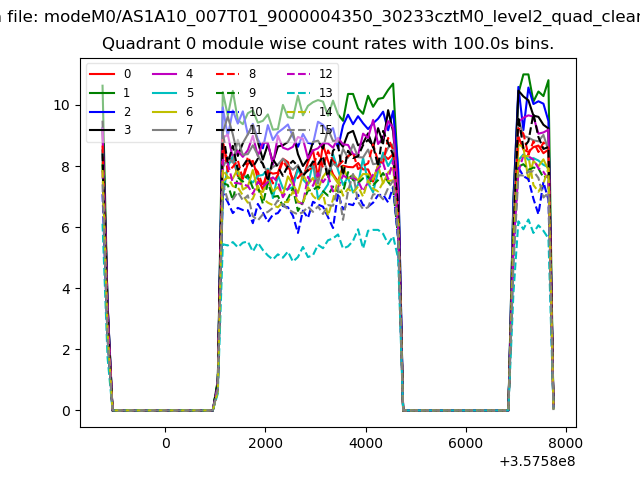 |
 |
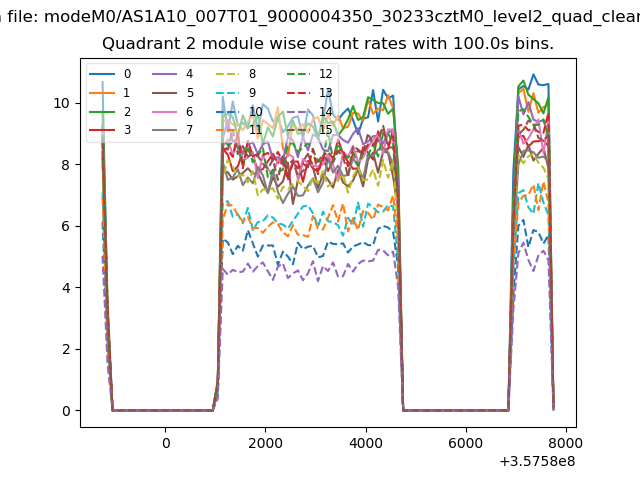
| Module-wise count rates for Quadrant B Data is divided into 100 sec bins |
 |
 |
| Module-wise count rates for Quadrant C Data is divided into 100 sec bins |
 |
 |
| Module-wise count rates for Quadrant D Data is divided into 100 sec bins |
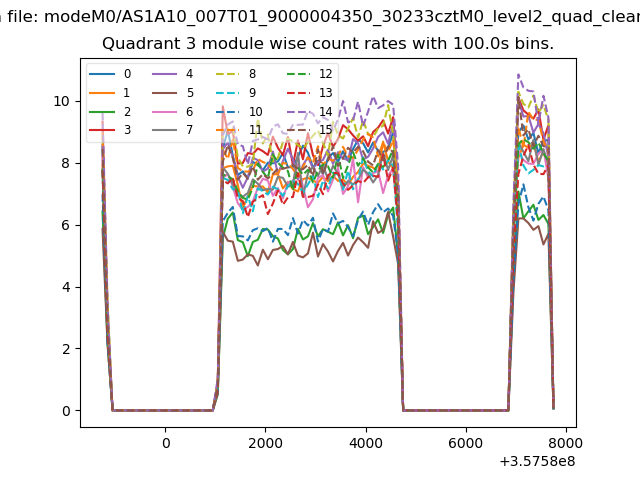 |
 |
| Parameter | Plot |
|---|---|
| CZT HV Monitor | 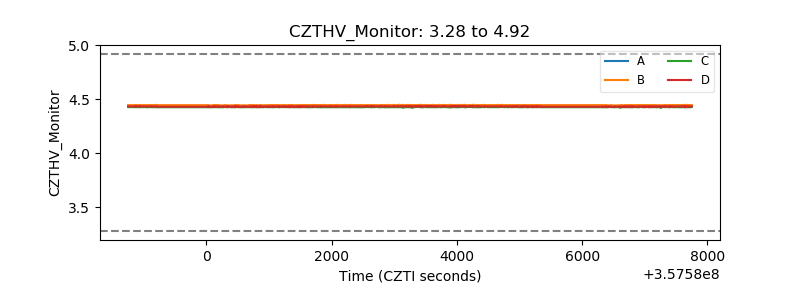 |
| D_VDD | 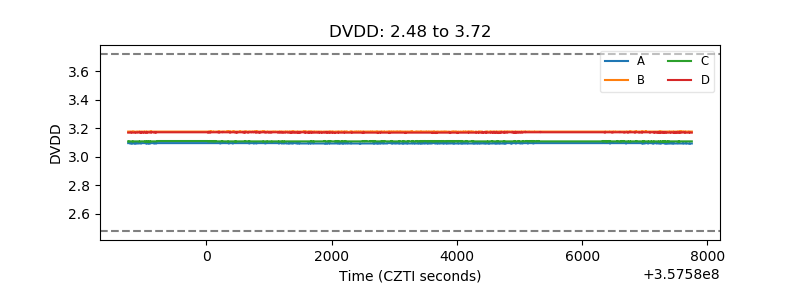 |
| Temperature 1 | 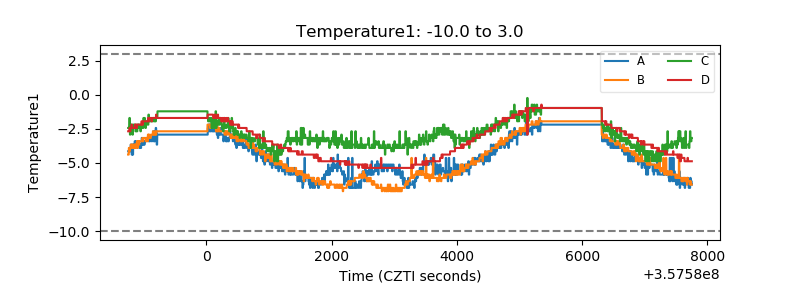 |
| Veto HV Monitor | 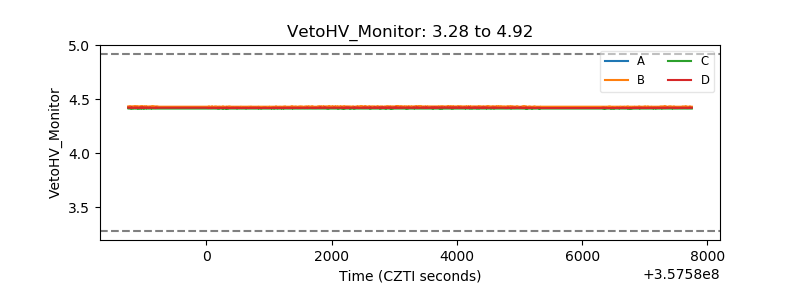 |
| Veto LLD | 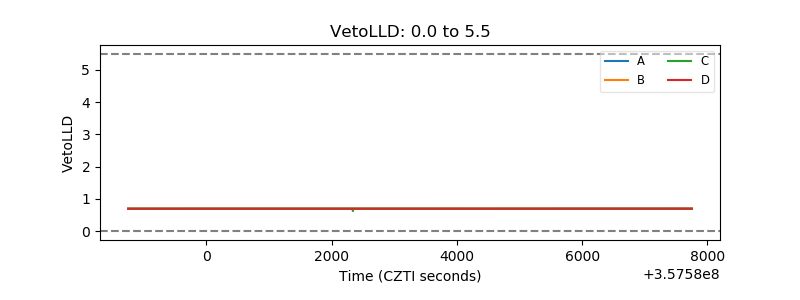 |
| Alpha Counter | 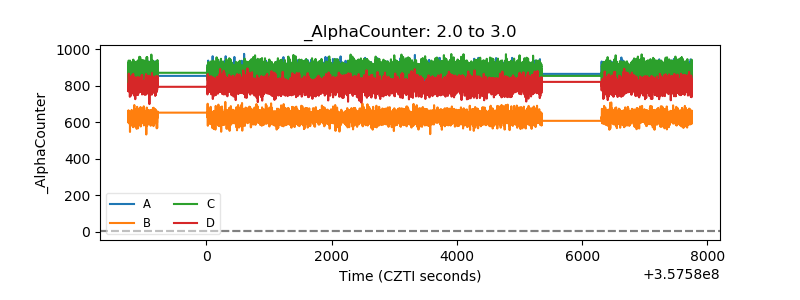 |
| _CPM_Rate | 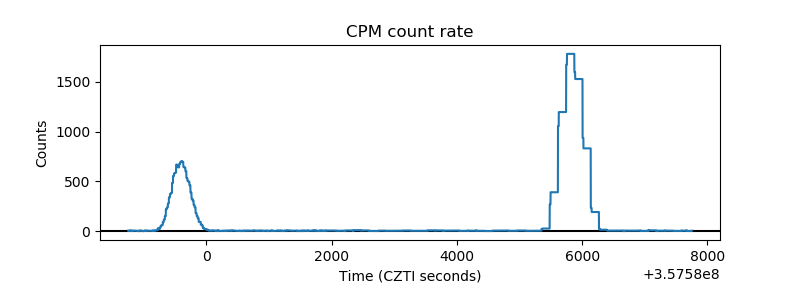 |
| CZT Counter | 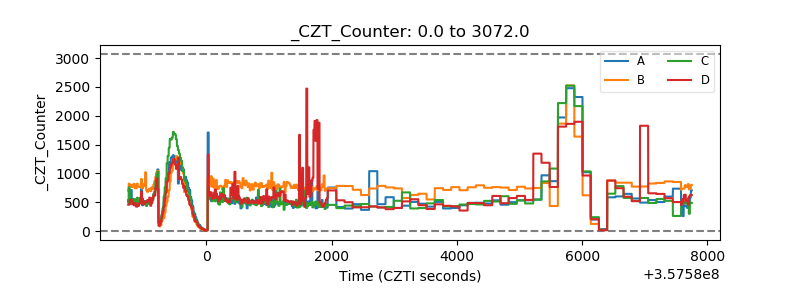 |
| +2.5 Volts monitor |  |
| +5 Volts monitor |  |
| _ROLL_ROT | 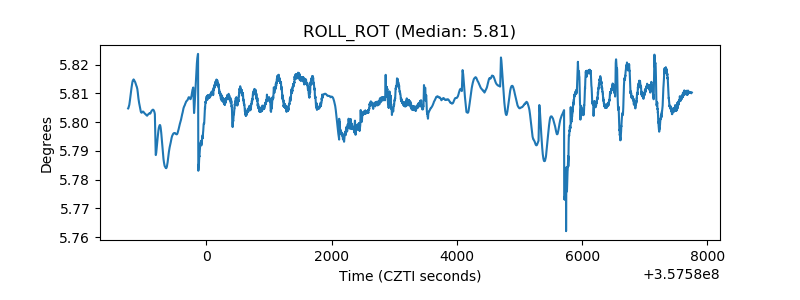 |
| _Roll_DEC | 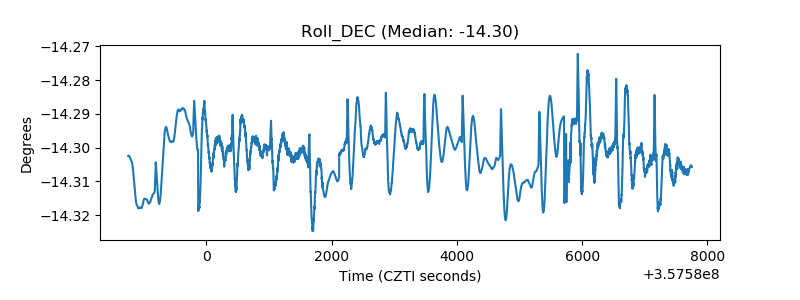 |
| _Roll_RA | 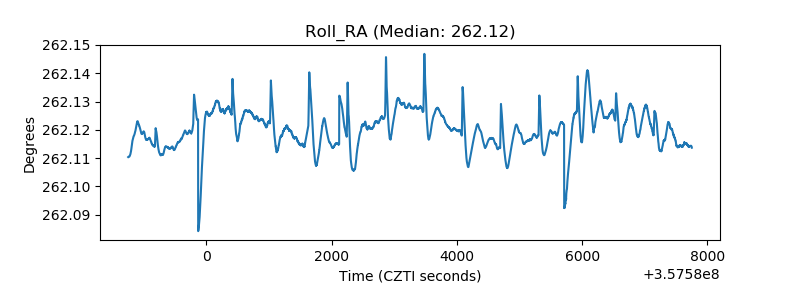 |
| Veto Counter | 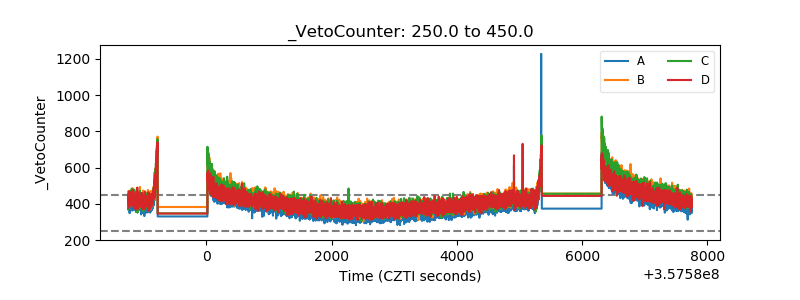 |