| Param | Original file | Final file |
|---|---|---|
| Filename | modeM0/AS1A10_007T01_9000004350_30235cztM0_level2.evt | modeM0/AS1A10_007T01_9000004350_30235cztM0_level2_quad_clean.evt |
| Size (bytes) | 545,549,760 | 98,412,480 |
| Size | 520.3 MB | 93.9 MB |
| Events in quadrant A | 3,619,283 | 629,845 |
| Events in quadrant B | 5,222,902 | 645,363 |
| Events in quadrant C | 3,392,739 | 632,437 |
| Events in quadrant D | 3,842,760 | 615,613 |
| Mode M9 | |||
|---|---|---|---|
| Quadrant | BADHDUFLAG | Total packets | Discarded packets |
| A | 0 | 20 | 0 |
| B | 0 | 20 | 0 |
| C | 0 | 20 | 0 |
| D | 0 | 20 | 0 |
| Mode SS | |||
|---|---|---|---|
| Quadrant | BADHDUFLAG | Total packets | Discarded packets |
| A | 0 | 138 | 0 |
| B | 0 | 138 | 0 |
| C | 0 | 138 | 0 |
| D | 0 | 138 | 0 |
| Mode M0 | |||
|---|---|---|---|
| Quadrant | BADHDUFLAG | Total packets | Discarded packets |
| A | 0 | 14853 | 2 |
| B | 0 | 19946 | 2 |
| C | 0 | 14088 | 2 |
| D | 0 | 15602 | 2 |
| Quadrant | Total seconds | Saturated seconds | Saturation percentage |
|---|---|---|---|
| A | 6546 | 117 | 1.787351% |
| B | 6547 | 118 | 1.802352% |
| C | 6547 | 121 | 1.848175% |
| D | 6547 | 146 | 2.230029% |
Noise dominated data is calculated using 1-second bins in cleaned event files. If a bin has >2000 counts, and if more than 50% of those come from <1% of pixels, then it is considered to be noise-dominated and hence unusable.
| Quadrant | # 1 sec bins | Bins with >0 counts | Bins with >2000 counts | High rate bins dominated by noise | Noise dominated (total time) | Noise dominated (detector-on time) | Marked lightcurve |
|---|---|---|---|---|---|---|---|
| A | 8616 | 6546 | 48 | 48 | 0.56% | 0.73% | 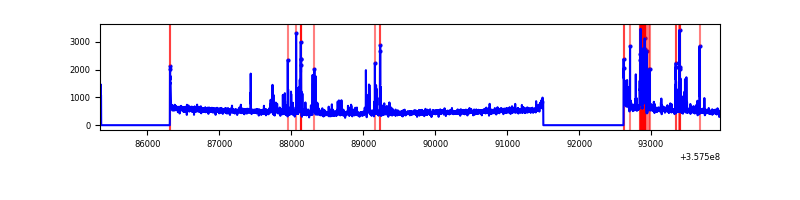 |
| B | 8617 | 6548 | 0 | 0 | 0.00% | 0.00% | 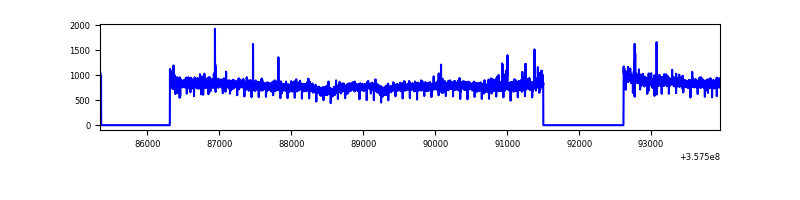 |
| C | 8617 | 6549 | 0 | 0 | 0.00% | 0.00% | 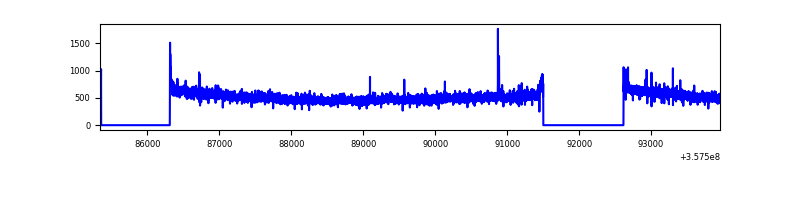 |
| D | 8617 | 6548 | 85 | 85 | 0.99% | 1.30% | 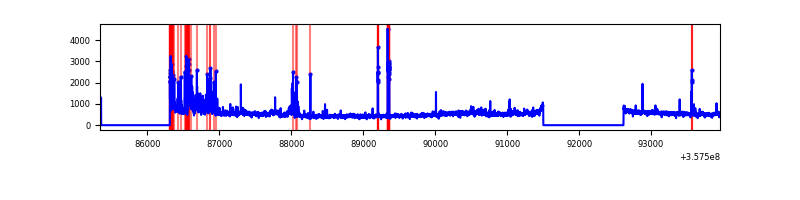 |
Top three noisy pixels from each quadrant. If the there are fewer than three noisy pixels in the level2.evt file, extra rows are filled as -1
| Pixel properties | Quadrant properties | ||||||
|---|---|---|---|---|---|---|---|
| Quadrant | DetID | PixID | Counts | Sigma | Mean | Median | Sigma |
| A | 14 | 239 | 291157 | 1742.78 | 827 | 810 | 166.6 |
| A | 0 | 13 | 99530 | 592.56 | 827 | 810 | 166.6 |
| A | 8 | 192 | 25769 | 149.81 | 827 | 810 | 166.6 |
| B | 6 | 159 | 1929933 | 12072.57 | 831 | 808 | 159.8 |
| B | 0 | 190 | 22419 | 135.24 | 831 | 808 | 159.8 |
| B | 12 | 111 | 19761 | 118.61 | 831 | 808 | 159.8 |
| C | 14 | 238 | 134774 | 698.63 | 812 | 820 | 191.7 |
| C | 3 | 233 | 64679 | 333.05 | 812 | 820 | 191.7 |
| C | 2 | 114 | 15198 | 74.99 | 812 | 820 | 191.7 |
| D | 12 | 233 | 292141 | 1425.49 | 803 | 784 | 204.4 |
| D | 8 | 195 | 234403 | 1143.0 | 803 | 784 | 204.4 |
| D | 7 | 64 | 73464 | 355.59 | 803 | 784 | 204.4 |
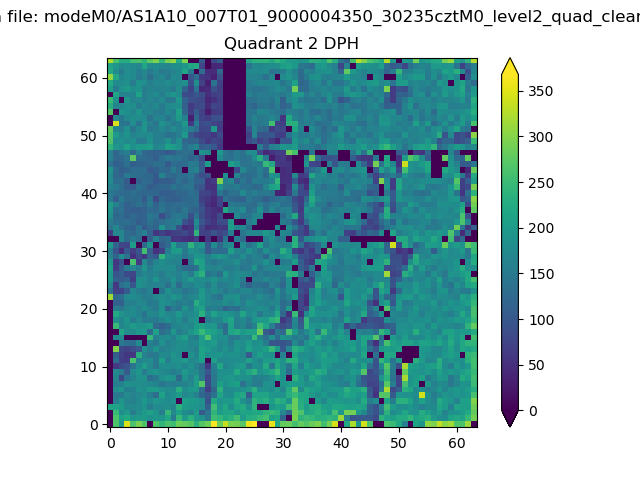
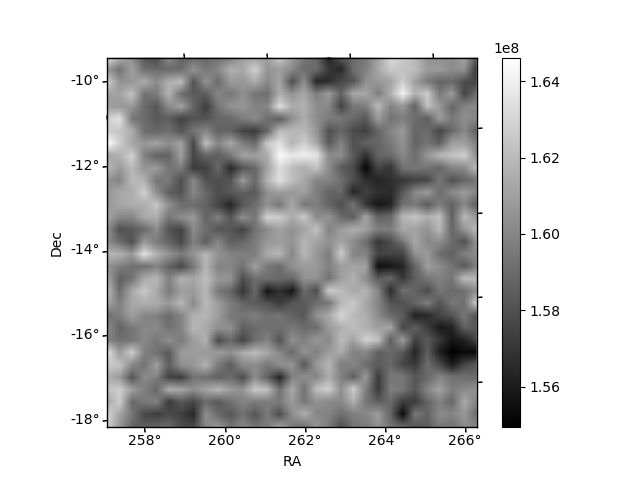
Histogram calculated using DETX and DETY for each event in the final _common_clean file
| Quadrant A | 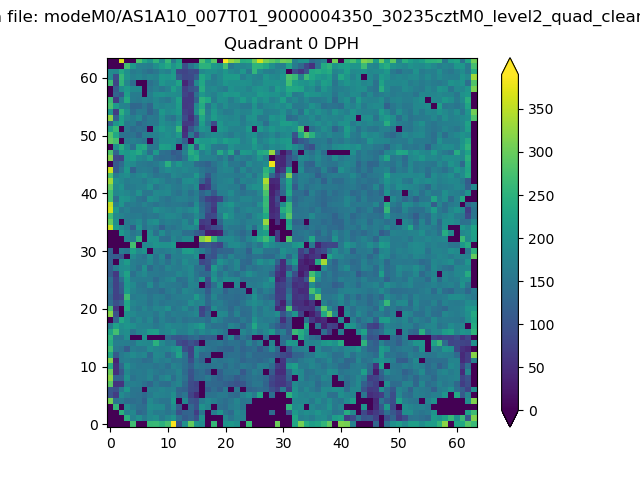 |
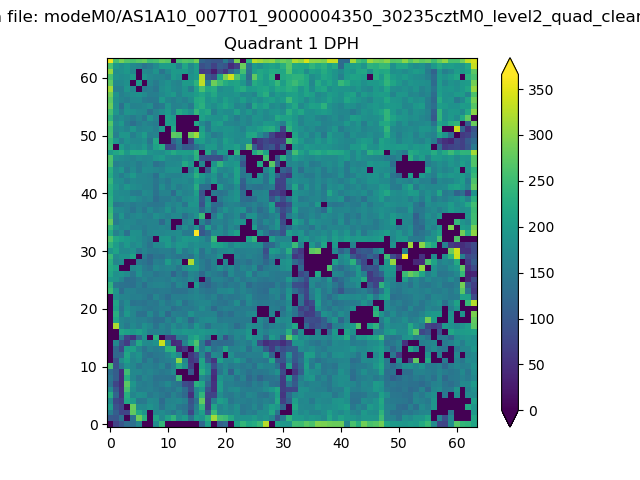 |
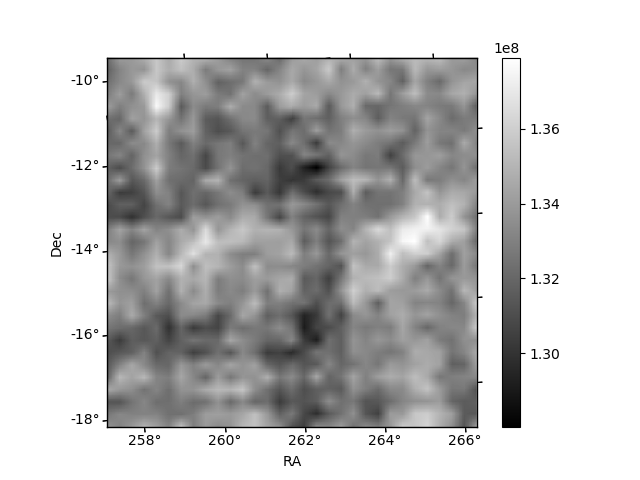
Quadrant B |
|---|---|---|---|
| Quadrant D | 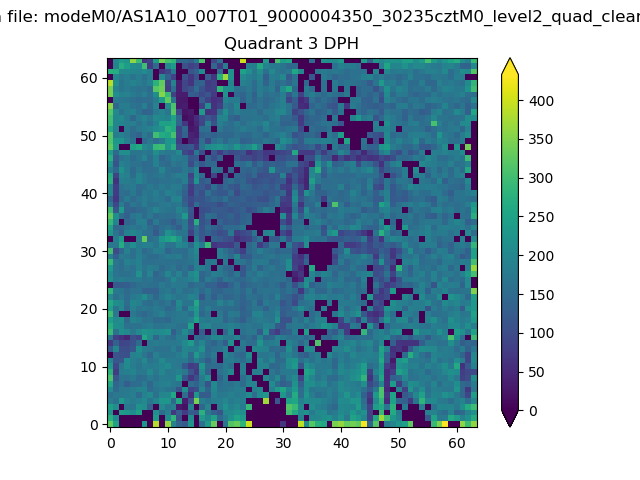 |
 |
Quadrant C |
| Plot type | Count rate plots | Images |
|---|---|---|
| Comparison with Poisson distribution Blue bars denote a histogram of data divided into 1 sec bins. Red curve is a Poisson curve with rate = median count rate of data. |
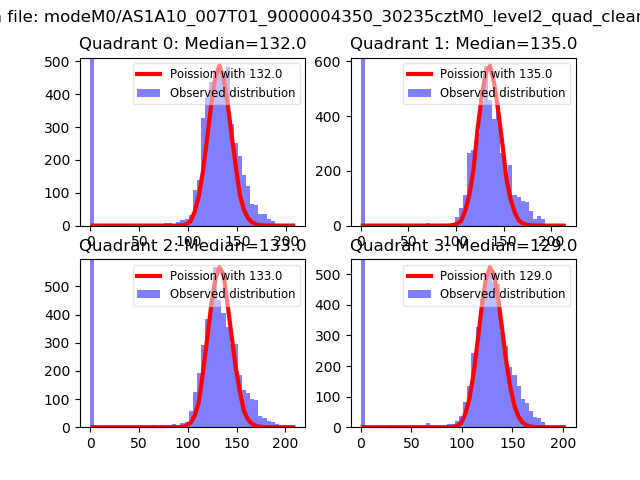 |
 |
| Quadrant-wise count rates Data is divided into 100 sec bins |
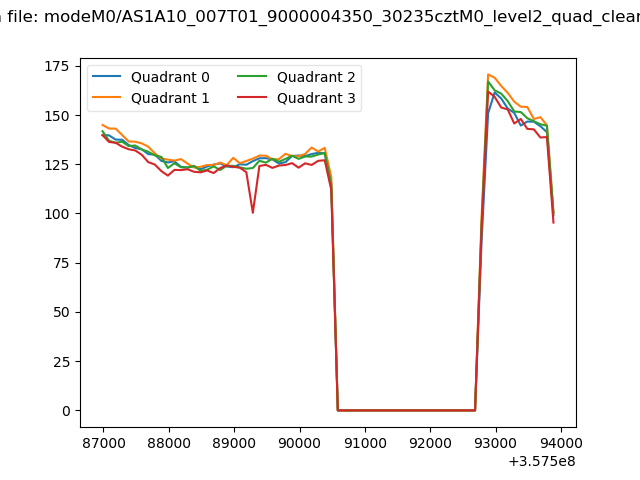 |
|
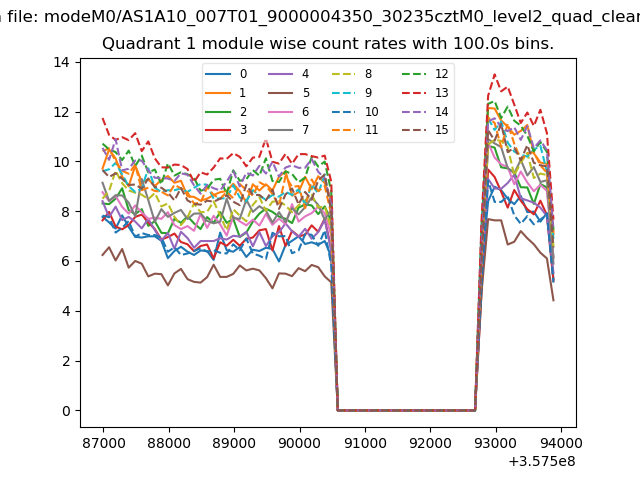
| Module-wise count rates for Quadrant A Data is divided into 100 sec bins |
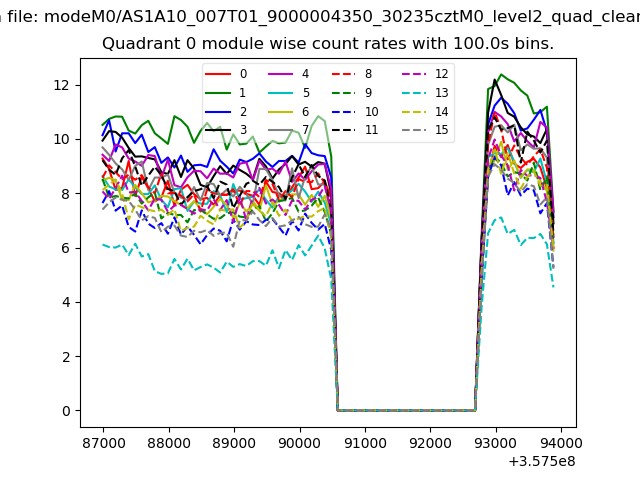 |
 |
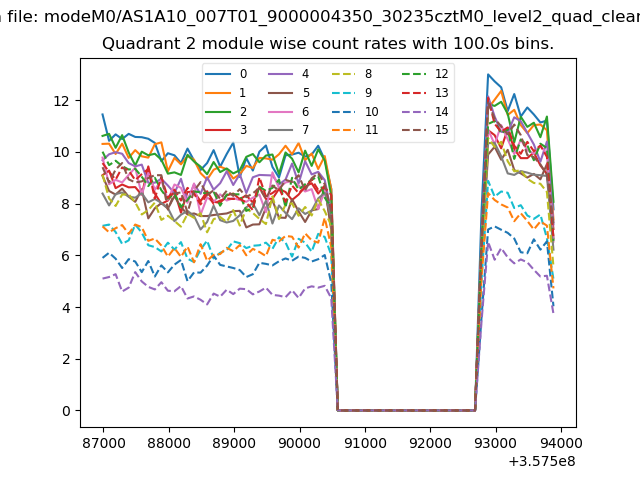
| Module-wise count rates for Quadrant B Data is divided into 100 sec bins |
 |
 |
| Module-wise count rates for Quadrant C Data is divided into 100 sec bins |
 |
 |
| Module-wise count rates for Quadrant D Data is divided into 100 sec bins |
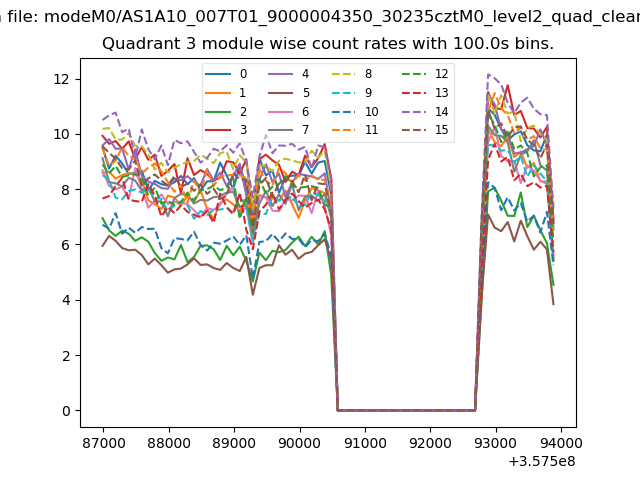 |
 |
| Parameter | Plot |
|---|---|
| CZT HV Monitor | 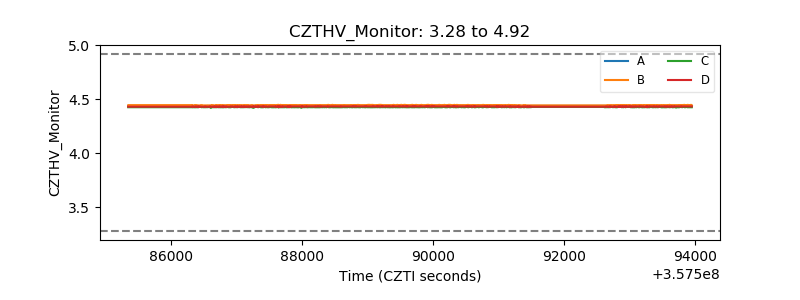 |
| D_VDD | 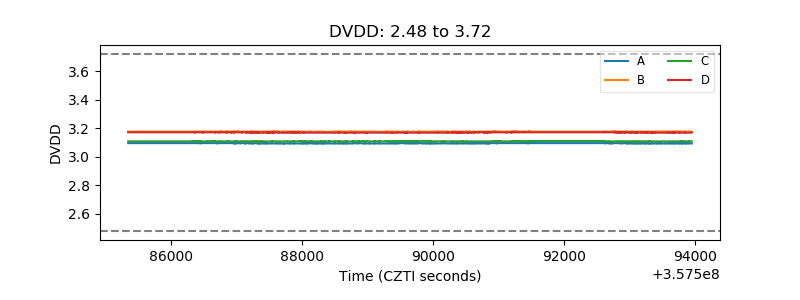 |
| Temperature 1 | 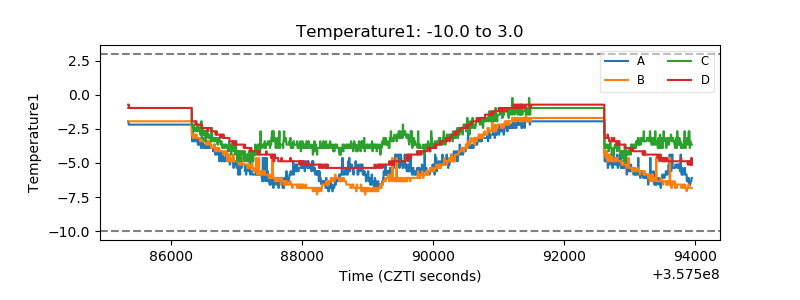 |
| Veto HV Monitor | 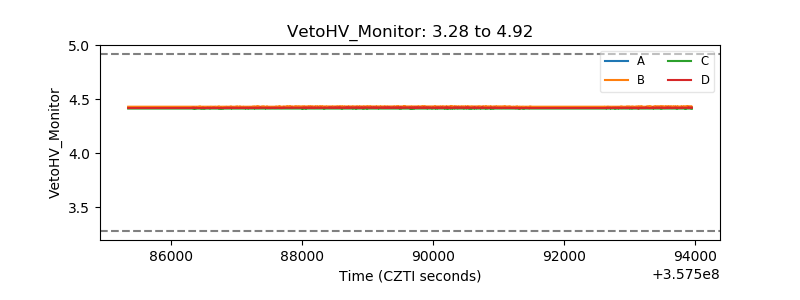 |
| Veto LLD | 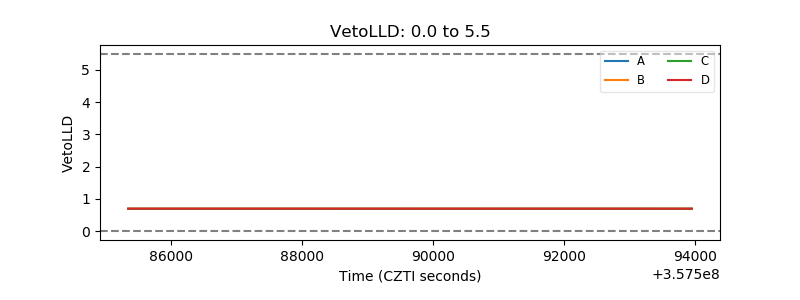 |
| Alpha Counter | 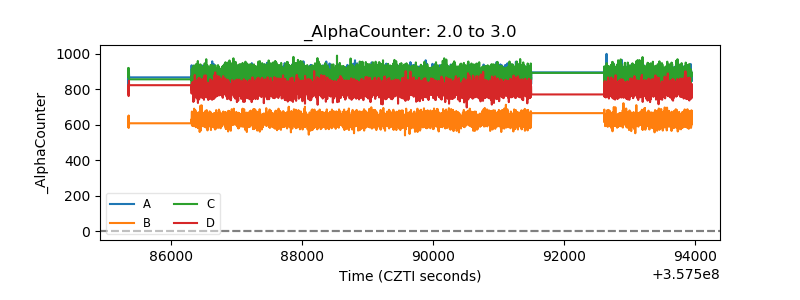 |
| _CPM_Rate | 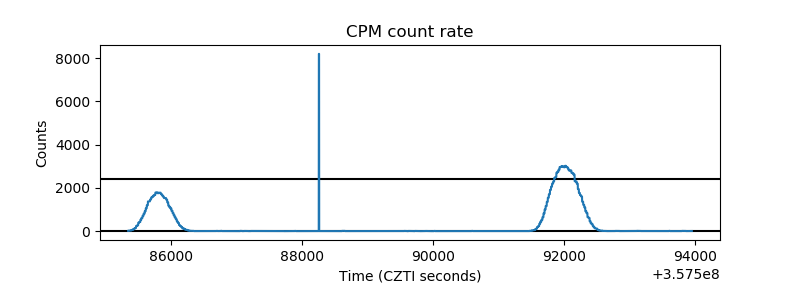 |
| CZT Counter | 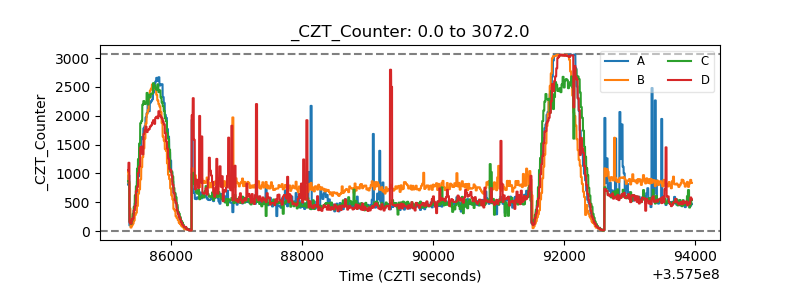 |
| +2.5 Volts monitor |  |
| +5 Volts monitor |  |
| _ROLL_ROT | 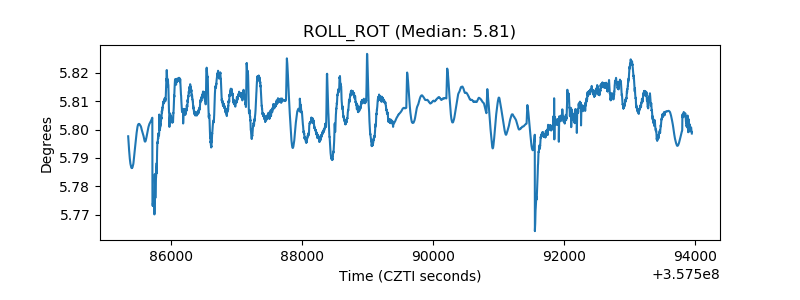 |
| _Roll_DEC | 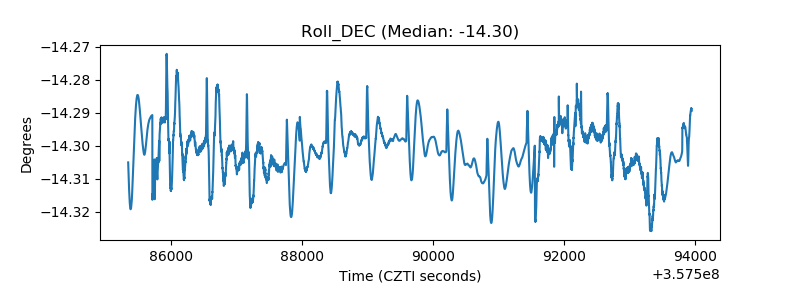 |
| _Roll_RA | 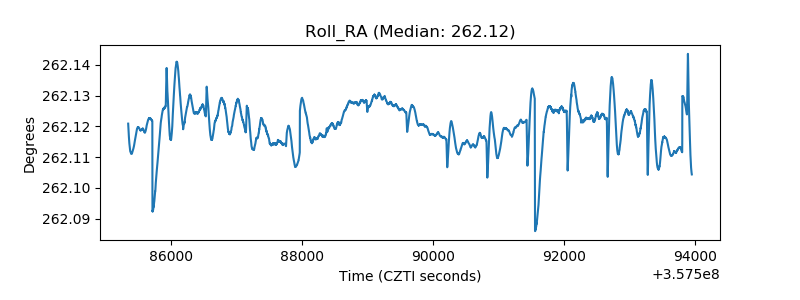 |
| Veto Counter | 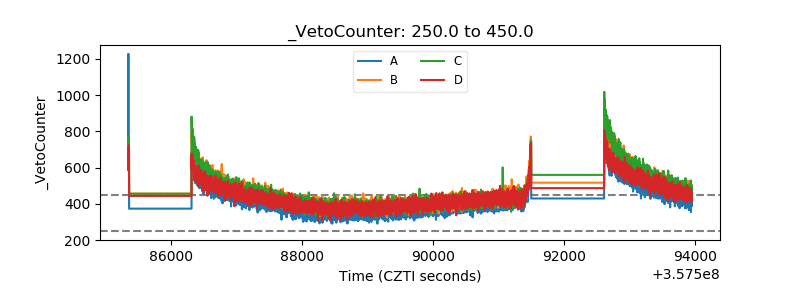 |