| Param | Original file | Final file |
|---|---|---|
| Filename | modeM0/AS1A10_007T01_9000004350_30236cztM0_level2.evt | modeM0/AS1A10_007T01_9000004350_30236cztM0_level2_quad_clean.evt |
| Size (bytes) | 545,693,760 | 109,209,600 |
| Size | 520.4 MB | 104.2 MB |
| Events in quadrant A | 3,958,127 | 710,928 |
| Events in quadrant B | 5,164,418 | 743,689 |
| Events in quadrant C | 3,340,490 | 727,669 |
| Events in quadrant D | 3,633,430 | 682,236 |
| Mode M9 | |||
|---|---|---|---|
| Quadrant | BADHDUFLAG | Total packets | Discarded packets |
| A | 0 | 13 | 0 |
| B | 0 | 14 | 0 |
| C | 0 | 14 | 0 |
| D | 0 | 14 | 0 |
| Mode SS | |||
|---|---|---|---|
| Quadrant | BADHDUFLAG | Total packets | Discarded packets |
| A | 0 | 128 | 0 |
| B | 0 | 128 | 0 |
| C | 0 | 128 | 0 |
| D | 0 | 128 | 0 |
| Mode M0 | |||
|---|---|---|---|
| Quadrant | BADHDUFLAG | Total packets | Discarded packets |
| A | 0 | 15916 | 2 |
| B | 0 | 19590 | 2 |
| C | 0 | 13896 | 2 |
| D | 0 | 14711 | 2 |
| Quadrant | Total seconds | Saturated seconds | Saturation percentage |
|---|---|---|---|
| A | 6351 | 161 | 2.535034% |
| B | 6351 | 88 | 1.385609% |
| C | 6351 | 92 | 1.448591% |
| D | 6351 | 145 | 2.283105% |
Noise dominated data is calculated using 1-second bins in cleaned event files. If a bin has >2000 counts, and if more than 50% of those come from <1% of pixels, then it is considered to be noise-dominated and hence unusable.
| Quadrant | # 1 sec bins | Bins with >0 counts | Bins with >2000 counts | High rate bins dominated by noise | Noise dominated (total time) | Noise dominated (detector-on time) | Marked lightcurve |
|---|---|---|---|---|---|---|---|
| A | 7586 | 6352 | 112 | 112 | 1.48% | 1.76% | 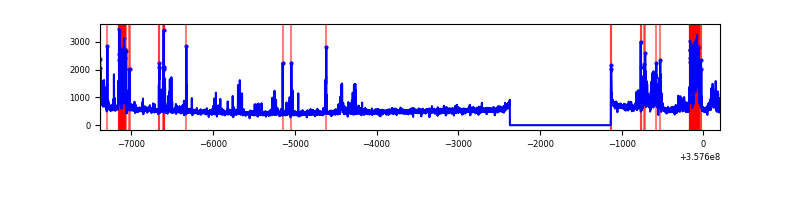 |
| B | 7586 | 6352 | 1 | 1 | 0.01% | 0.02% | 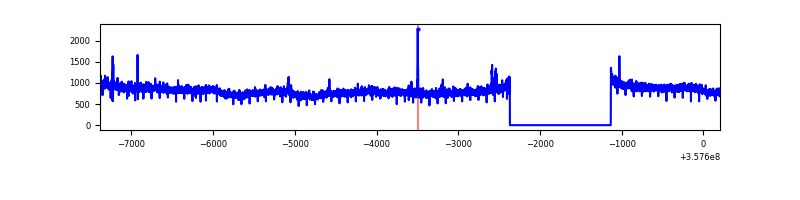 |
| C | 7586 | 6352 | 1 | 1 | 0.01% | 0.02% | 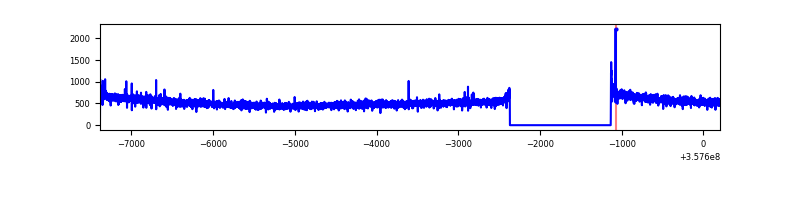 |
| D | 7586 | 6352 | 129 | 129 | 1.70% | 2.03% | 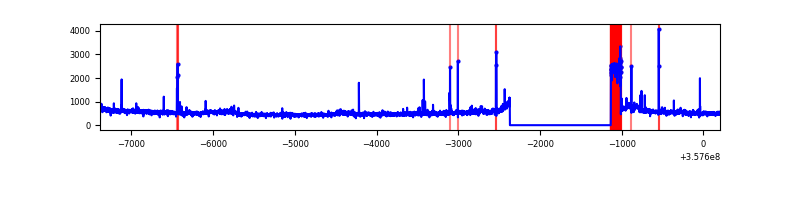 |
Top three noisy pixels from each quadrant. If the there are fewer than three noisy pixels in the level2.evt file, extra rows are filled as -1
| Pixel properties | Quadrant properties | ||||||
|---|---|---|---|---|---|---|---|
| Quadrant | DetID | PixID | Counts | Sigma | Mean | Median | Sigma |
| A | 14 | 239 | 545904 | 3334.85 | 822 | 807 | 163.5 |
| A | 0 | 13 | 203986 | 1243.03 | 822 | 807 | 163.5 |
| A | 8 | 192 | 25035 | 148.22 | 822 | 807 | 163.5 |
| B | 6 | 159 | 1861970 | 11797.43 | 833 | 813 | 157.8 |
| B | 0 | 190 | 19966 | 121.41 | 833 | 813 | 157.8 |
| B | 12 | 111 | 19015 | 115.38 | 833 | 813 | 157.8 |
| C | 14 | 238 | 135743 | 703.51 | 815 | 825 | 191.8 |
| C | 2 | 114 | 14869 | 73.23 | 815 | 825 | 191.8 |
| C | 3 | 233 | 12903 | 62.98 | 815 | 825 | 191.8 |
| D | 8 | 195 | 284023 | 1461.5 | 789 | 772 | 193.8 |
| D | 13 | 104 | 275129 | 1415.61 | 789 | 772 | 193.8 |
| D | 2 | 250 | 26931 | 134.97 | 789 | 772 | 193.8 |
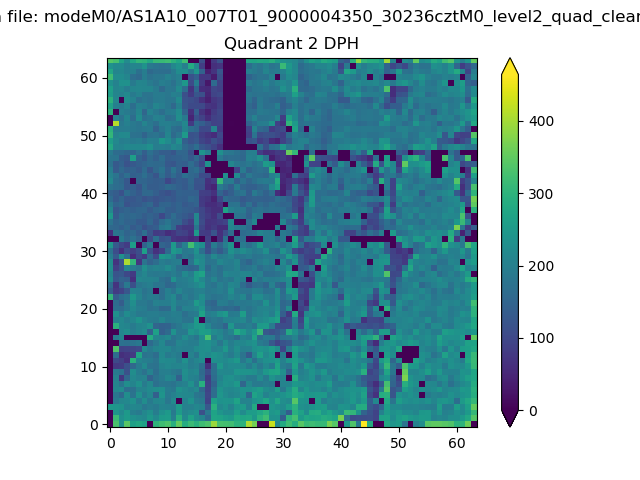
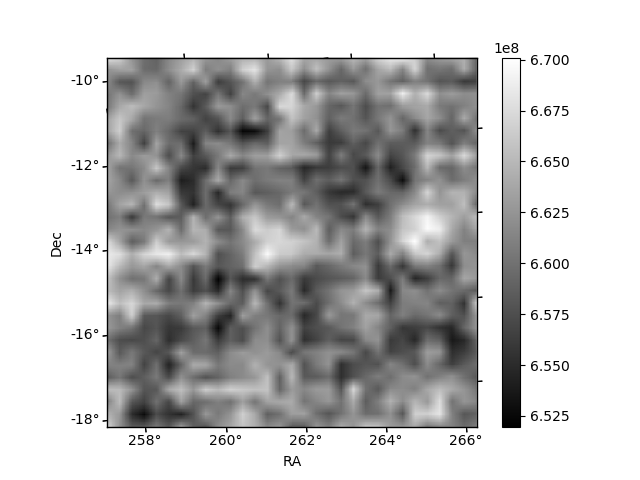
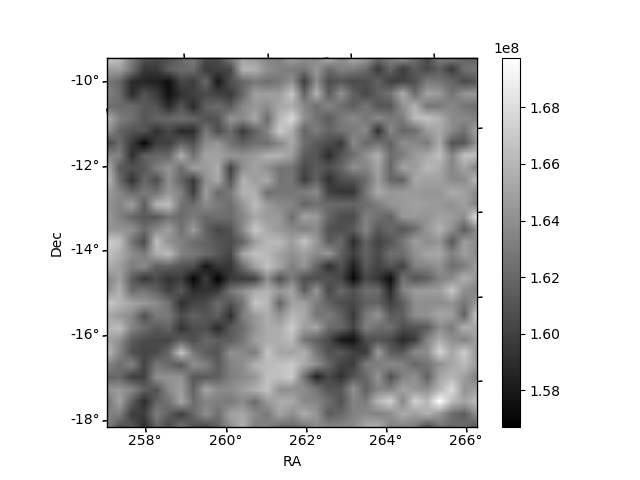
Histogram calculated using DETX and DETY for each event in the final _common_clean file
| Quadrant A | 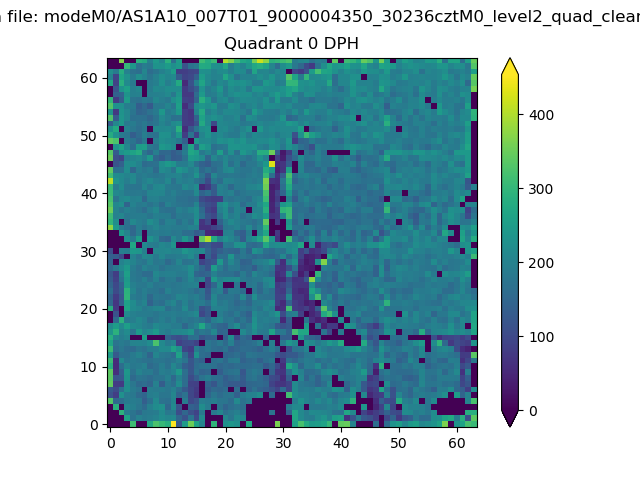 |
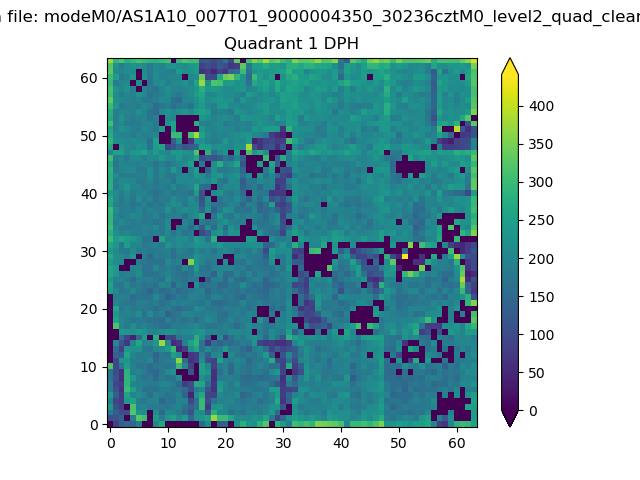 |
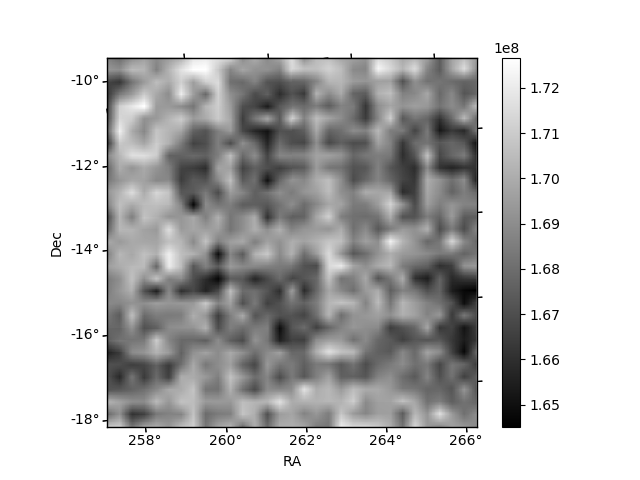
Quadrant B |
|---|---|---|---|
| Quadrant D | 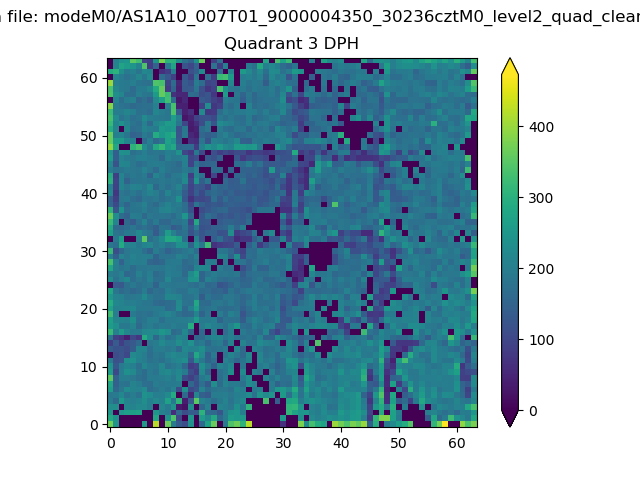 |
 |
Quadrant C |
| Plot type | Count rate plots | Images |
|---|---|---|
| Comparison with Poisson distribution Blue bars denote a histogram of data divided into 1 sec bins. Red curve is a Poisson curve with rate = median count rate of data. |
 |
 |
| Quadrant-wise count rates Data is divided into 100 sec bins |
 |
|
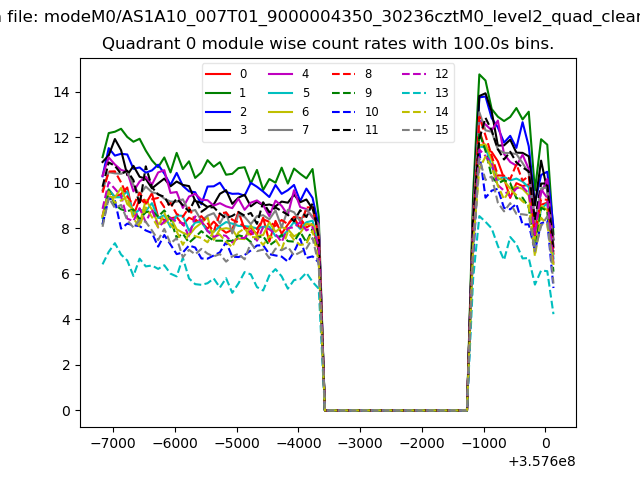
| Module-wise count rates for Quadrant A Data is divided into 100 sec bins |
 |
 |
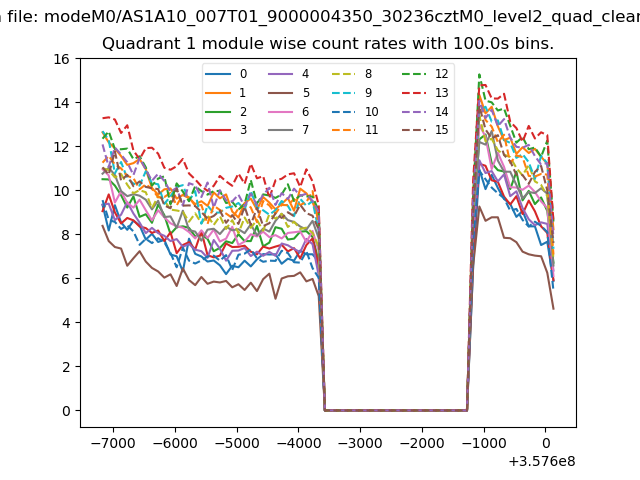
| Module-wise count rates for Quadrant B Data is divided into 100 sec bins |
 |
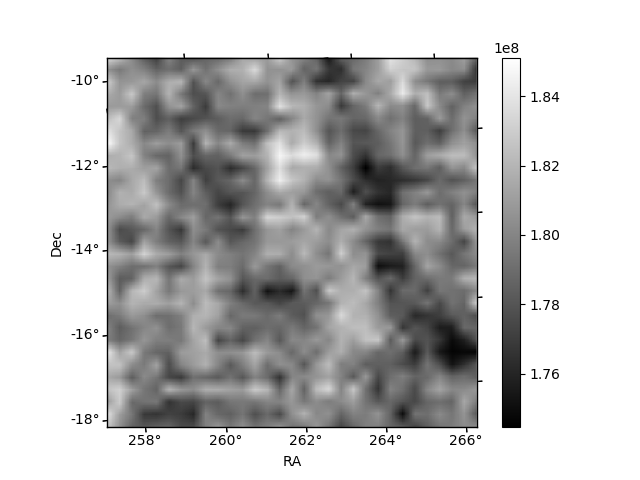 |
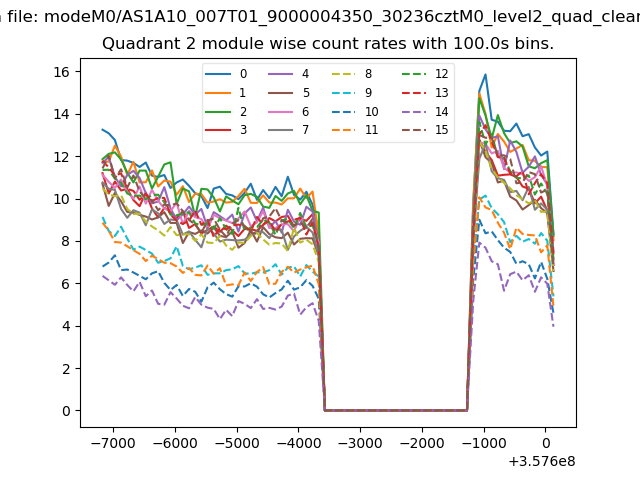
| Module-wise count rates for Quadrant C Data is divided into 100 sec bins |
 |
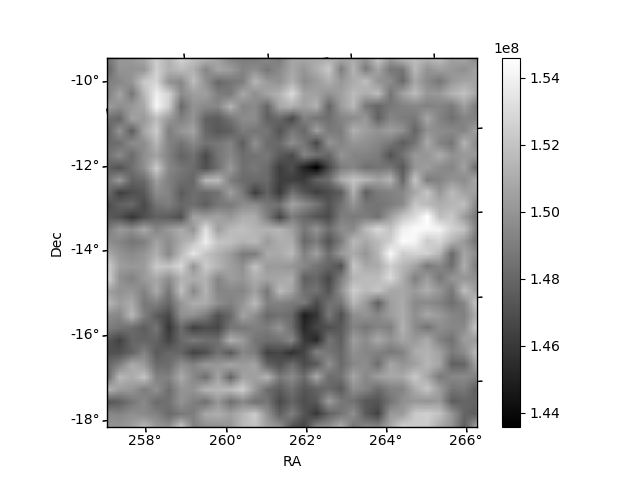 |
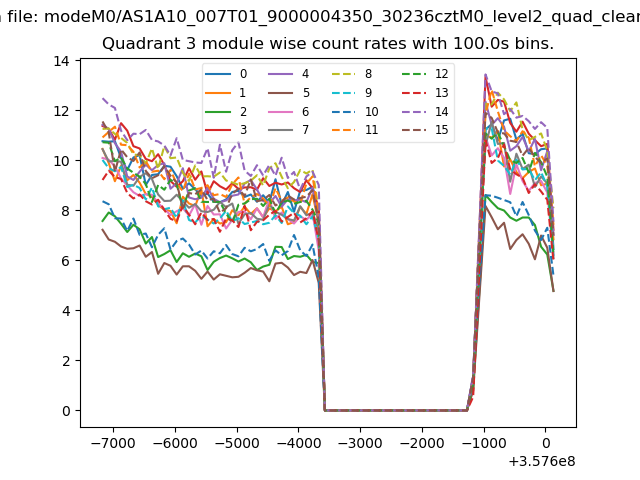
| Module-wise count rates for Quadrant D Data is divided into 100 sec bins |
 |
 |
| Parameter | Plot |
|---|---|
| CZT HV Monitor | 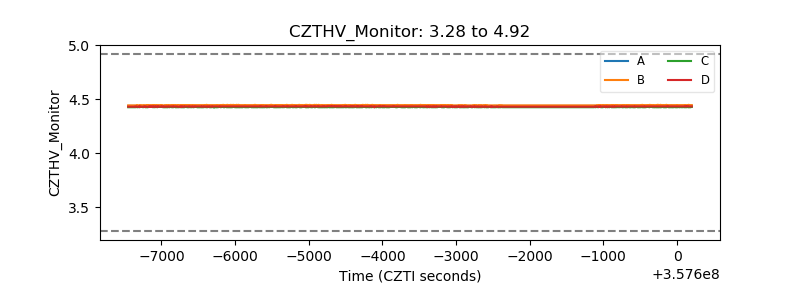 |
| D_VDD | 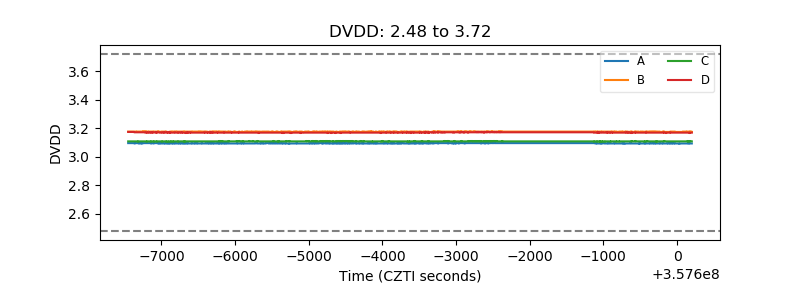 |
| Temperature 1 | 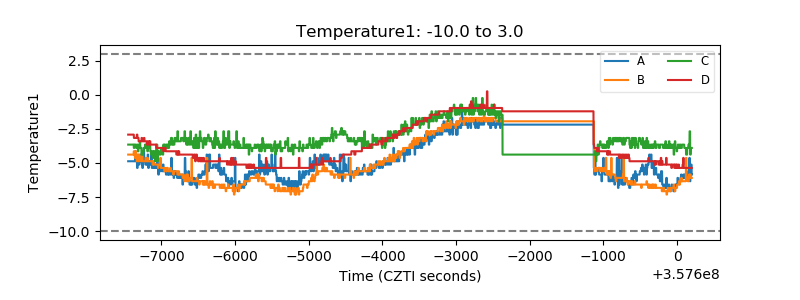 |
| Veto HV Monitor | 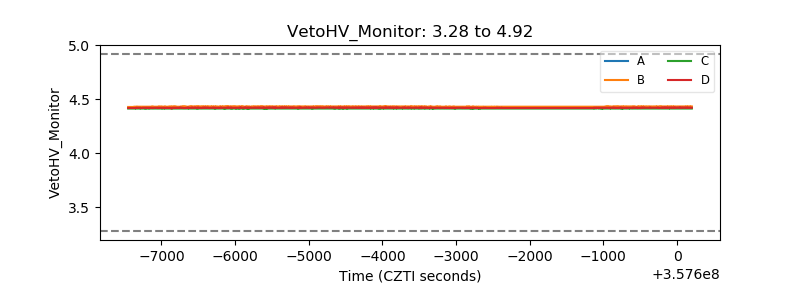 |
| Veto LLD | 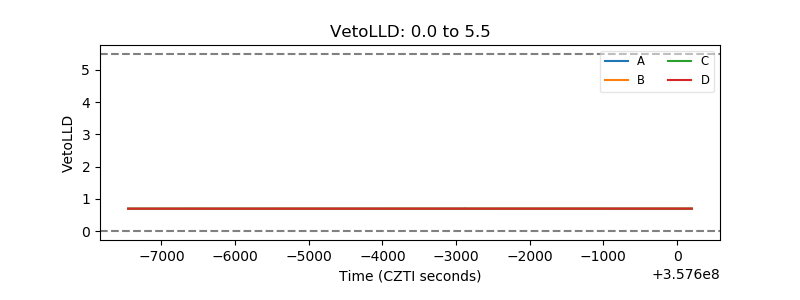 |
| Alpha Counter |  |
| _CPM_Rate | 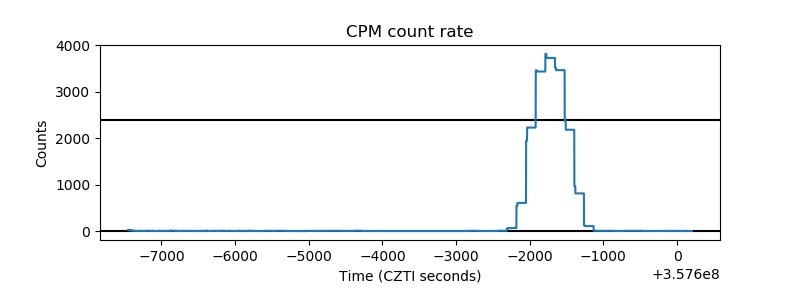 |
| CZT Counter | 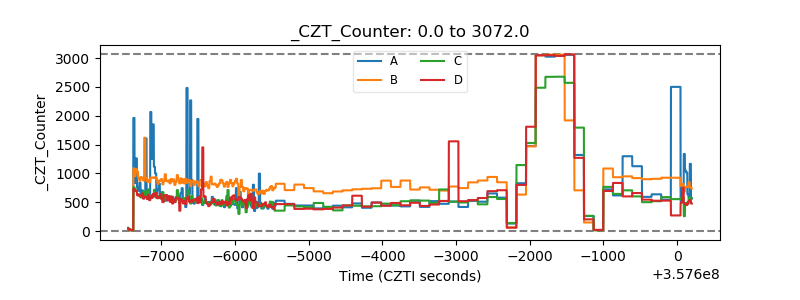 |
| +2.5 Volts monitor |  |
| +5 Volts monitor |  |
| _ROLL_ROT | 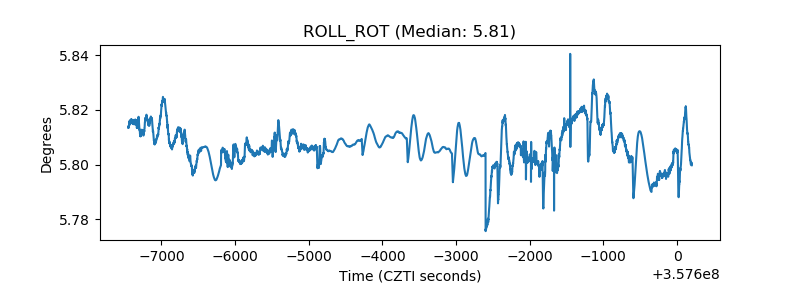 |
| _Roll_DEC | 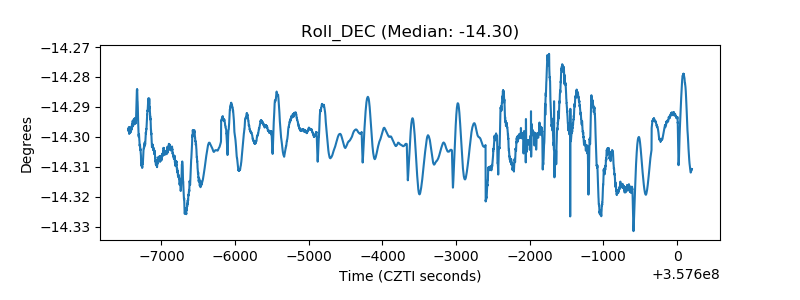 |
| _Roll_RA | 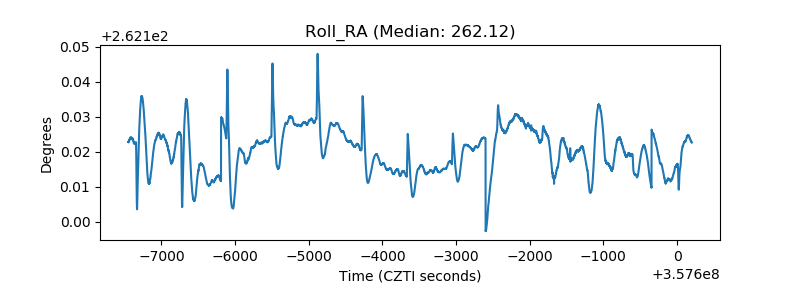 |
| Veto Counter | 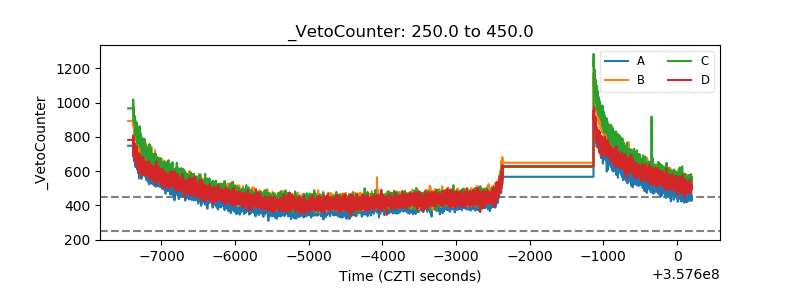 |