| Param | Original file | Final file |
|---|---|---|
| Filename | modeM0/AS1A10_007T01_9000004350_30238cztM0_level2.evt | modeM0/AS1A10_007T01_9000004350_30238cztM0_level2_quad_clean.evt |
| Size (bytes) | 580,034,880 | 112,420,800 |
| Size | 553.2 MB | 107.2 MB |
| Events in quadrant A | 4,616,613 | 706,697 |
| Events in quadrant B | 5,331,912 | 770,360 |
| Events in quadrant C | 3,674,682 | 748,539 |
| Events in quadrant D | 3,505,663 | 727,894 |
| Mode M9 | |||
|---|---|---|---|
| Quadrant | BADHDUFLAG | Total packets | Discarded packets |
| A | 0 | 23 | 0 |
| B | 0 | 24 | 0 |
| C | 0 | 24 | 0 |
| D | 0 | 24 | 0 |
| Mode SS | |||
|---|---|---|---|
| Quadrant | BADHDUFLAG | Total packets | Discarded packets |
| A | 0 | 132 | 0 |
| B | 0 | 132 | 0 |
| C | 0 | 132 | 0 |
| D | 0 | 132 | 0 |
| Mode M0 | |||
|---|---|---|---|
| Quadrant | BADHDUFLAG | Total packets | Discarded packets |
| A | 0 | 17750 | 2 |
| B | 0 | 20056 | 2 |
| C | 0 | 14869 | 2 |
| D | 0 | 14307 | 2 |
| Quadrant | Total seconds | Saturated seconds | Saturation percentage |
|---|---|---|---|
| A | 6466 | 447 | 6.913084% |
| B | 6466 | 90 | 1.391896% |
| C | 6466 | 94 | 1.453758% |
| D | 6465 | 5 | 0.077340% |
Noise dominated data is calculated using 1-second bins in cleaned event files. If a bin has >2000 counts, and if more than 50% of those come from <1% of pixels, then it is considered to be noise-dominated and hence unusable.
| Quadrant | # 1 sec bins | Bins with >0 counts | Bins with >2000 counts | High rate bins dominated by noise | Noise dominated (total time) | Noise dominated (detector-on time) | Marked lightcurve |
|---|---|---|---|---|---|---|---|
| A | 7846 | 6467 | 345 | 345 | 4.40% | 5.33% | 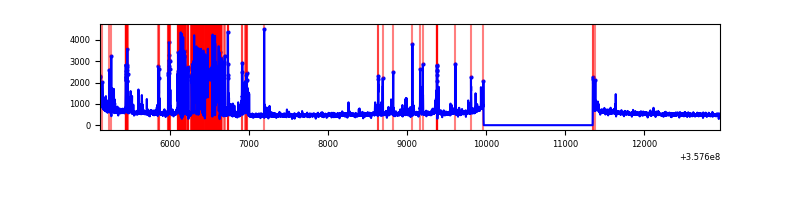 |
| B | 7846 | 6467 | 1 | 1 | 0.01% | 0.02% | 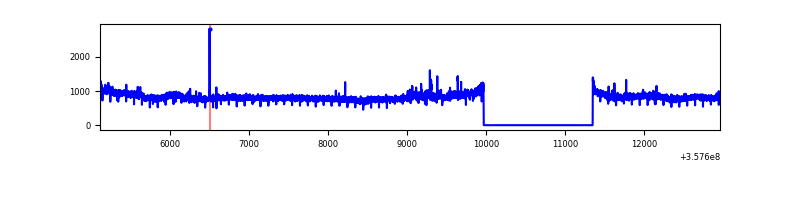 |
| C | 7846 | 6467 | 1 | 1 | 0.01% | 0.02% | 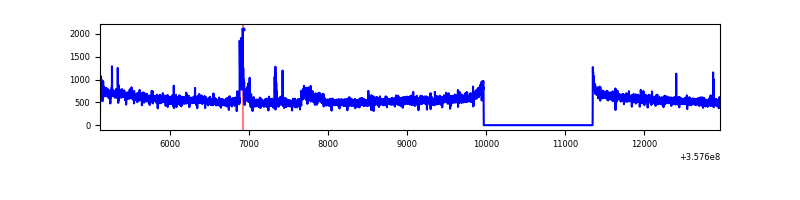 |
| D | 7845 | 6466 | 2 | 2 | 0.03% | 0.03% | 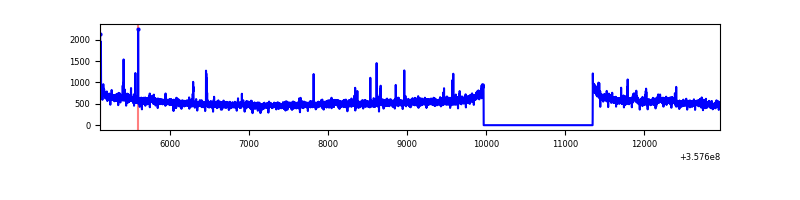 |
Top three noisy pixels from each quadrant. If the there are fewer than three noisy pixels in the level2.evt file, extra rows are filled as -1
| Pixel properties | Quadrant properties | ||||||
|---|---|---|---|---|---|---|---|
| Quadrant | DetID | PixID | Counts | Sigma | Mean | Median | Sigma |
| A | 0 | 13 | 1271125 | 7547.01 | 851 | 837 | 168.3 |
| A | 14 | 239 | 33080 | 191.56 | 851 | 837 | 168.3 |
| A | 8 | 192 | 25531 | 146.71 | 851 | 837 | 168.3 |
| B | 6 | 159 | 1822105 | 11056.19 | 881 | 862 | 164.7 |
| B | 0 | 229 | 45705 | 272.23 | 881 | 862 | 164.7 |
| B | 12 | 111 | 19073 | 110.55 | 881 | 862 | 164.7 |
| C | 14 | 238 | 146775 | 723.71 | 864 | 875 | 201.6 |
| C | 3 | 233 | 136470 | 672.6 | 864 | 875 | 201.6 |
| C | 2 | 114 | 14917 | 69.65 | 864 | 875 | 201.6 |
| D | 8 | 195 | 214916 | 1054.39 | 858 | 842 | 203.0 |
| D | 2 | 234 | 22945 | 108.87 | 858 | 842 | 203.0 |
| D | 2 | 250 | 17653 | 82.8 | 858 | 842 | 203.0 |
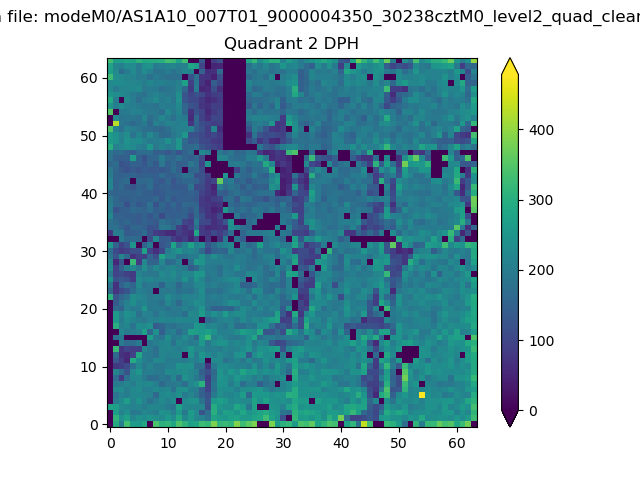
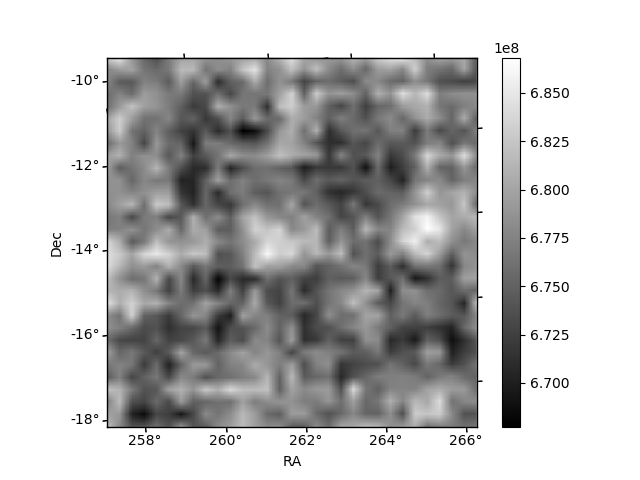
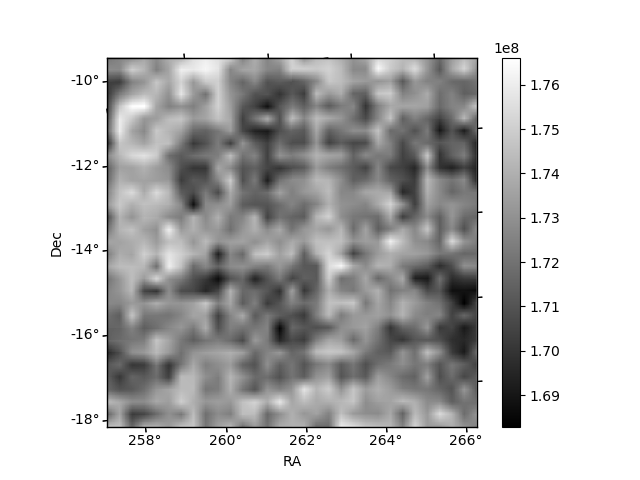
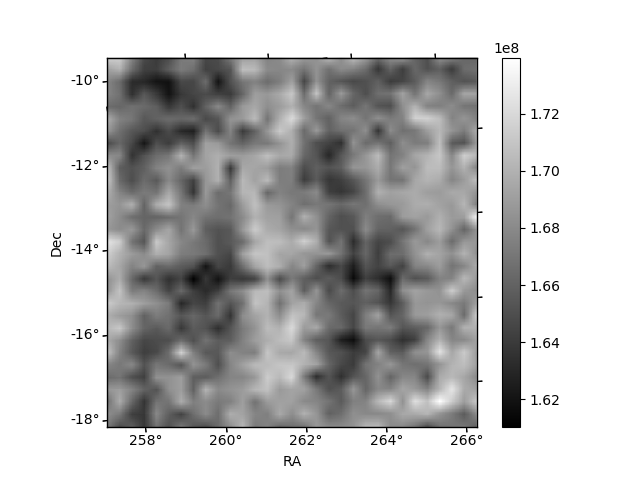
Histogram calculated using DETX and DETY for each event in the final _common_clean file
| Quadrant A | 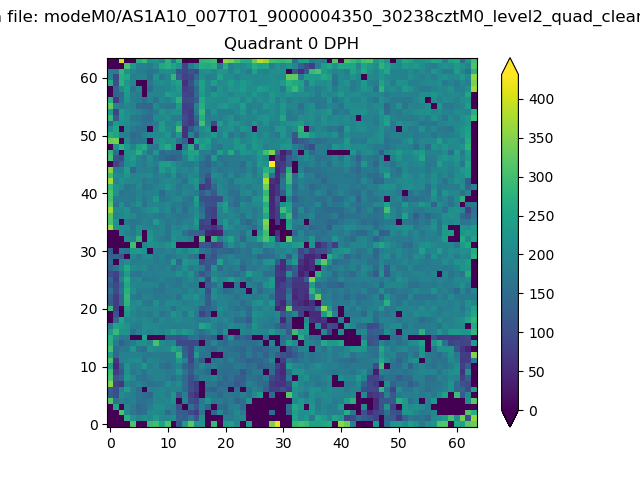 |
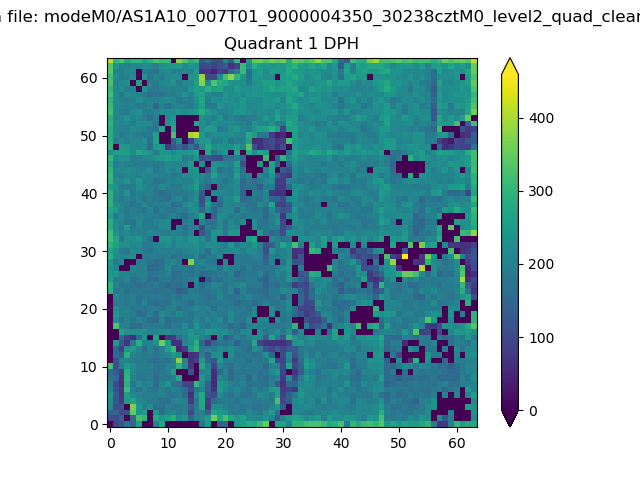 |
Quadrant B |
|---|---|---|---|
| Quadrant D | 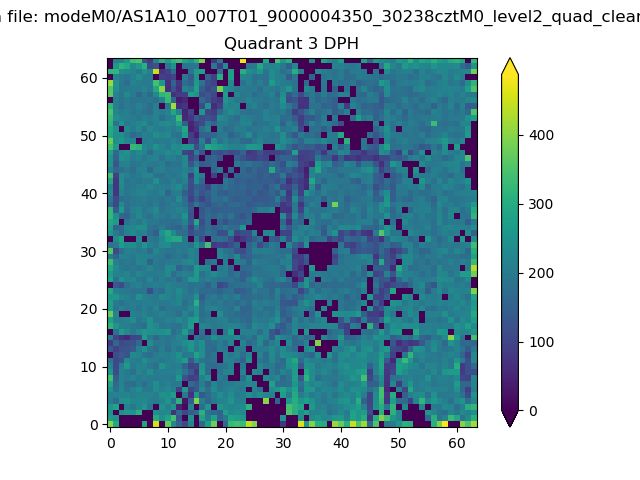 |
 |
Quadrant C |
| Plot type | Count rate plots | Images |
|---|---|---|
| Comparison with Poisson distribution Blue bars denote a histogram of data divided into 1 sec bins. Red curve is a Poisson curve with rate = median count rate of data. |
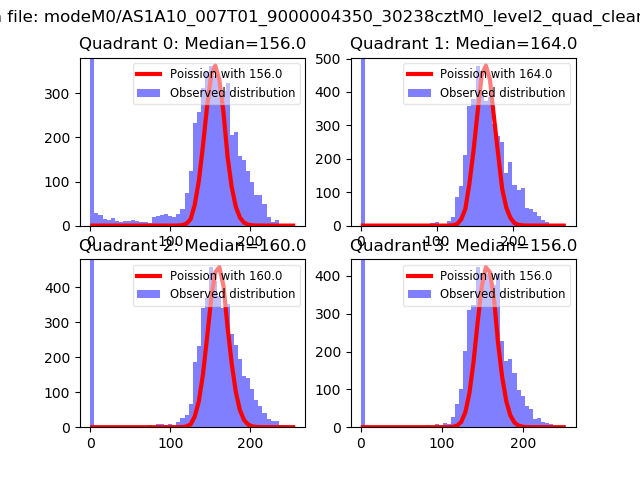 |
 |
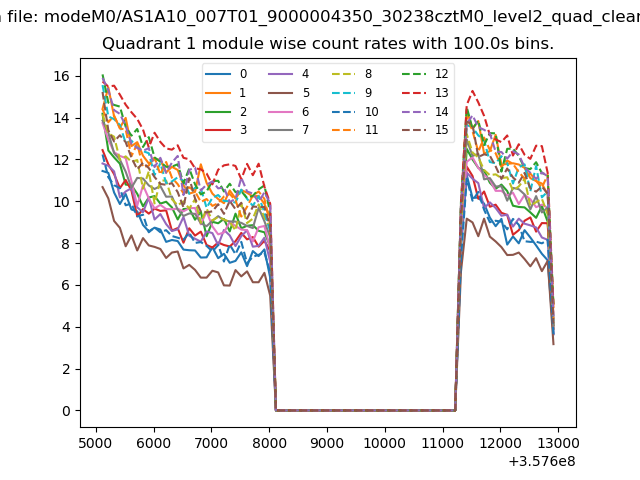
| Quadrant-wise count rates Data is divided into 100 sec bins |
 |
|
| Module-wise count rates for Quadrant A Data is divided into 100 sec bins |
 |
 |
| Module-wise count rates for Quadrant B Data is divided into 100 sec bins |
 |
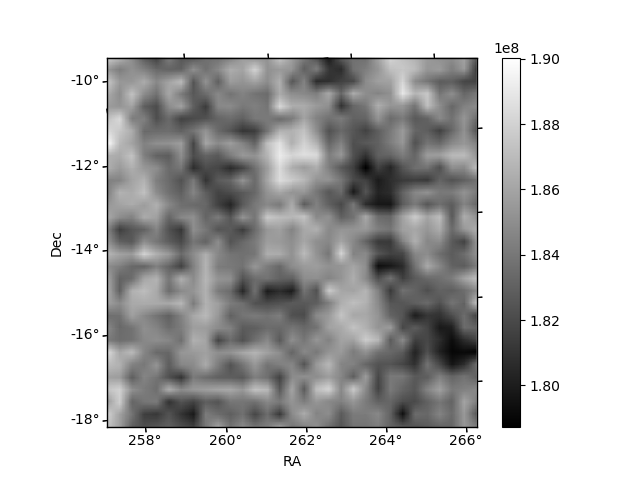 |
| Module-wise count rates for Quadrant C Data is divided into 100 sec bins |
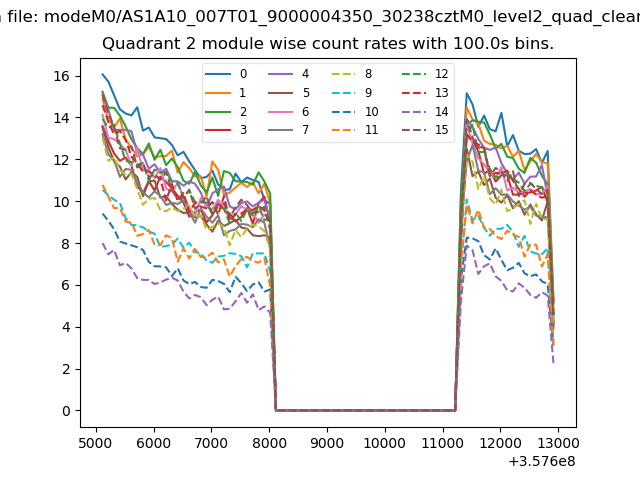 |
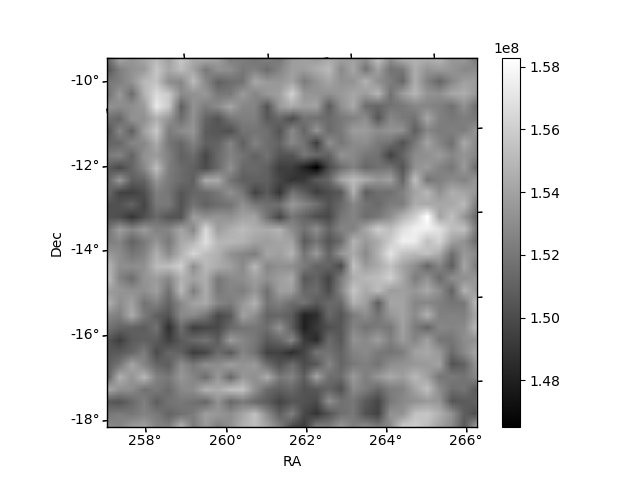 |
| Module-wise count rates for Quadrant D Data is divided into 100 sec bins |
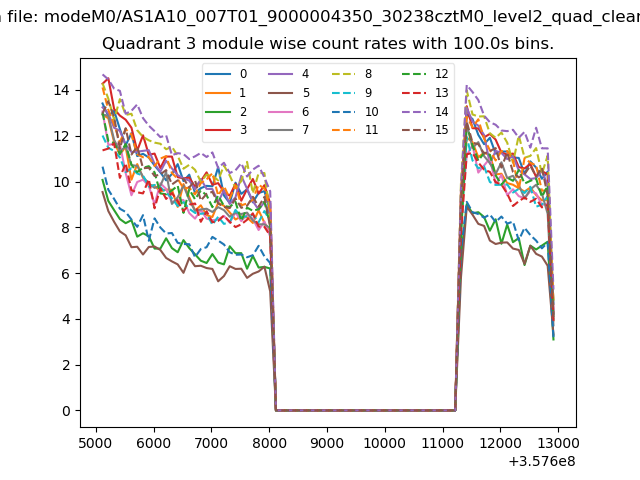 |
 |
| Parameter | Plot |
|---|---|
| CZT HV Monitor | 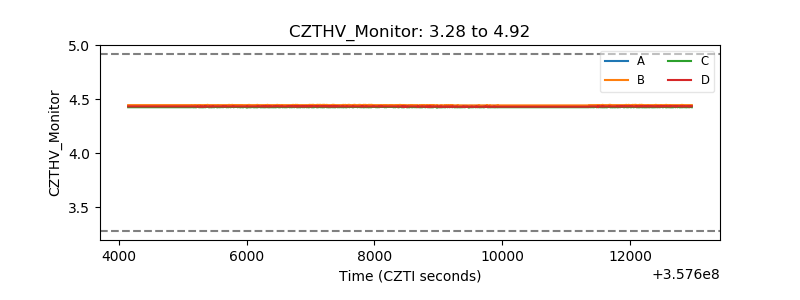 |
| D_VDD | 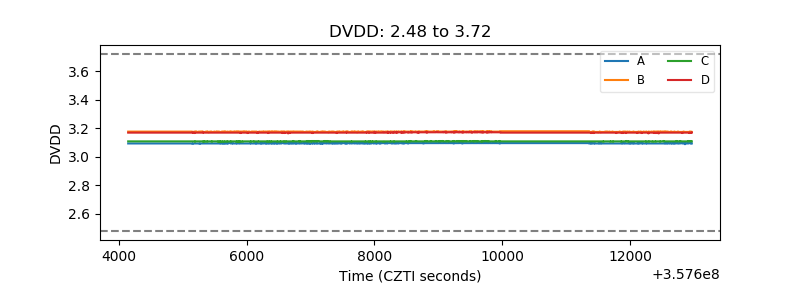 |
| Temperature 1 | 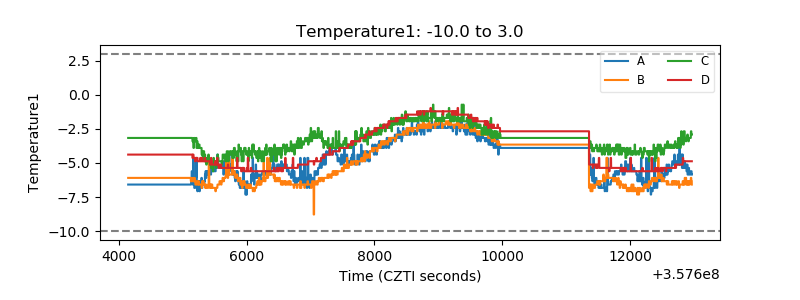 |
| Veto HV Monitor |  |
| Veto LLD | 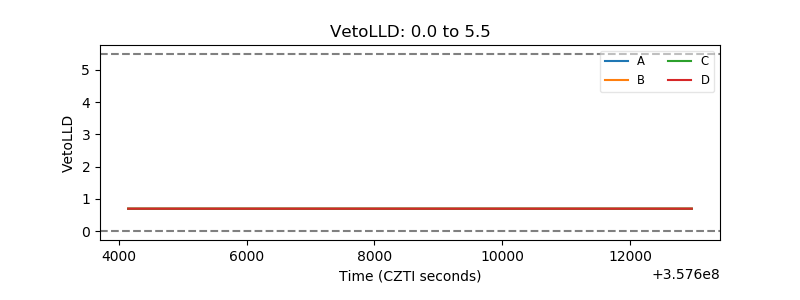 |
| Alpha Counter | 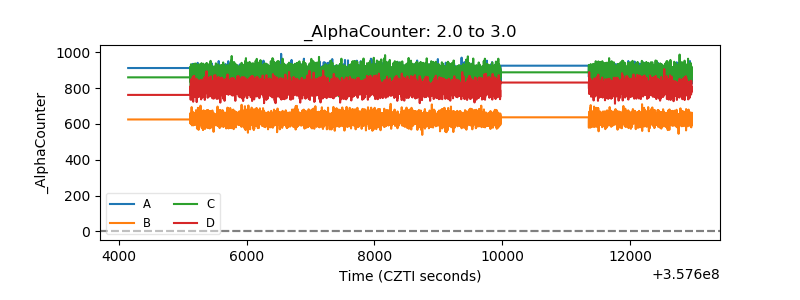 |
| _CPM_Rate | 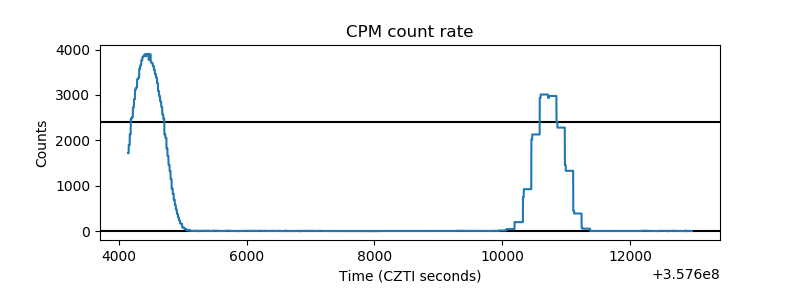 |
| CZT Counter | 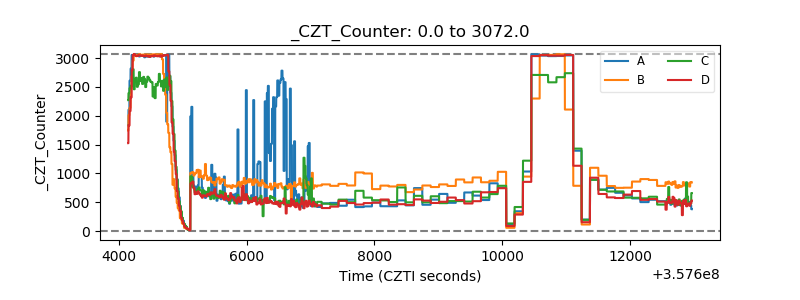 |
| +2.5 Volts monitor | 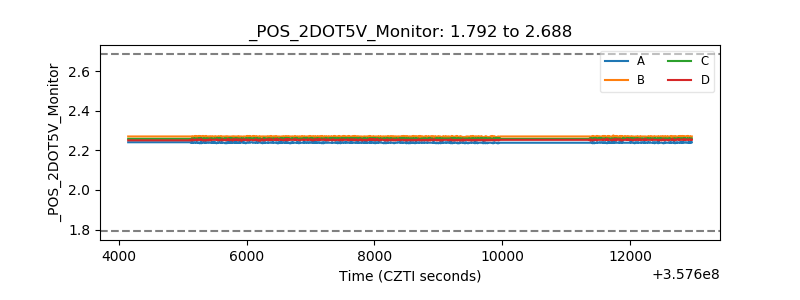 |
| +5 Volts monitor |  |
| _ROLL_ROT | 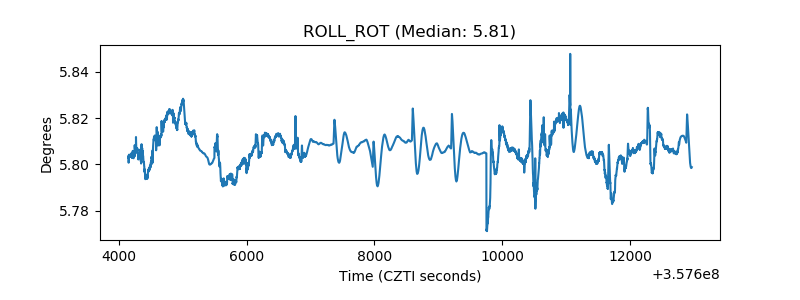 |
| _Roll_DEC | 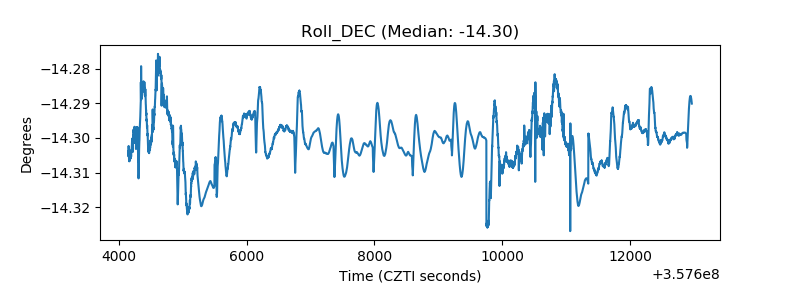 |
| _Roll_RA | 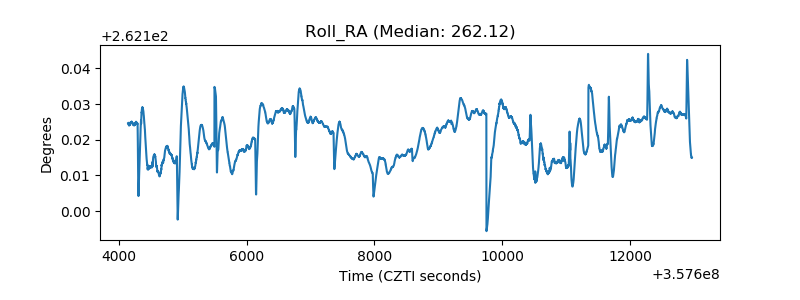 |
| Veto Counter | 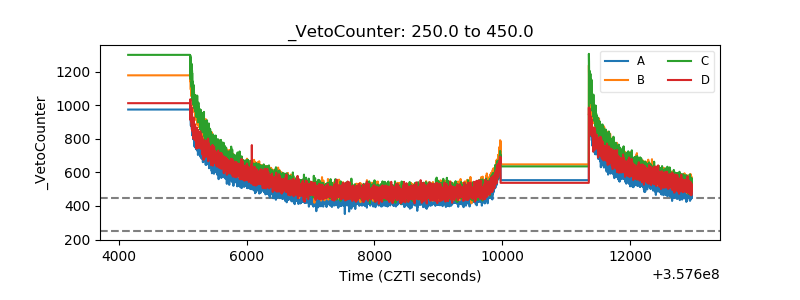 |