| Param | Original file | Final file |
|---|---|---|
| Filename | modeM0/AS1A10_007T01_9000004350_30239cztM0_level2.evt | modeM0/AS1A10_007T01_9000004350_30239cztM0_level2_quad_clean.evt |
| Size (bytes) | 538,655,040 | 104,771,520 |
| Size | 513.7 MB | 99.9 MB |
| Events in quadrant A | 3,451,724 | 680,567 |
| Events in quadrant B | 5,271,052 | 694,961 |
| Events in quadrant C | 3,543,674 | 676,616 |
| Events in quadrant D | 3,603,703 | 664,803 |
| Mode M9 | |||
|---|---|---|---|
| Quadrant | BADHDUFLAG | Total packets | Discarded packets |
| A | 0 | 16 | 0 |
| B | 0 | 17 | 0 |
| C | 0 | 17 | 0 |
| D | 0 | 17 | 0 |
| Mode SS | |||
|---|---|---|---|
| Quadrant | BADHDUFLAG | Total packets | Discarded packets |
| A | 0 | 130 | 0 |
| B | 0 | 130 | 0 |
| C | 0 | 130 | 0 |
| D | 0 | 130 | 0 |
| Mode M0 | |||
|---|---|---|---|
| Quadrant | BADHDUFLAG | Total packets | Discarded packets |
| A | 0 | 14037 | 2 |
| B | 0 | 20028 | 2 |
| C | 0 | 14325 | 2 |
| D | 0 | 14640 | 2 |
| Quadrant | Total seconds | Saturated seconds | Saturation percentage |
|---|---|---|---|
| A | 6550 | 59 | 0.900763% |
| B | 6550 | 119 | 1.816794% |
| C | 6550 | 85 | 1.297710% |
| D | 6550 | 8 | 0.122137% |
Noise dominated data is calculated using 1-second bins in cleaned event files. If a bin has >2000 counts, and if more than 50% of those come from <1% of pixels, then it is considered to be noise-dominated and hence unusable.
| Quadrant | # 1 sec bins | Bins with >0 counts | Bins with >2000 counts | High rate bins dominated by noise | Noise dominated (total time) | Noise dominated (detector-on time) | Marked lightcurve |
|---|---|---|---|---|---|---|---|
| A | 7890 | 6551 | 5 | 5 | 0.06% | 0.08% | 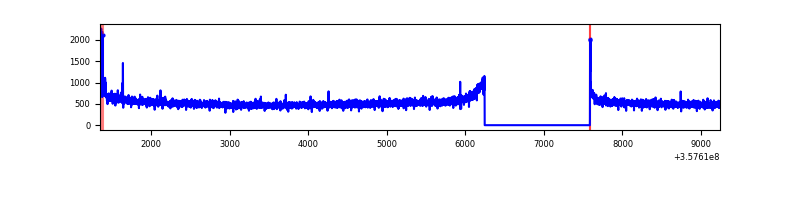 |
| B | 7890 | 6551 | 1 | 1 | 0.01% | 0.02% | 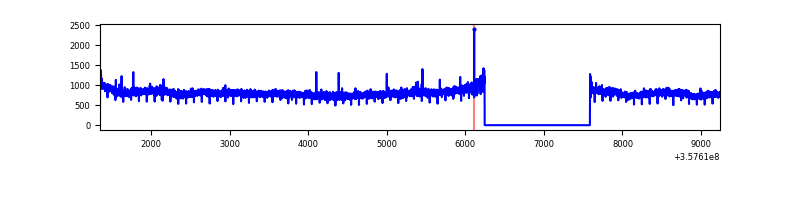 |
| C | 7890 | 6551 | 1 | 1 | 0.01% | 0.02% | 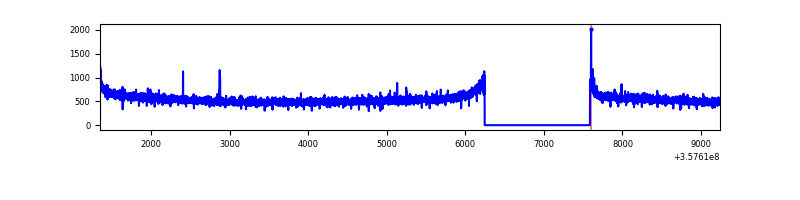 |
| D | 7890 | 6551 | 3 | 3 | 0.04% | 0.05% | 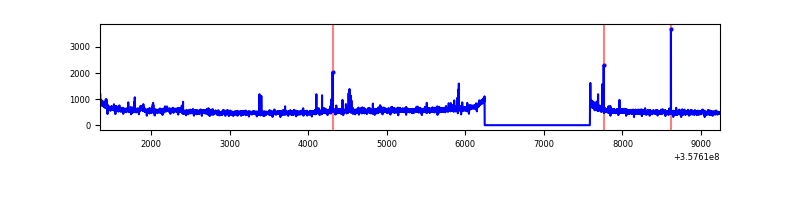 |
Top three noisy pixels from each quadrant. If the there are fewer than three noisy pixels in the level2.evt file, extra rows are filled as -1
| Pixel properties | Quadrant properties | ||||||
|---|---|---|---|---|---|---|---|
| Quadrant | DetID | PixID | Counts | Sigma | Mean | Median | Sigma |
| A | 8 | 192 | 23419 | 128.8 | 883 | 870 | 175.1 |
| A | 0 | 13 | 17230 | 93.45 | 883 | 870 | 175.1 |
| A | 13 | 254 | 11074 | 58.29 | 883 | 870 | 175.1 |
| B | 6 | 159 | 1820289 | 11039.24 | 876 | 856 | 164.8 |
| B | 12 | 111 | 19444 | 112.78 | 876 | 856 | 164.8 |
| B | 11 | 111 | 18025 | 104.17 | 876 | 856 | 164.8 |
| C | 14 | 238 | 139392 | 691.35 | 859 | 868 | 200.4 |
| C | 3 | 233 | 35362 | 172.15 | 859 | 868 | 200.4 |
| C | 2 | 114 | 15312 | 72.09 | 859 | 868 | 200.4 |
| D | 8 | 195 | 263808 | 1275.9 | 863 | 845 | 206.1 |
| D | 2 | 234 | 23987 | 112.29 | 863 | 845 | 206.1 |
| D | 10 | 199 | 21816 | 101.75 | 863 | 845 | 206.1 |
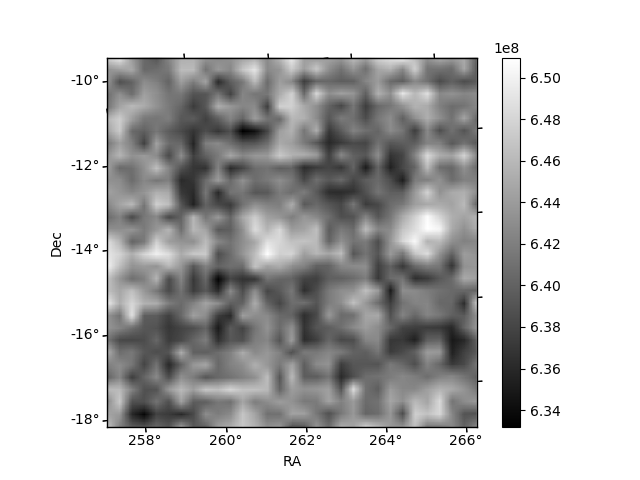
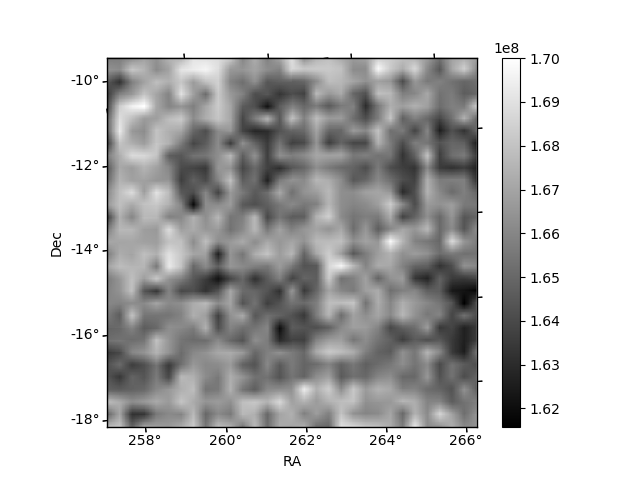
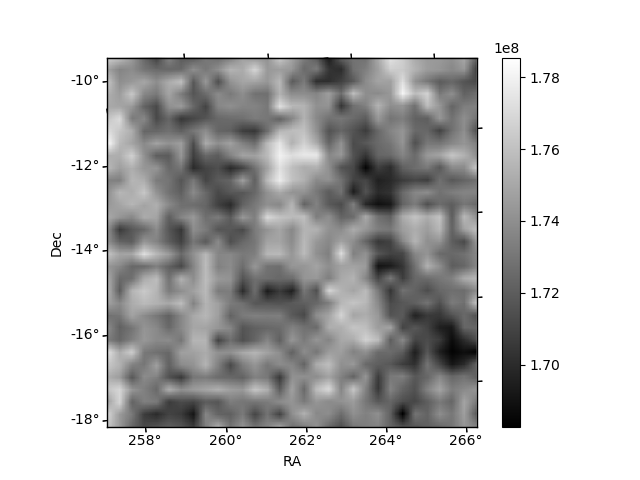
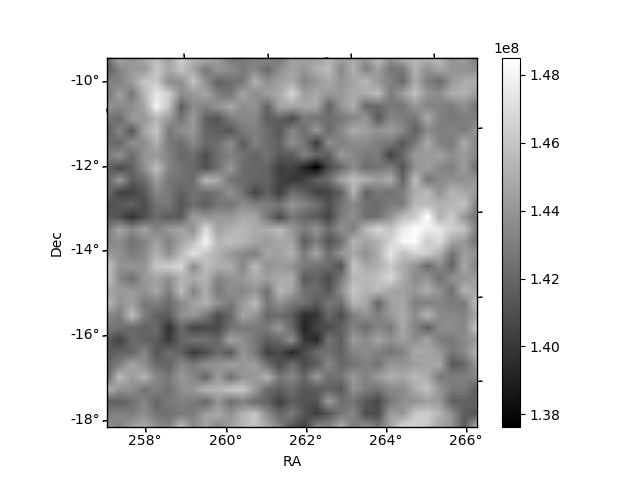
Histogram calculated using DETX and DETY for each event in the final _common_clean file
| Quadrant A | 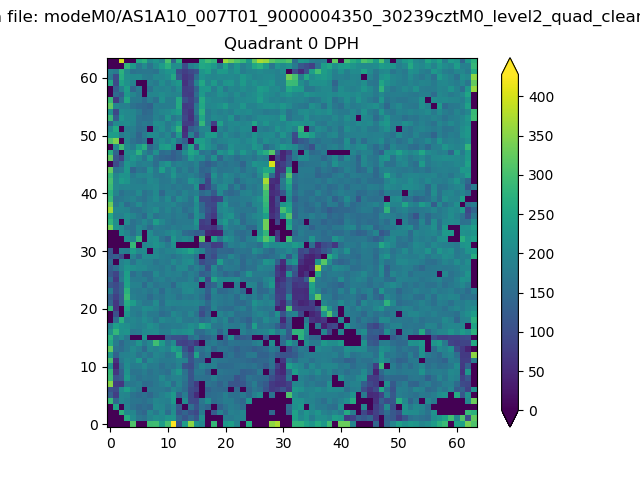 |
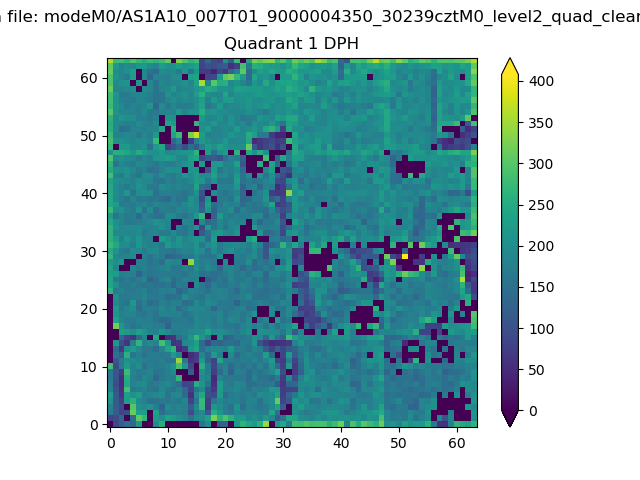 |
Quadrant B |
|---|---|---|---|
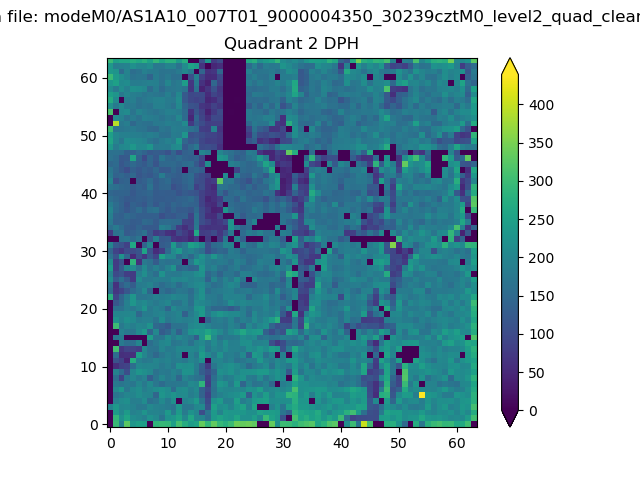
| Quadrant D | 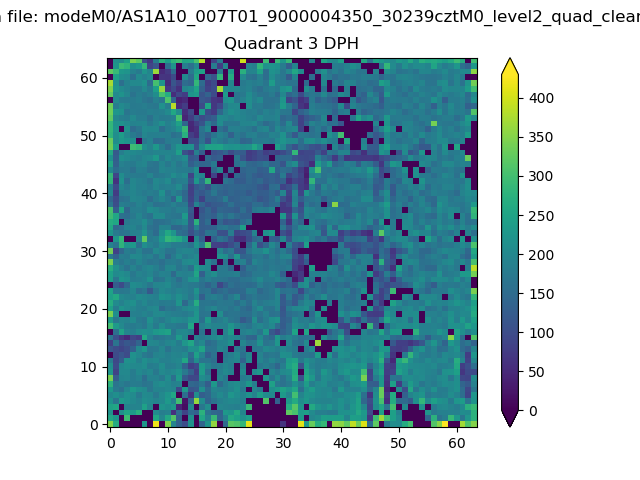 |
 |
Quadrant C |
| Plot type | Count rate plots | Images |
|---|---|---|
| Comparison with Poisson distribution Blue bars denote a histogram of data divided into 1 sec bins. Red curve is a Poisson curve with rate = median count rate of data. |
 |
 |
| Quadrant-wise count rates Data is divided into 100 sec bins |
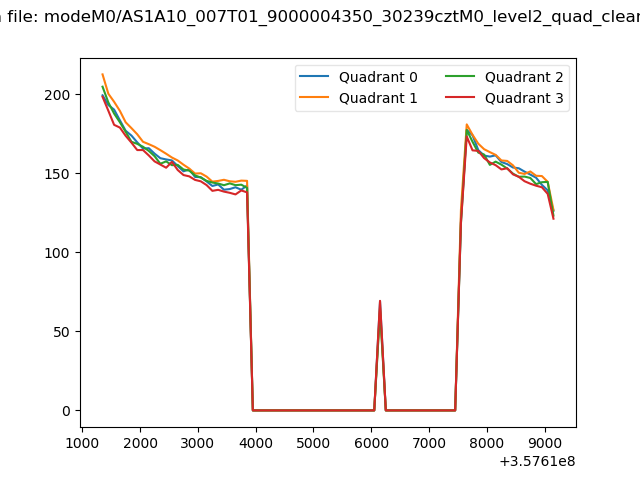 |
|
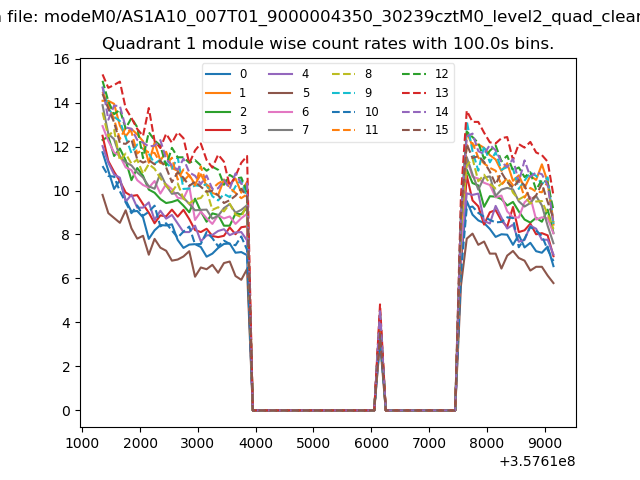
| Module-wise count rates for Quadrant A Data is divided into 100 sec bins |
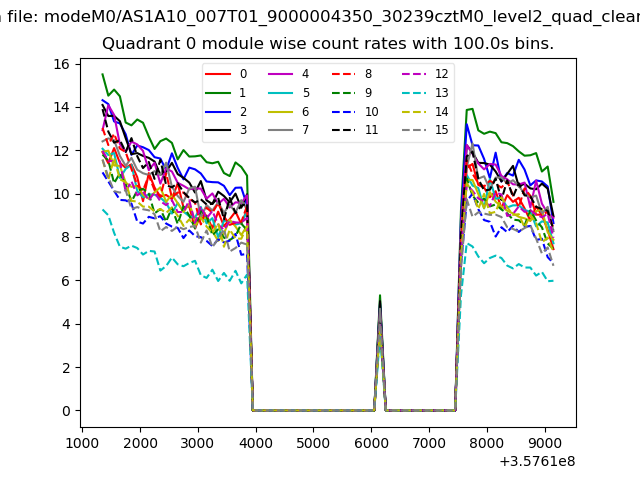 |
 |
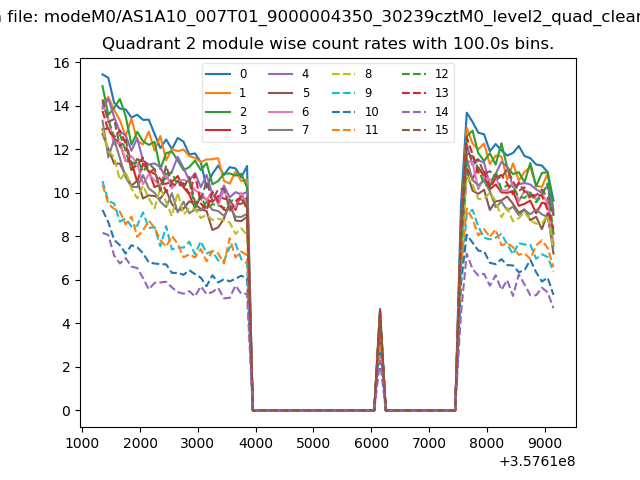
| Module-wise count rates for Quadrant B Data is divided into 100 sec bins |
 |
 |
| Module-wise count rates for Quadrant C Data is divided into 100 sec bins |
 |
 |
| Module-wise count rates for Quadrant D Data is divided into 100 sec bins |
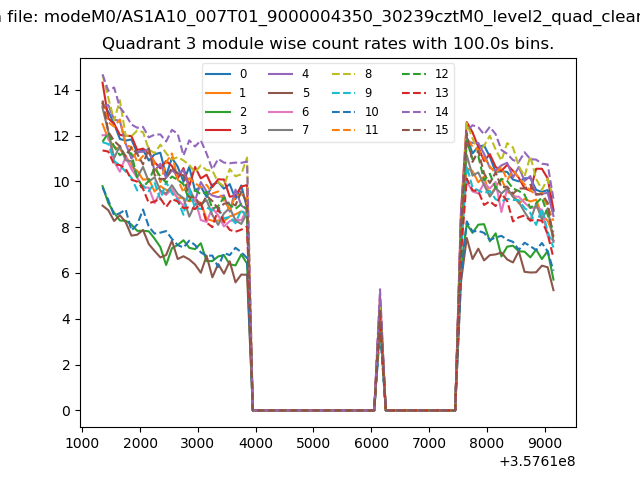 |
 |
| Parameter | Plot |
|---|---|
| CZT HV Monitor | 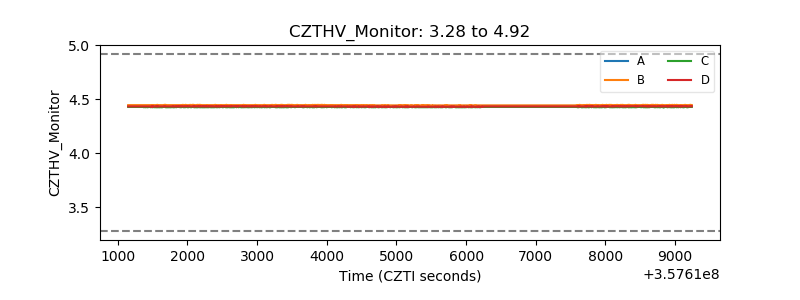 |
| D_VDD | 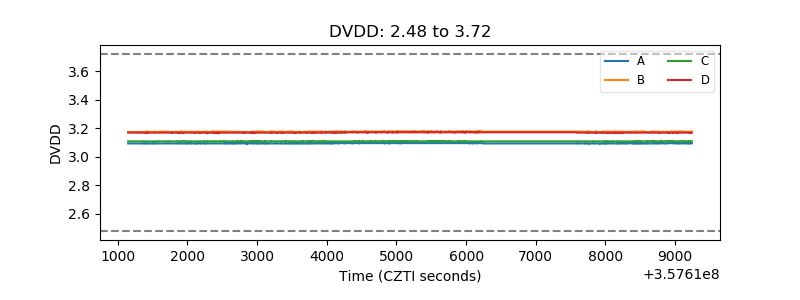 |
| Temperature 1 | 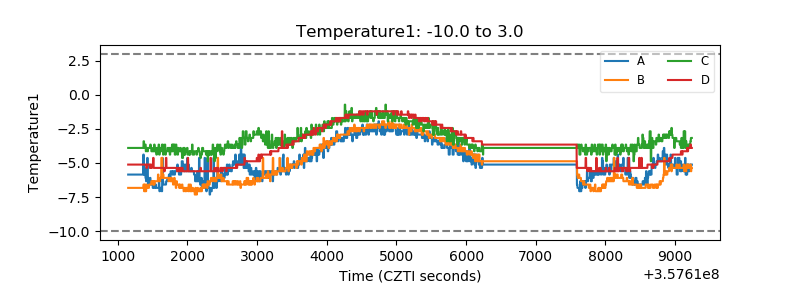 |
| Veto HV Monitor | 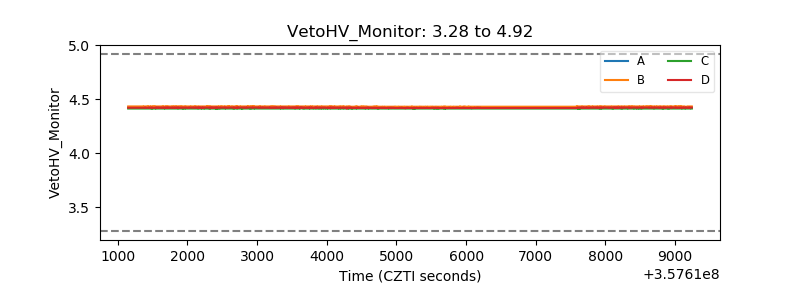 |
| Veto LLD | 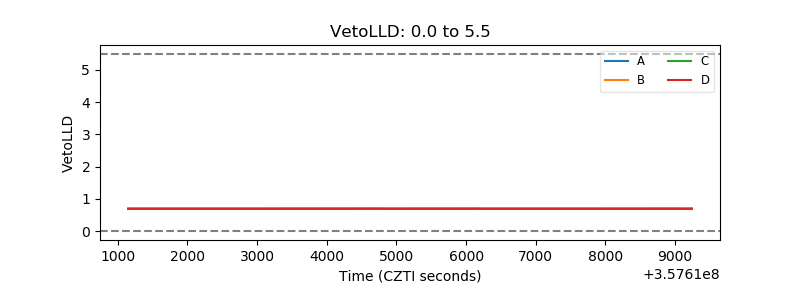 |
| Alpha Counter | 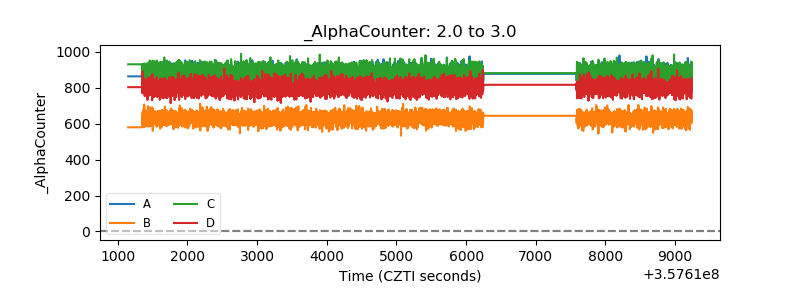 |
| _CPM_Rate | 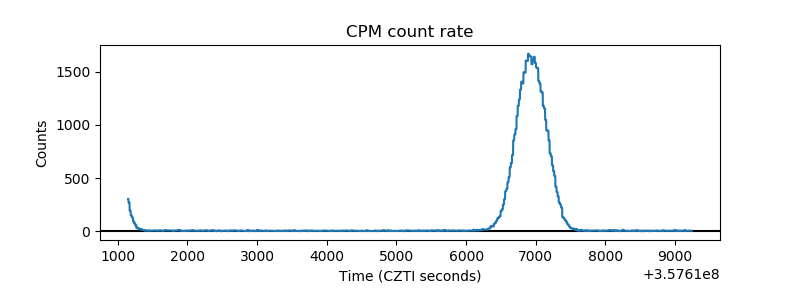 |
| CZT Counter | 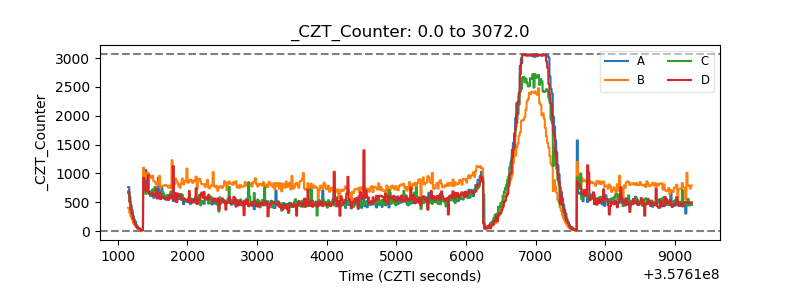 |
| +2.5 Volts monitor |  |
| +5 Volts monitor |  |
| _ROLL_ROT | 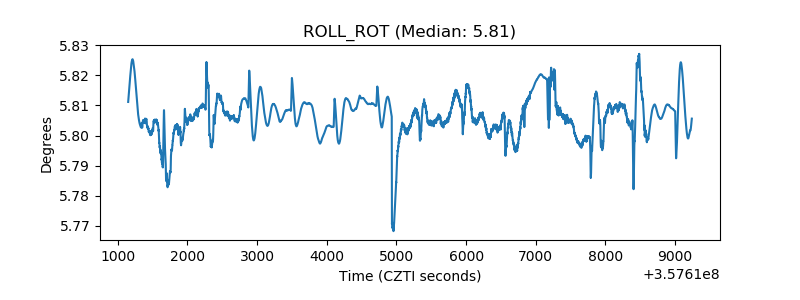 |
| _Roll_DEC | 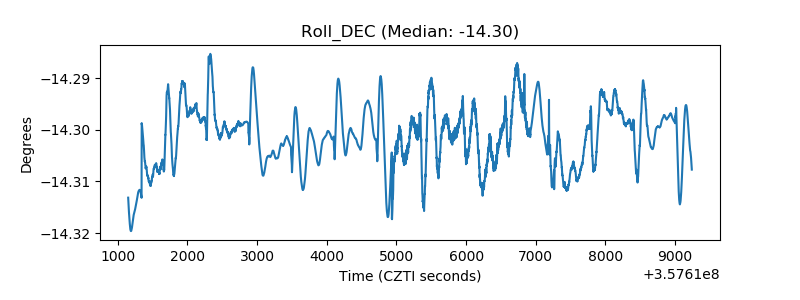 |
| _Roll_RA | 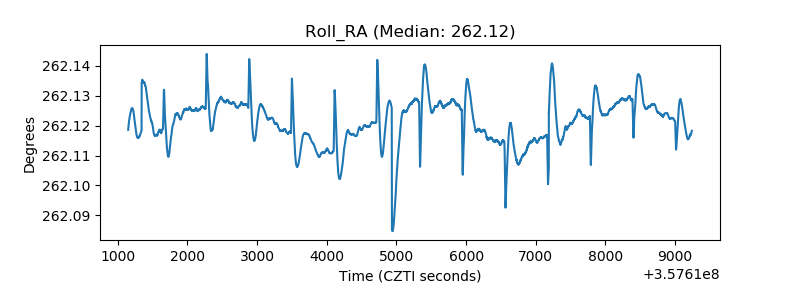 |
| Veto Counter | 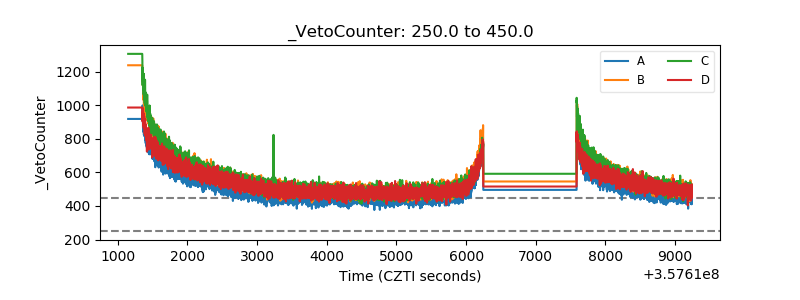 |