| Param | Original file | Final file |
|---|---|---|
| Filename | modeM0/AS1A10_007T01_9000004350_30241cztM0_level2.evt | modeM0/AS1A10_007T01_9000004350_30241cztM0_level2_quad_clean.evt |
| Size (bytes) | 569,237,760 | 100,779,840 |
| Size | 542.9 MB | 96.1 MB |
| Events in quadrant A | 3,666,924 | 640,921 |
| Events in quadrant B | 5,570,203 | 649,067 |
| Events in quadrant C | 3,632,025 | 634,563 |
| Events in quadrant D | 3,878,780 | 622,483 |
| Mode M9 | |||
|---|---|---|---|
| Quadrant | BADHDUFLAG | Total packets | Discarded packets |
| A | 0 | 8 | 0 |
| B | 0 | 8 | 0 |
| C | 0 | 8 | 0 |
| D | 0 | 8 | 0 |
| Mode SS | |||
|---|---|---|---|
| Quadrant | BADHDUFLAG | Total packets | Discarded packets |
| A | 0 | 146 | 0 |
| B | 0 | 146 | 0 |
| C | 0 | 146 | 0 |
| D | 0 | 146 | 0 |
| Mode M0 | |||
|---|---|---|---|
| Quadrant | BADHDUFLAG | Total packets | Discarded packets |
| A | 0 | 15285 | 2 |
| B | 0 | 21936 | 2 |
| C | 0 | 15067 | 2 |
| D | 0 | 15655 | 2 |
| Quadrant | Total seconds | Saturated seconds | Saturation percentage |
|---|---|---|---|
| A | 7257 | 95 | 1.309081% |
| B | 7258 | 125 | 1.722238% |
| C | 7258 | 111 | 1.529347% |
| D | 7258 | 66 | 0.909341% |
Noise dominated data is calculated using 1-second bins in cleaned event files. If a bin has >2000 counts, and if more than 50% of those come from <1% of pixels, then it is considered to be noise-dominated and hence unusable.
| Quadrant | # 1 sec bins | Bins with >0 counts | Bins with >2000 counts | High rate bins dominated by noise | Noise dominated (total time) | Noise dominated (detector-on time) | Marked lightcurve |
|---|---|---|---|---|---|---|---|
| A | 8022 | 7257 | 12 | 12 | 0.15% | 0.17% | 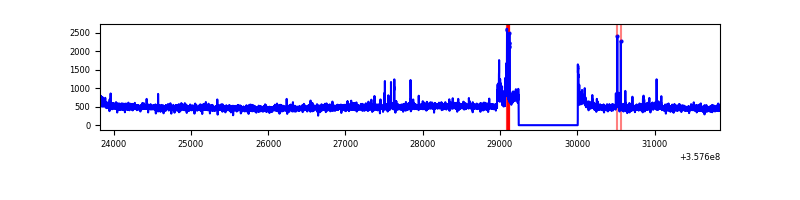 |
| B | 8023 | 7259 | 3 | 3 | 0.04% | 0.04% | 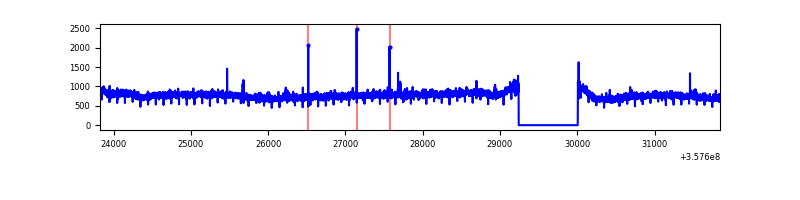 |
| C | 8023 | 7258 | 0 | 0 | 0.00% | 0.00% | 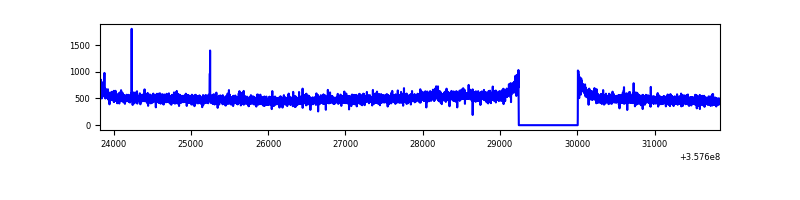 |
| D | 8023 | 7259 | 13 | 13 | 0.16% | 0.18% | 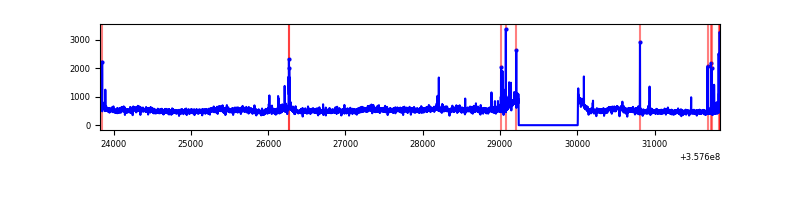 |
Top three noisy pixels from each quadrant. If the there are fewer than three noisy pixels in the level2.evt file, extra rows are filled as -1
| Pixel properties | Quadrant properties | ||||||
|---|---|---|---|---|---|---|---|
| Quadrant | DetID | PixID | Counts | Sigma | Mean | Median | Sigma |
| A | 0 | 13 | 99355 | 538.08 | 911 | 892 | 183.0 |
| A | 14 | 239 | 34641 | 184.43 | 911 | 892 | 183.0 |
| A | 13 | 254 | 13020 | 66.28 | 911 | 892 | 183.0 |
| B | 6 | 159 | 2010827 | 11566.16 | 899 | 876 | 173.8 |
| B | 12 | 111 | 21323 | 117.66 | 899 | 876 | 173.8 |
| B | 11 | 111 | 19822 | 109.02 | 899 | 876 | 173.8 |
| C | 14 | 238 | 140966 | 675.94 | 880 | 887 | 207.2 |
| C | 3 | 233 | 42880 | 202.63 | 880 | 887 | 207.2 |
| C | 2 | 114 | 16817 | 76.87 | 880 | 887 | 207.2 |
| D | 8 | 195 | 384524 | 1781.42 | 890 | 872 | 215.4 |
| D | 2 | 250 | 59511 | 272.28 | 890 | 872 | 215.4 |
| D | 2 | 234 | 28266 | 127.2 | 890 | 872 | 215.4 |
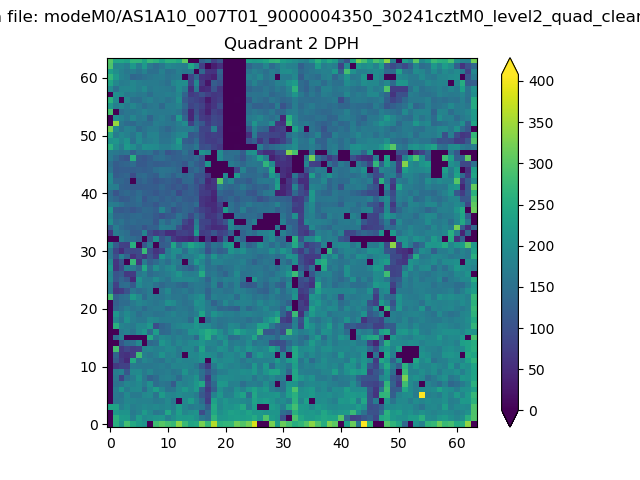
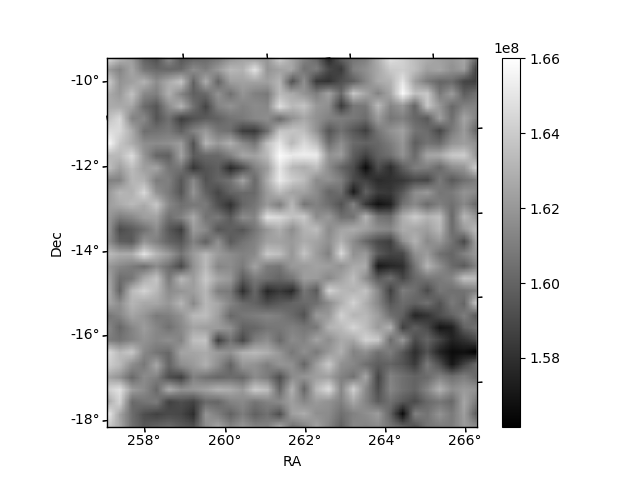
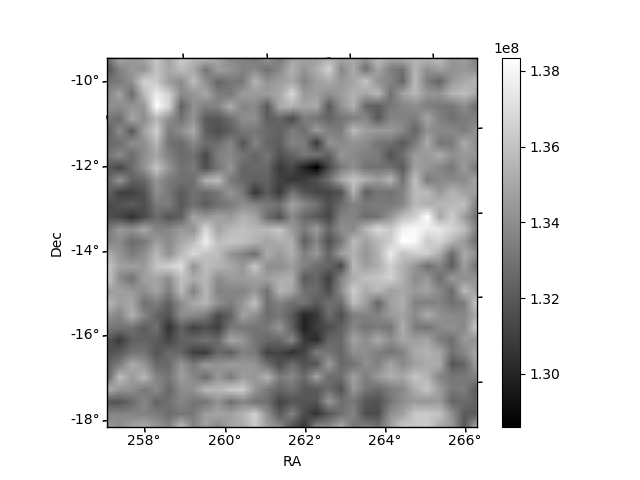
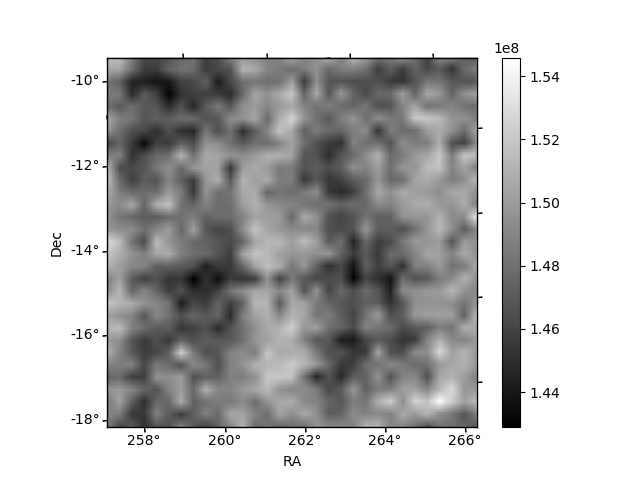
Histogram calculated using DETX and DETY for each event in the final _common_clean file
| Quadrant A | 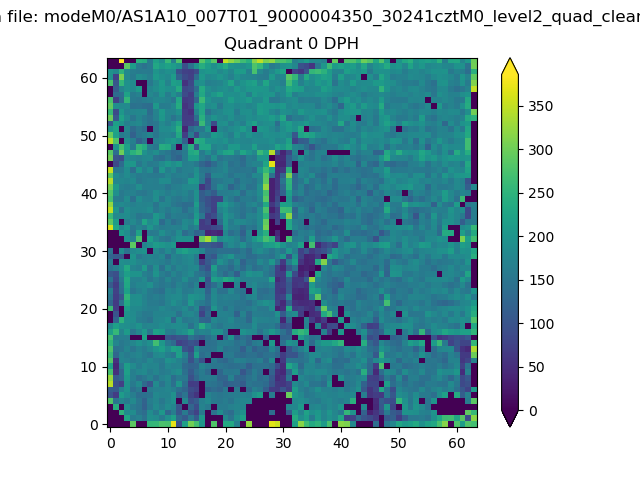 |
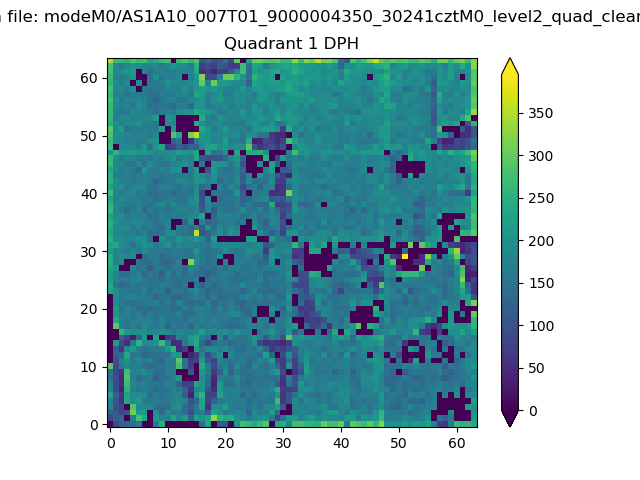 |
Quadrant B |
|---|---|---|---|
| Quadrant D | 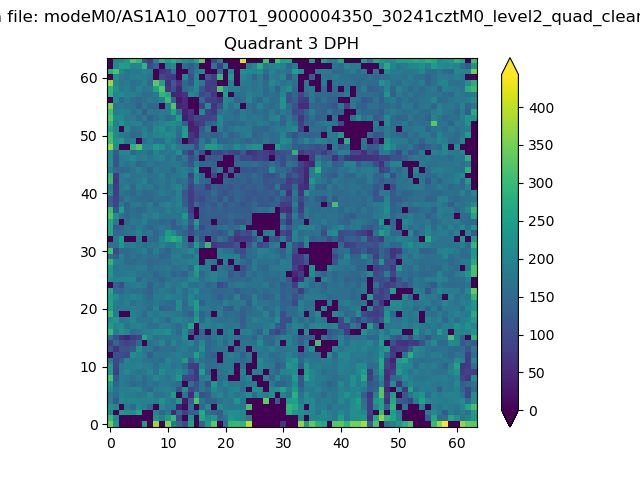 |
 |
Quadrant C |
| Plot type | Count rate plots | Images |
|---|---|---|
| Comparison with Poisson distribution Blue bars denote a histogram of data divided into 1 sec bins. Red curve is a Poisson curve with rate = median count rate of data. |
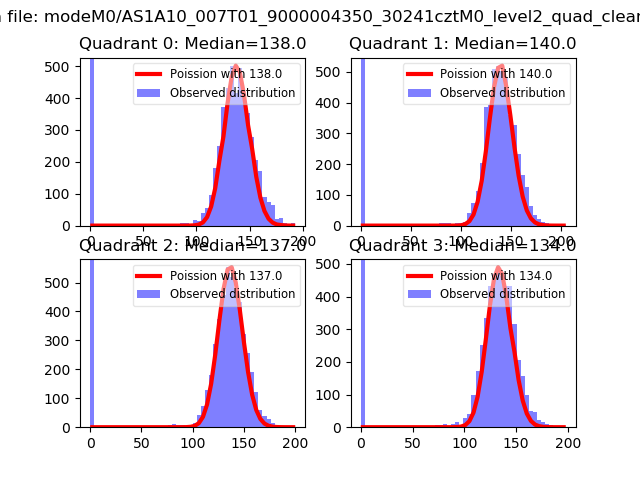 |
 |
| Quadrant-wise count rates Data is divided into 100 sec bins |
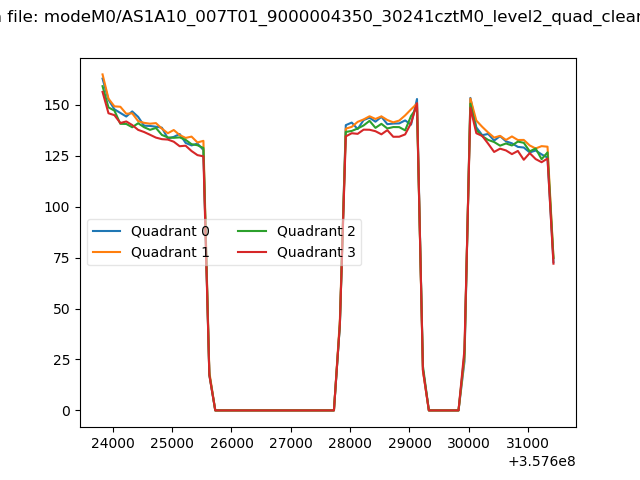 |
|
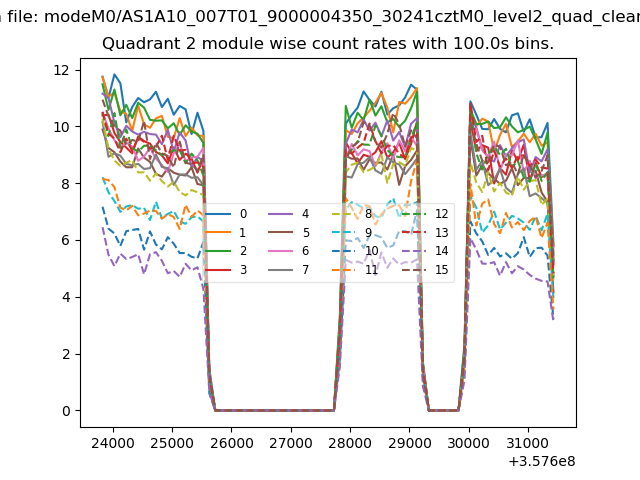
| Module-wise count rates for Quadrant A Data is divided into 100 sec bins |
 |
 |
| Module-wise count rates for Quadrant B Data is divided into 100 sec bins |
 |
 |
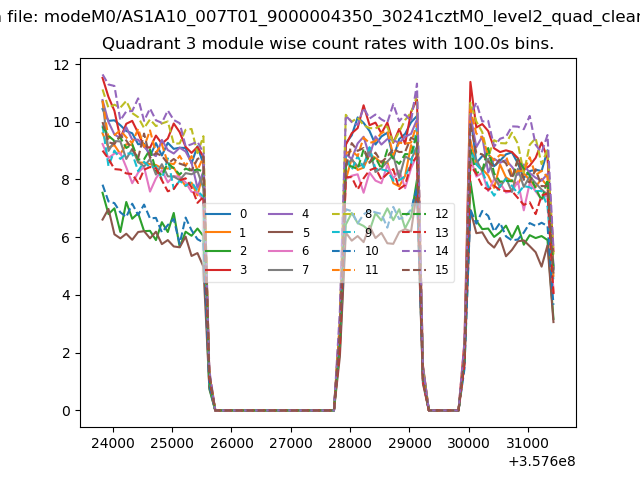
| Module-wise count rates for Quadrant C Data is divided into 100 sec bins |
 |
 |
| Module-wise count rates for Quadrant D Data is divided into 100 sec bins |
 |
 |
| Parameter | Plot |
|---|---|
| CZT HV Monitor | 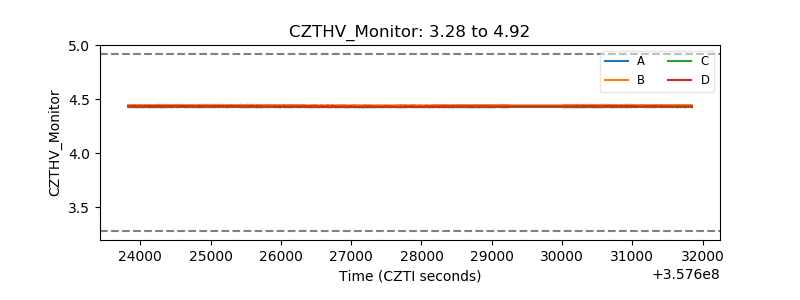 |
| D_VDD | 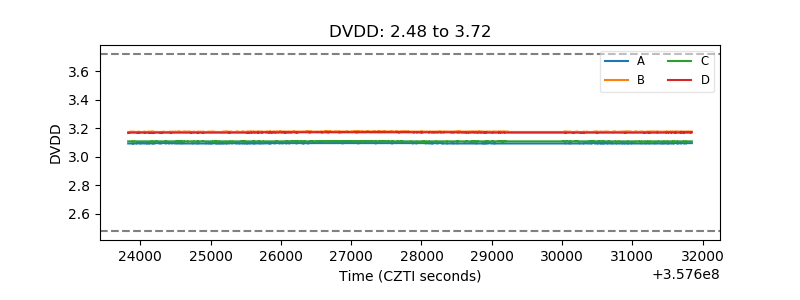 |
| Temperature 1 | 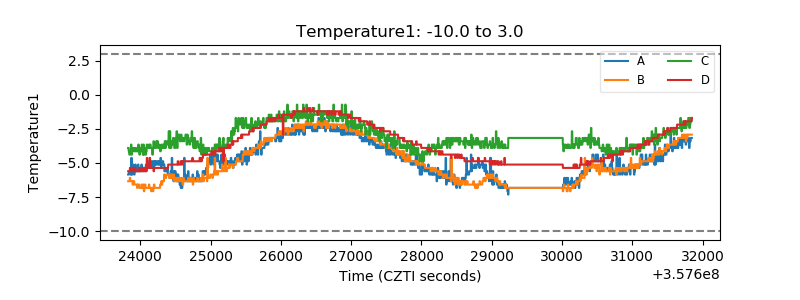 |
| Veto HV Monitor | 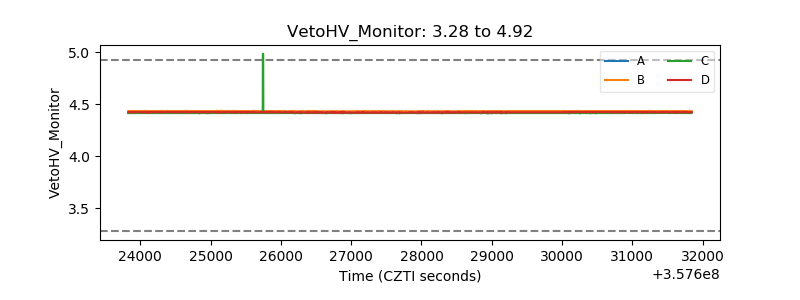 |
| Veto LLD | 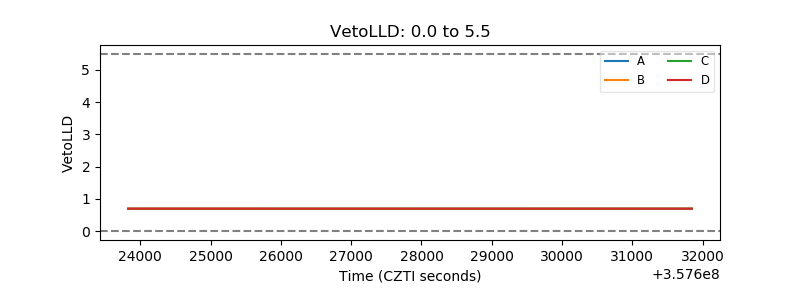 |
| Alpha Counter | 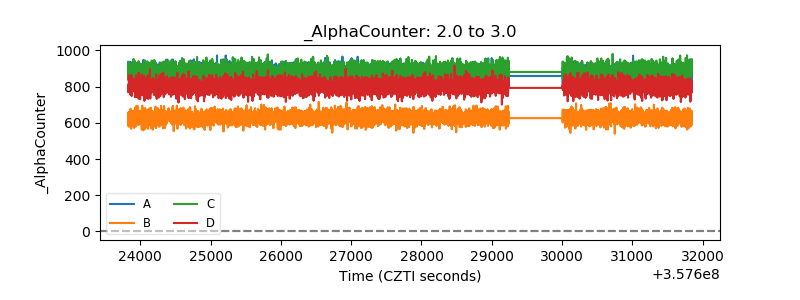 |
| _CPM_Rate | 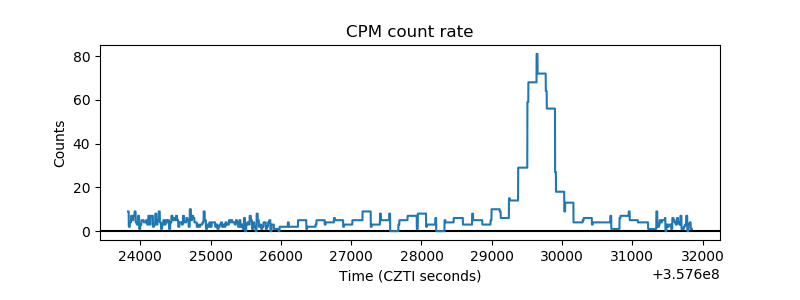 |
| CZT Counter | 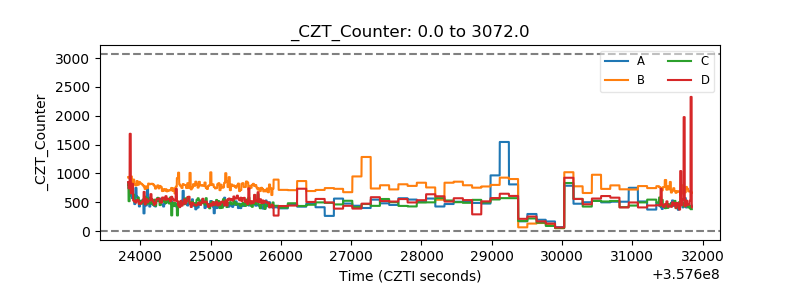 |
| +2.5 Volts monitor |  |
| +5 Volts monitor | 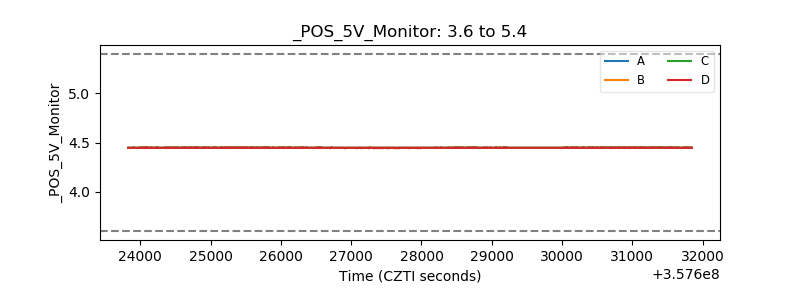 |
| _ROLL_ROT | 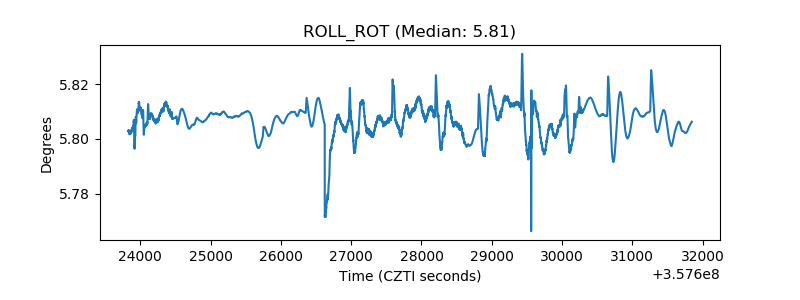 |
| _Roll_DEC | 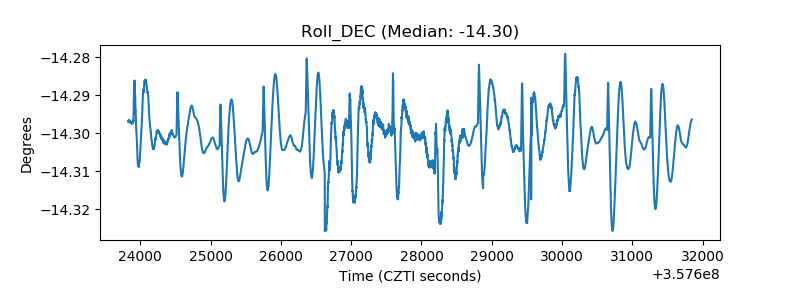 |
| _Roll_RA |  |
| Veto Counter | 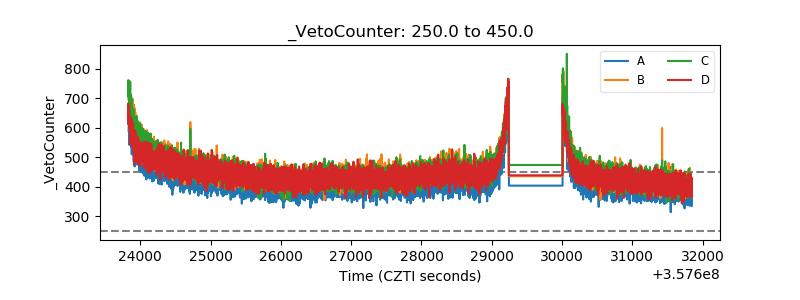 |