| Param | Original file | Final file |
|---|---|---|
| Filename | modeM0/AS1A10_007T01_9000004350_30242cztM0_level2.evt | modeM0/AS1A10_007T01_9000004350_30242cztM0_level2_quad_clean.evt |
| Size (bytes) | 591,359,040 | 93,049,920 |
| Size | 564.0 MB | 88.7 MB |
| Events in quadrant A | 4,047,218 | 574,601 |
| Events in quadrant B | 5,648,731 | 584,310 |
| Events in quadrant C | 3,779,101 | 575,982 |
| Events in quadrant D | 3,931,487 | 566,296 |
| Mode M9 | |||
|---|---|---|---|
| Quadrant | BADHDUFLAG | Total packets | Discarded packets |
| A | 0 | 1 | 0 |
| B | 0 | 1 | 0 |
| C | 0 | 1 | 0 |
| D | 0 | 1 | 0 |
| Mode SS | |||
|---|---|---|---|
| Quadrant | BADHDUFLAG | Total packets | Discarded packets |
| A | 0 | 152 | 0 |
| B | 0 | 152 | 0 |
| C | 0 | 152 | 0 |
| D | 0 | 152 | 0 |
| Mode M0 | |||
|---|---|---|---|
| Quadrant | BADHDUFLAG | Total packets | Discarded packets |
| A | 0 | 16701 | 2 |
| B | 0 | 22444 | 2 |
| C | 0 | 15669 | 2 |
| D | 0 | 16146 | 2 |
| Quadrant | Total seconds | Saturated seconds | Saturation percentage |
|---|---|---|---|
| A | 7414 | 259 | 3.493391% |
| B | 7414 | 272 | 3.668735% |
| C | 7414 | 239 | 3.223631% |
| D | 7414 | 166 | 2.239007% |
Noise dominated data is calculated using 1-second bins in cleaned event files. If a bin has >2000 counts, and if more than 50% of those come from <1% of pixels, then it is considered to be noise-dominated and hence unusable.
| Quadrant | # 1 sec bins | Bins with >0 counts | Bins with >2000 counts | High rate bins dominated by noise | Noise dominated (total time) | Noise dominated (detector-on time) | Marked lightcurve |
|---|---|---|---|---|---|---|---|
| A | 7594 | 7415 | 32 | 32 | 0.42% | 0.43% | 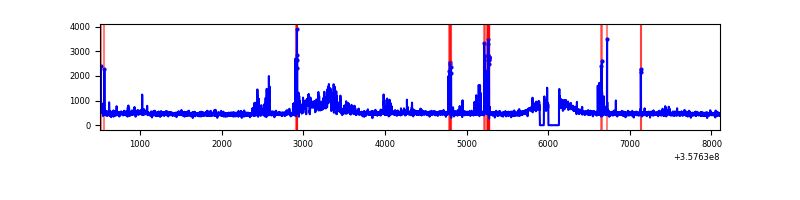 |
| B | 7594 | 7414 | 0 | 0 | 0.00% | 0.00% | 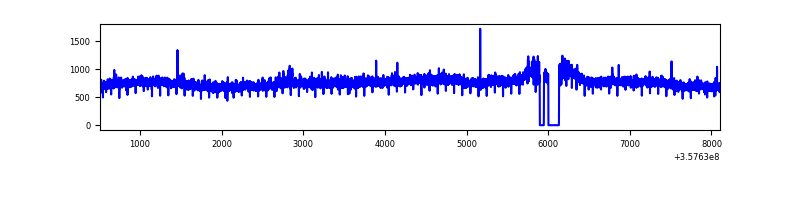 |
| C | 7594 | 7415 | 0 | 0 | 0.00% | 0.00% | 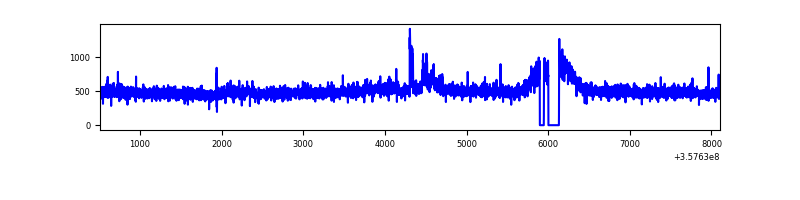 |
| D | 7594 | 7416 | 9 | 9 | 0.12% | 0.12% | 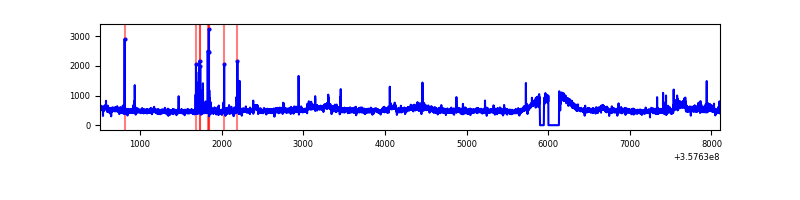 |
Top three noisy pixels from each quadrant. If the there are fewer than three noisy pixels in the level2.evt file, extra rows are filled as -1
| Pixel properties | Quadrant properties | ||||||
|---|---|---|---|---|---|---|---|
| Quadrant | DetID | PixID | Counts | Sigma | Mean | Median | Sigma |
| A | 0 | 13 | 438830 | 2357.6 | 919 | 897 | 185.8 |
| A | 14 | 239 | 37495 | 197.02 | 919 | 897 | 185.8 |
| A | 13 | 254 | 13421 | 67.42 | 919 | 897 | 185.8 |
| B | 6 | 159 | 2061384 | 11603.5 | 907 | 882 | 177.6 |
| B | 12 | 111 | 22217 | 120.15 | 907 | 882 | 177.6 |
| B | 11 | 111 | 20428 | 110.07 | 907 | 882 | 177.6 |
| C | 14 | 238 | 143654 | 670.68 | 893 | 897 | 212.9 |
| C | 3 | 233 | 141168 | 659.0 | 893 | 897 | 212.9 |
| C | 2 | 114 | 17172 | 76.46 | 893 | 897 | 212.9 |
| D | 8 | 195 | 420392 | 1914.47 | 902 | 882 | 219.1 |
| D | 2 | 250 | 36639 | 163.18 | 902 | 882 | 219.1 |
| D | 2 | 234 | 31809 | 141.14 | 902 | 882 | 219.1 |
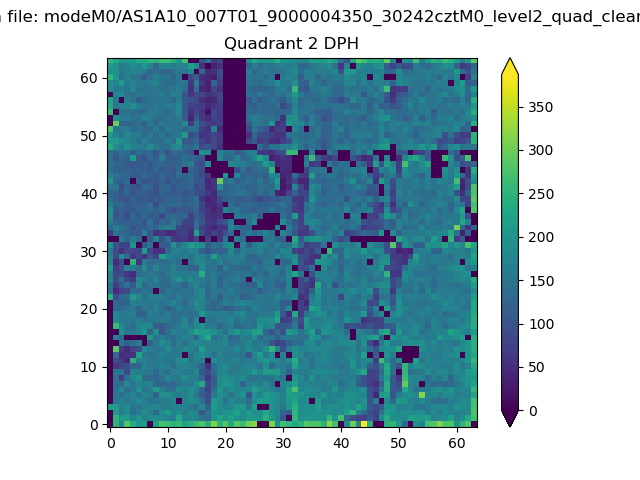
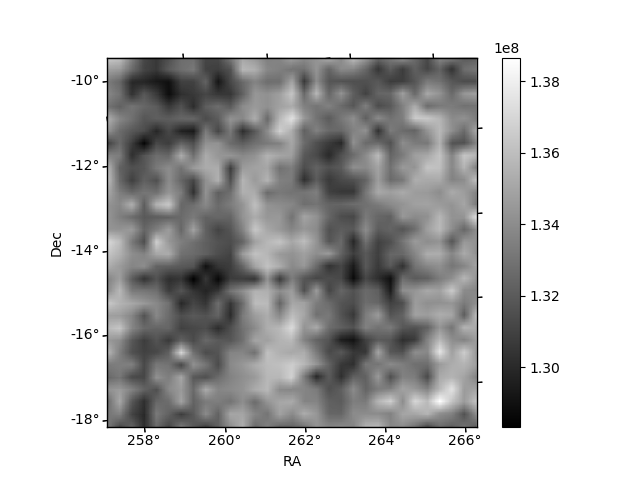
Histogram calculated using DETX and DETY for each event in the final _common_clean file
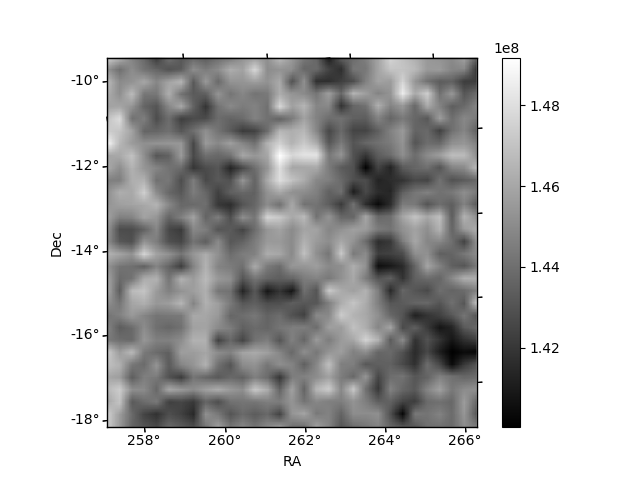
| Quadrant A | 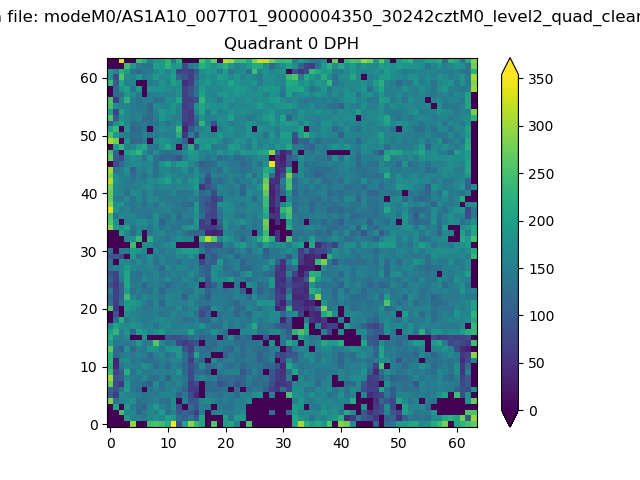 |
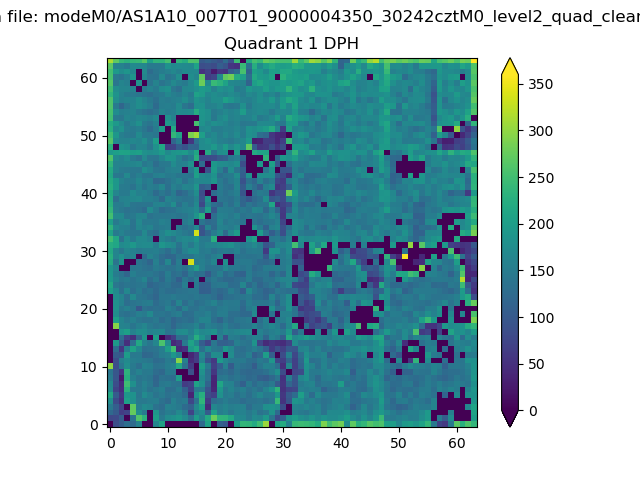 |
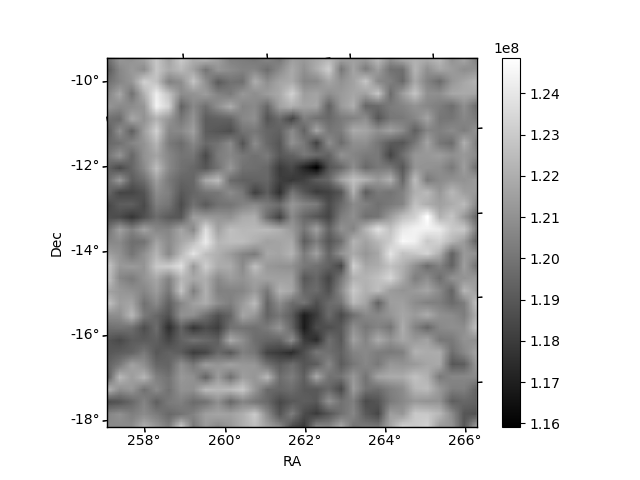
Quadrant B |
|---|---|---|---|
| Quadrant D | 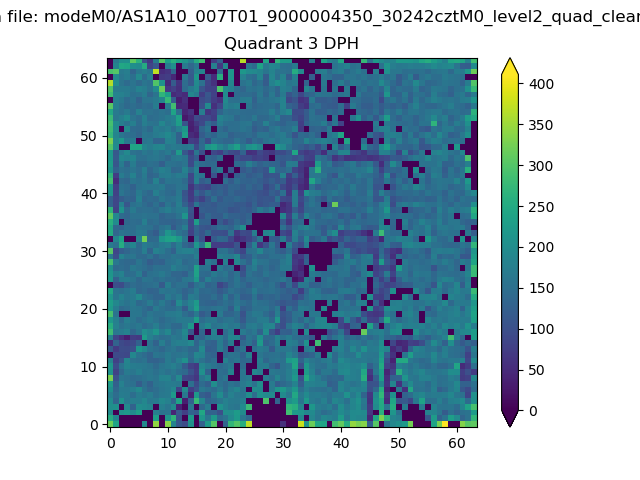 |
 |
Quadrant C |
| Plot type | Count rate plots | Images |
|---|---|---|
| Comparison with Poisson distribution Blue bars denote a histogram of data divided into 1 sec bins. Red curve is a Poisson curve with rate = median count rate of data. |
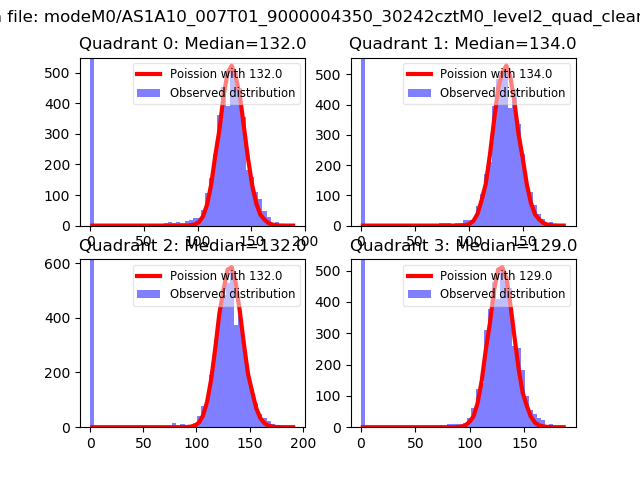 |
 |
| Quadrant-wise count rates Data is divided into 100 sec bins |
 |
|
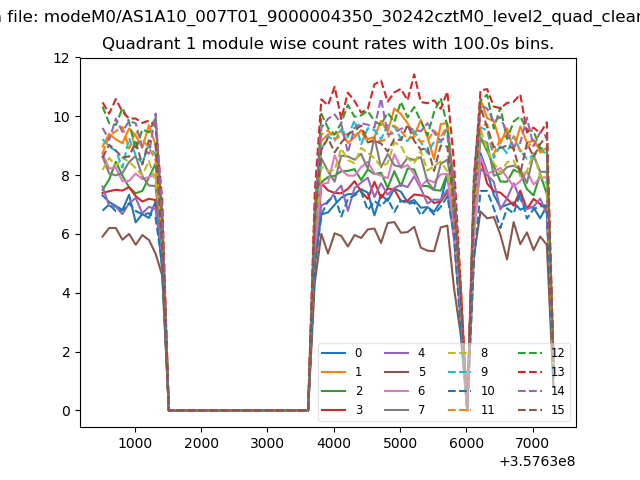
| Module-wise count rates for Quadrant A Data is divided into 100 sec bins |
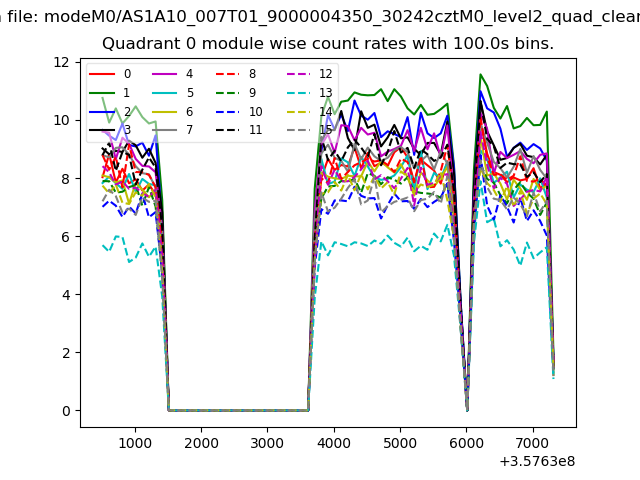 |
 |
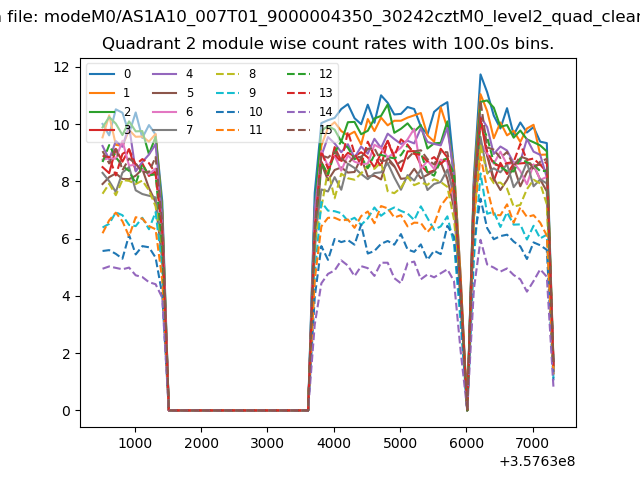
| Module-wise count rates for Quadrant B Data is divided into 100 sec bins |
 |
 |
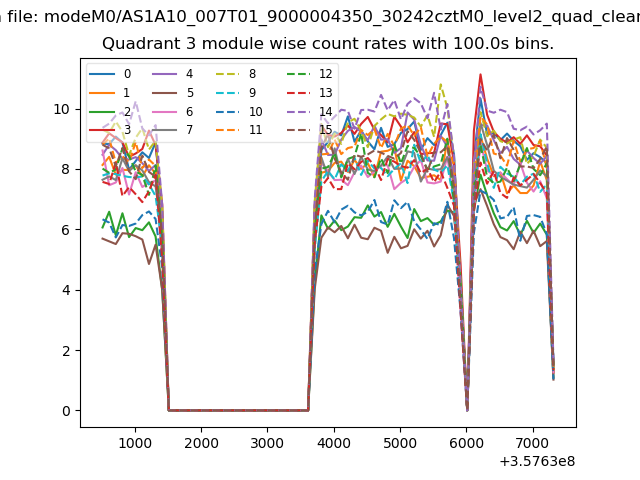
| Module-wise count rates for Quadrant C Data is divided into 100 sec bins |
 |
 |
| Module-wise count rates for Quadrant D Data is divided into 100 sec bins |
 |
 |
| Parameter | Plot |
|---|---|
| CZT HV Monitor | 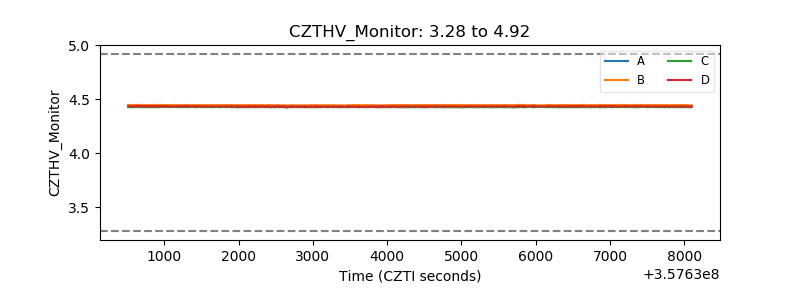 |
| D_VDD | 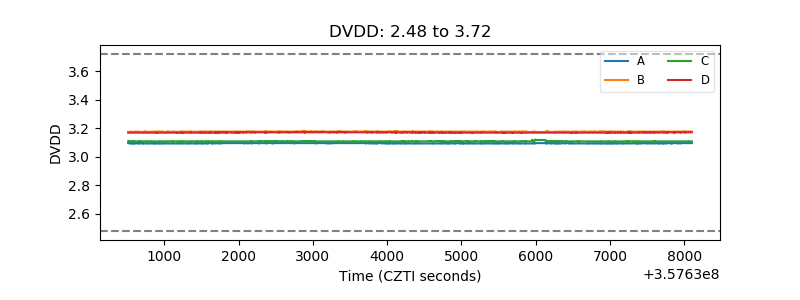 |
| Temperature 1 | 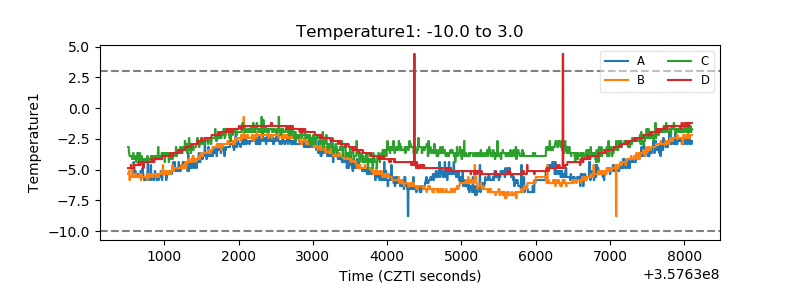 |
| Veto HV Monitor | 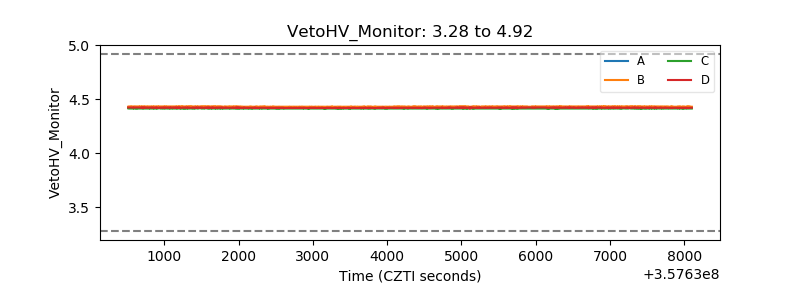 |
| Veto LLD | 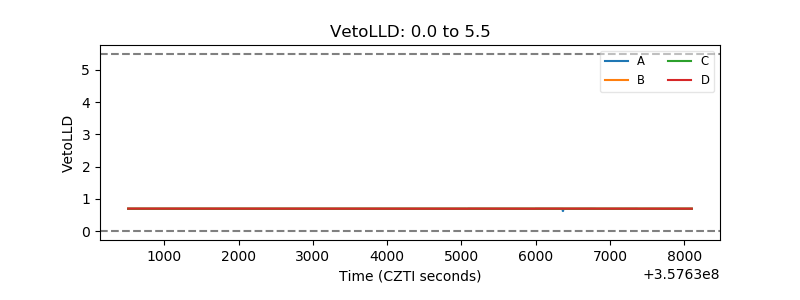 |
| Alpha Counter |  |
| _CPM_Rate | 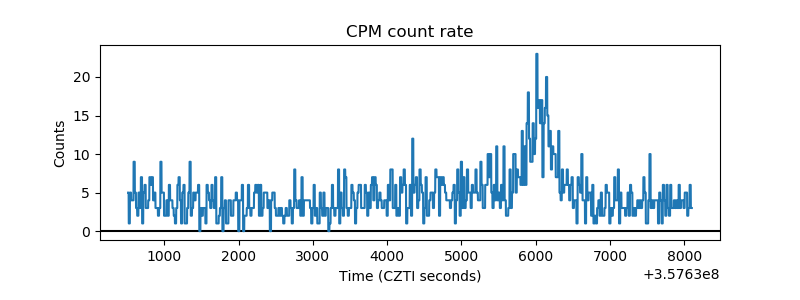 |
| CZT Counter | 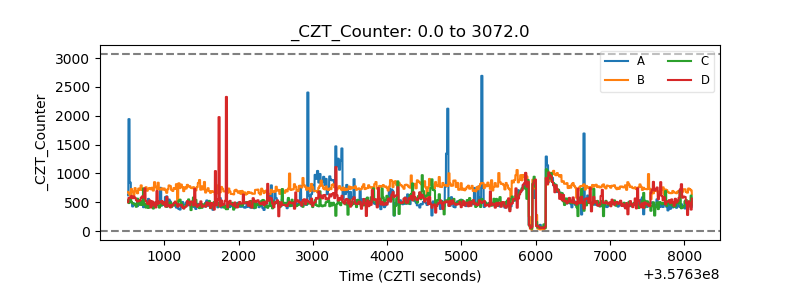 |
| +2.5 Volts monitor |  |
| +5 Volts monitor |  |
| _ROLL_ROT | 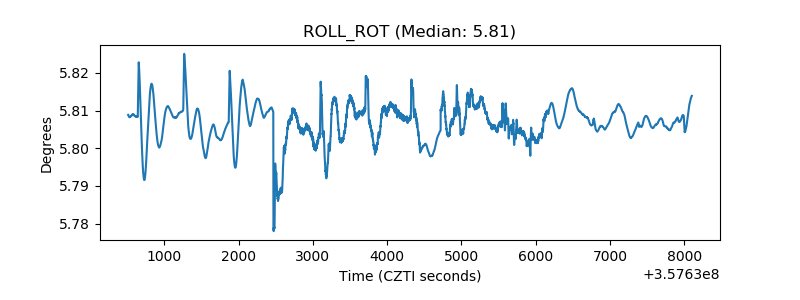 |
| _Roll_DEC | 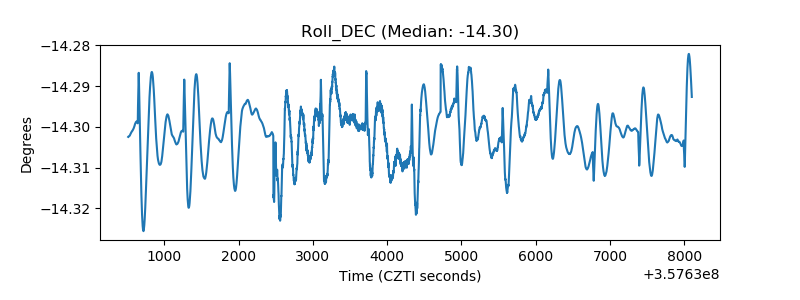 |
| _Roll_RA | 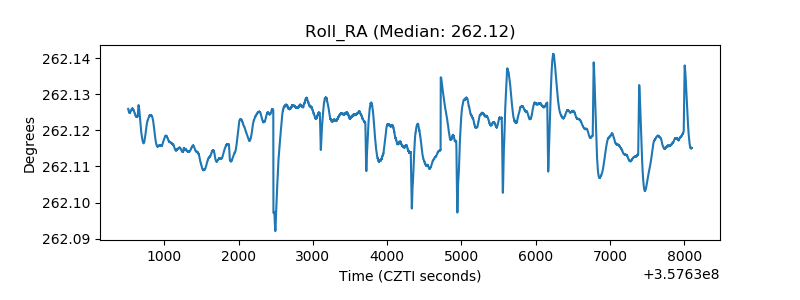 |
| Veto Counter |  |