| Param | Original file | Final file |
|---|---|---|
| Filename | modeM0/AS1A10_007T01_9000004350_30243cztM0_level2.evt | modeM0/AS1A10_007T01_9000004350_30243cztM0_level2_quad_clean.evt |
| Size (bytes) | 604,751,040 | 90,835,200 |
| Size | 576.7 MB | 86.6 MB |
| Events in quadrant A | 3,907,308 | 557,683 |
| Events in quadrant B | 5,802,409 | 562,840 |
| Events in quadrant C | 3,843,477 | 557,078 |
| Events in quadrant D | 4,251,729 | 548,894 |
| Mode SS | |||
|---|---|---|---|
| Quadrant | BADHDUFLAG | Total packets | Discarded packets |
| A | 0 | 150 | 0 |
| B | 0 | 150 | 0 |
| C | 0 | 150 | 0 |
| D | 0 | 150 | 0 |
| Mode M0 | |||
|---|---|---|---|
| Quadrant | BADHDUFLAG | Total packets | Discarded packets |
| A | 0 | 16441 | 0 |
| B | 0 | 23051 | 0 |
| C | 0 | 15868 | 0 |
| D | 0 | 17307 | 0 |
| Quadrant | Total seconds | Saturated seconds | Saturation percentage |
|---|---|---|---|
| A | 7530 | 269 | 3.572377% |
| B | 7531 | 295 | 3.917142% |
| C | 7531 | 220 | 2.921259% |
| D | 7531 | 131 | 1.739477% |
Noise dominated data is calculated using 1-second bins in cleaned event files. If a bin has >2000 counts, and if more than 50% of those come from <1% of pixels, then it is considered to be noise-dominated and hence unusable.
| Quadrant | # 1 sec bins | Bins with >0 counts | Bins with >2000 counts | High rate bins dominated by noise | Noise dominated (total time) | Noise dominated (detector-on time) | Marked lightcurve |
|---|---|---|---|---|---|---|---|
| A | 7530 | 7530 | 59 | 59 | 0.78% | 0.78% | 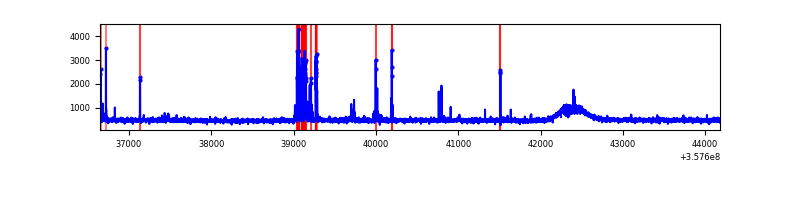 |
| B | 7531 | 7531 | 2 | 2 | 0.03% | 0.03% | 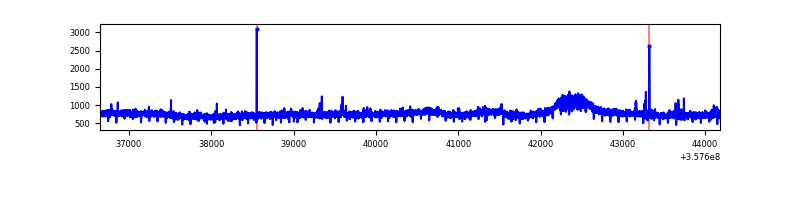 |
| C | 7531 | 7531 | 0 | 0 | 0.00% | 0.00% | 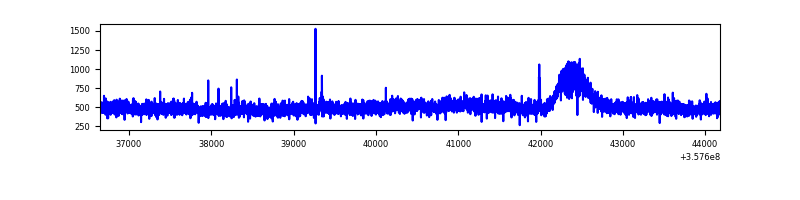 |
| D | 7531 | 7531 | 8 | 8 | 0.11% | 0.11% | 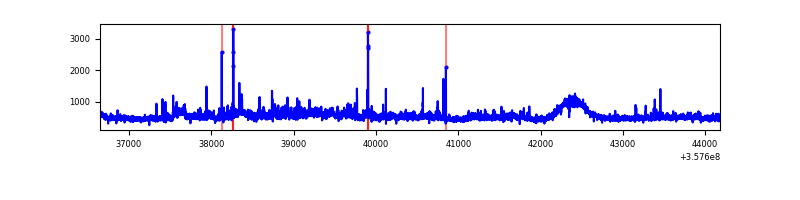 |
Top three noisy pixels from each quadrant. If the there are fewer than three noisy pixels in the level2.evt file, extra rows are filled as -1
| Pixel properties | Quadrant properties | ||||||
|---|---|---|---|---|---|---|---|
| Quadrant | DetID | PixID | Counts | Sigma | Mean | Median | Sigma |
| A | 0 | 13 | 266394 | 1380.54 | 940 | 917 | 192.3 |
| A | 13 | 254 | 14373 | 69.97 | 940 | 917 | 192.3 |
| A | 3 | 137 | 9919 | 46.81 | 940 | 917 | 192.3 |
| B | 6 | 159 | 2129474 | 11655.99 | 925 | 898 | 182.6 |
| B | 12 | 111 | 22614 | 118.92 | 925 | 898 | 182.6 |
| B | 11 | 111 | 20913 | 109.6 | 925 | 898 | 182.6 |
| C | 14 | 238 | 145697 | 669.81 | 912 | 918 | 216.1 |
| C | 3 | 233 | 102056 | 467.91 | 912 | 918 | 216.1 |
| C | 2 | 114 | 17824 | 78.21 | 912 | 918 | 216.1 |
| D | 8 | 195 | 666417 | 2905.71 | 922 | 898 | 229.0 |
| D | 2 | 234 | 34524 | 146.81 | 922 | 898 | 229.0 |
| D | 1 | 52 | 29666 | 125.6 | 922 | 898 | 229.0 |
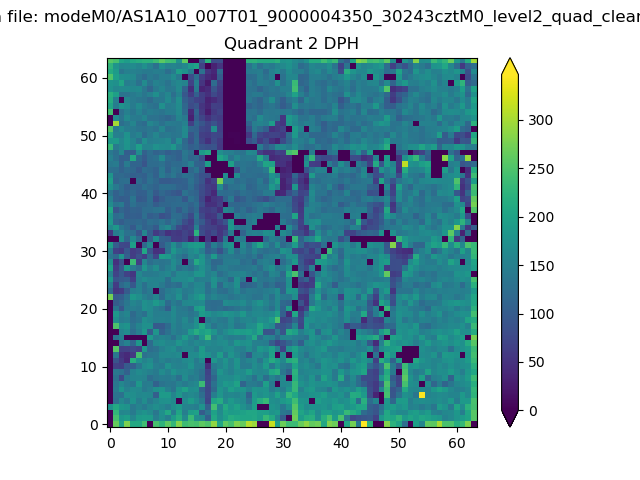
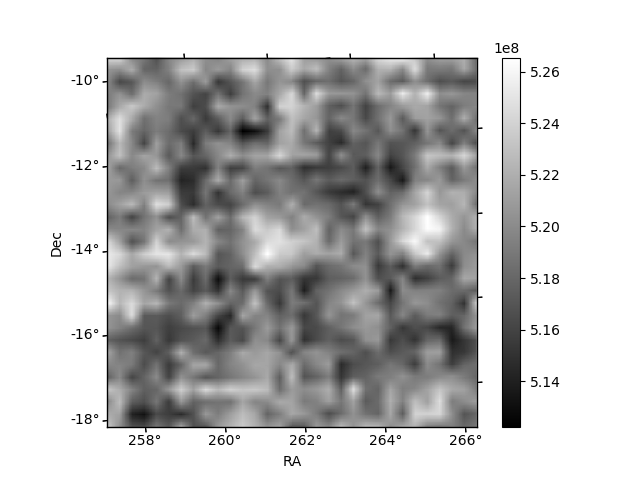
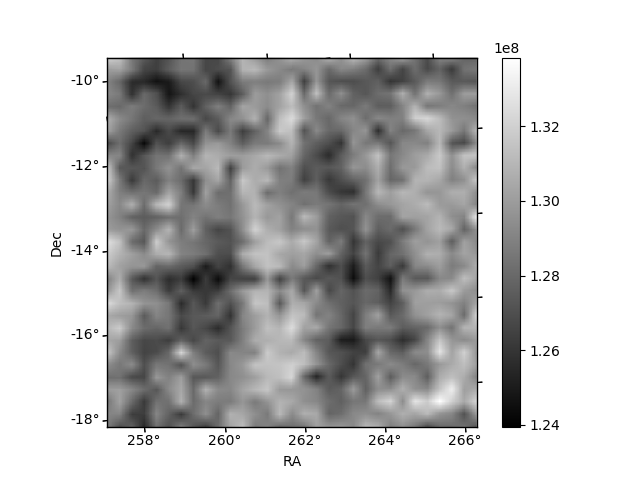
Histogram calculated using DETX and DETY for each event in the final _common_clean file
| Quadrant A | 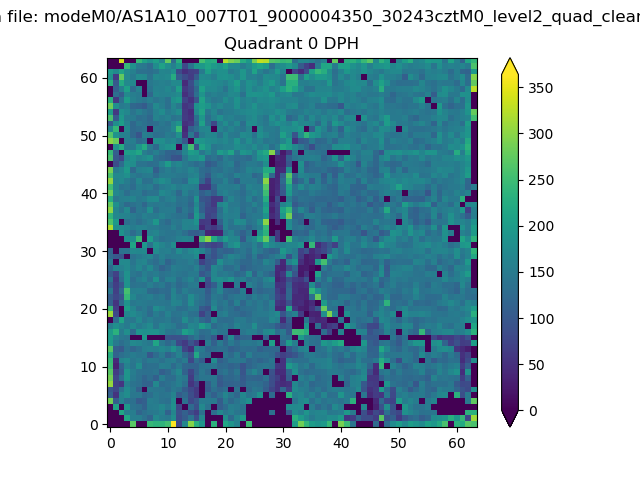 |
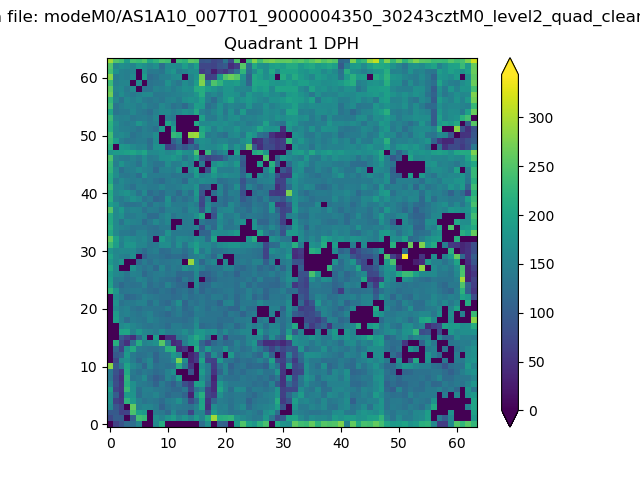 |
Quadrant B |
|---|---|---|---|
| Quadrant D | 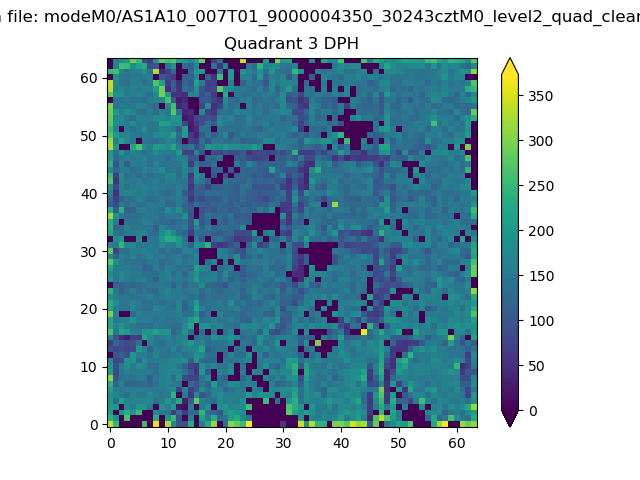 |
 |
Quadrant C |
| Plot type | Count rate plots | Images |
|---|---|---|
| Comparison with Poisson distribution Blue bars denote a histogram of data divided into 1 sec bins. Red curve is a Poisson curve with rate = median count rate of data. |
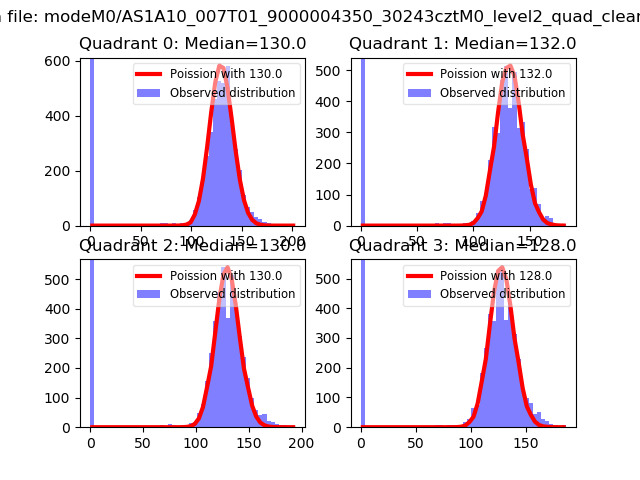 |
 |
| Quadrant-wise count rates Data is divided into 100 sec bins |
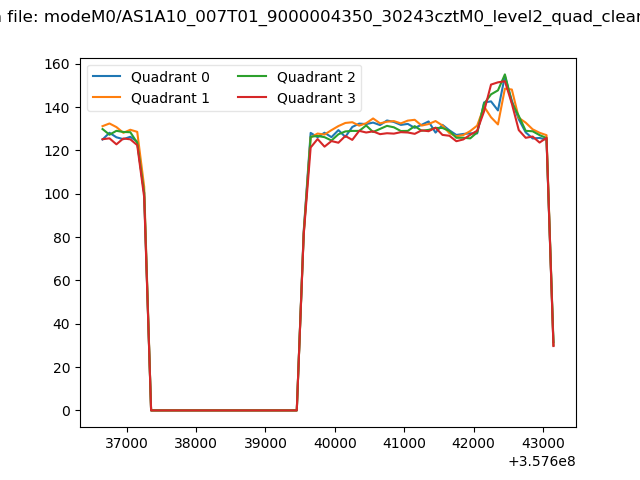 |
|
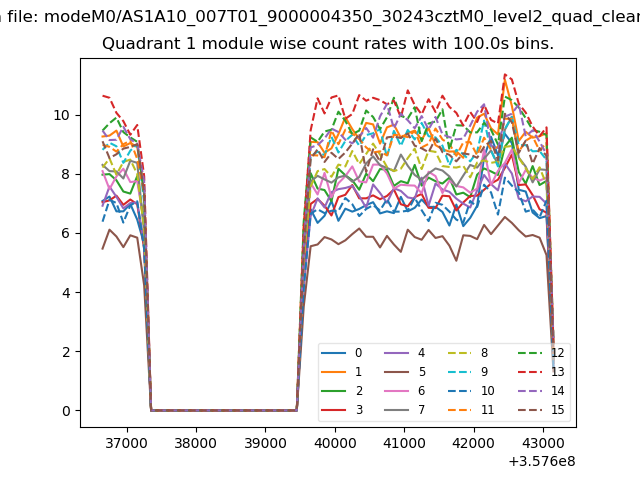
| Module-wise count rates for Quadrant A Data is divided into 100 sec bins |
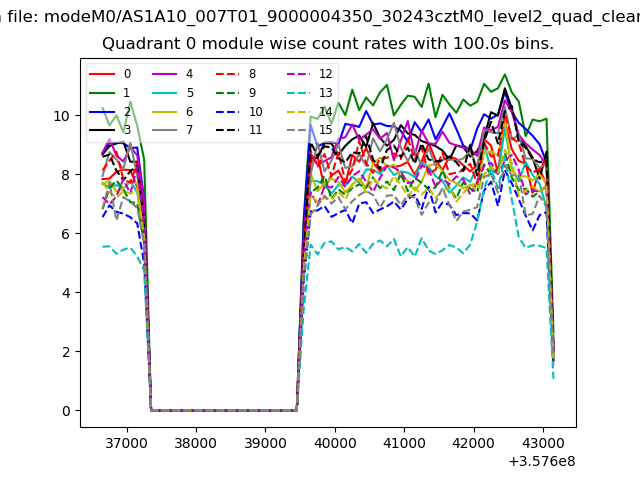 |
 |
| Module-wise count rates for Quadrant B Data is divided into 100 sec bins |
 |
 |
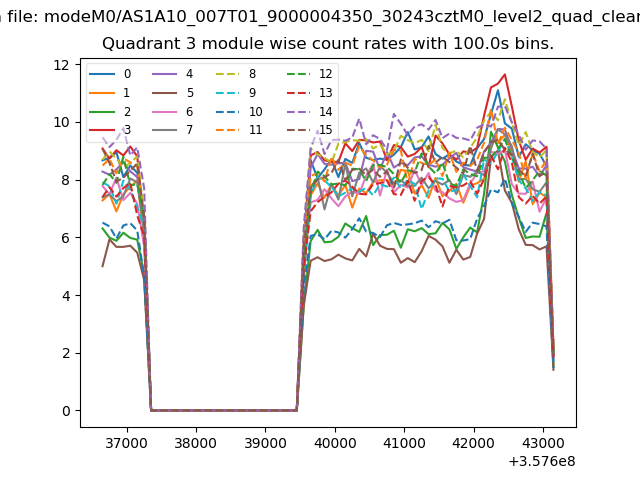
| Module-wise count rates for Quadrant C Data is divided into 100 sec bins |
 |
 |
| Module-wise count rates for Quadrant D Data is divided into 100 sec bins |
 |
 |
| Parameter | Plot |
|---|---|
| CZT HV Monitor |  |
| D_VDD | 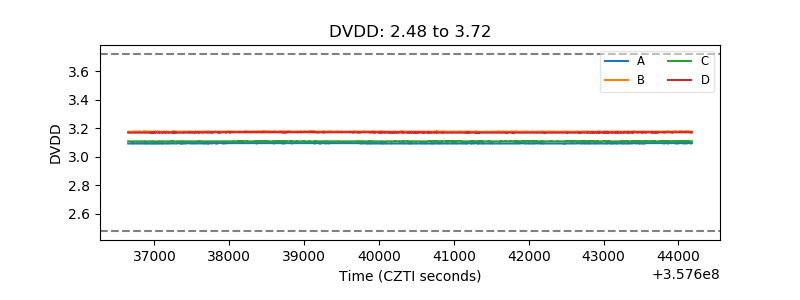 |
| Temperature 1 | 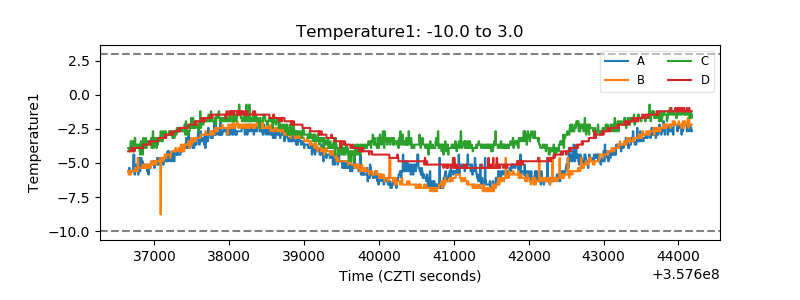 |
| Veto HV Monitor | 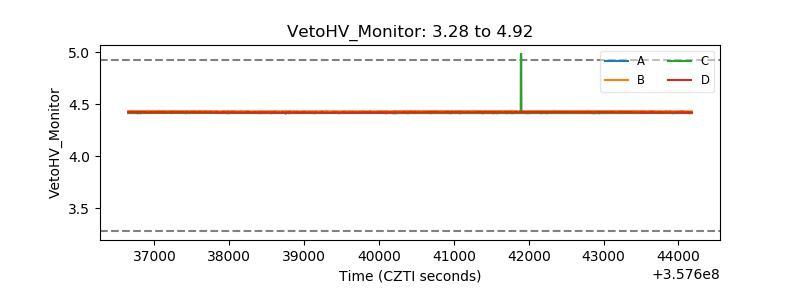 |
| Veto LLD | 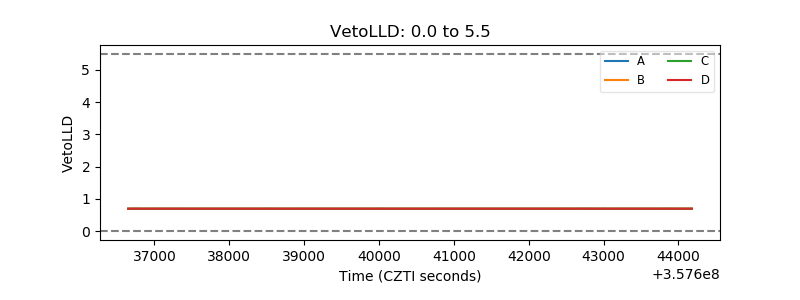 |
| Alpha Counter | 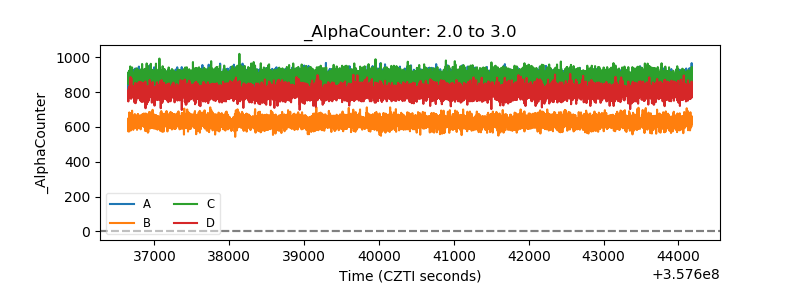 |
| _CPM_Rate | 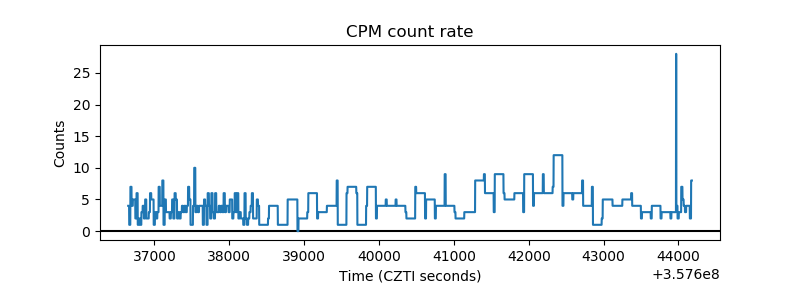 |
| CZT Counter |  |
| +2.5 Volts monitor | 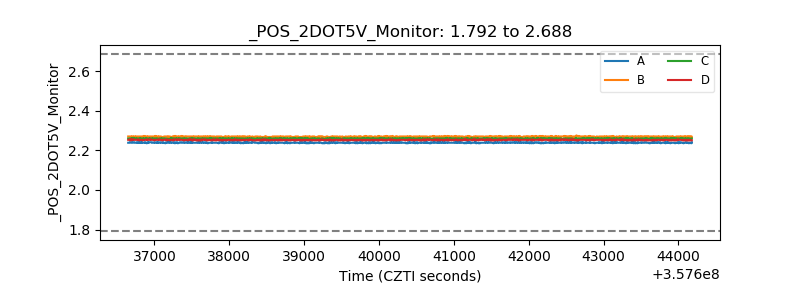 |
| +5 Volts monitor | 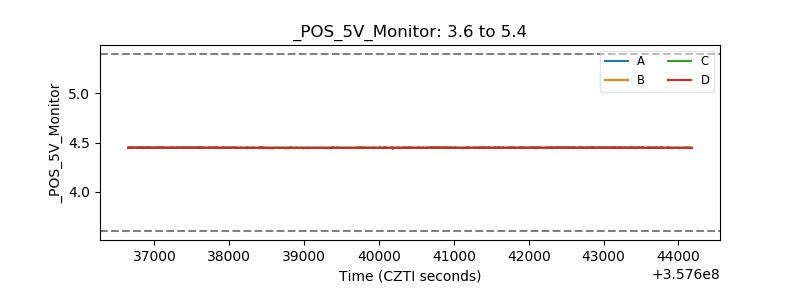 |
| _ROLL_ROT | 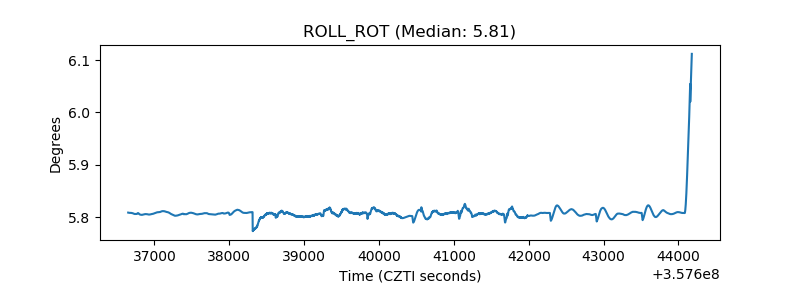 |
| _Roll_DEC | 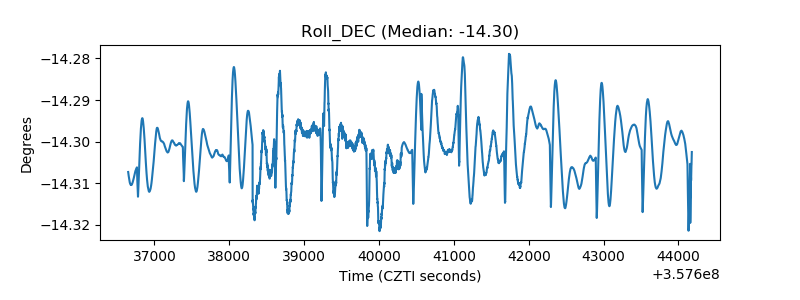 |
| _Roll_RA | 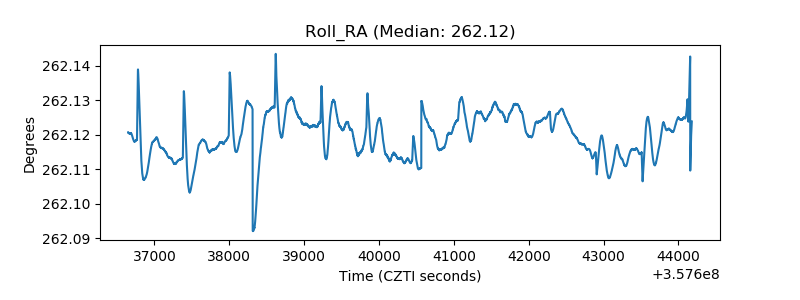 |
| Veto Counter | 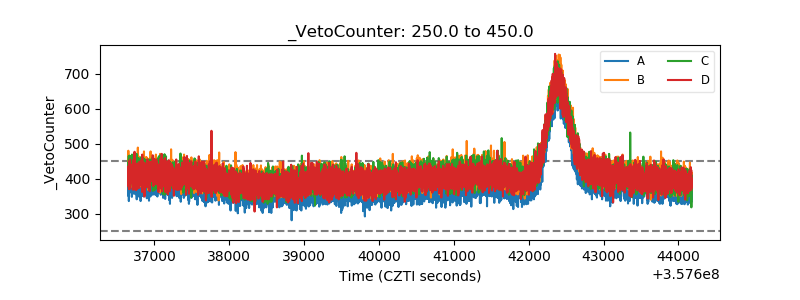 |