| Param | Original file | Final file |
|---|---|---|
| Filename | modeM0/AS1A10_007T01_9000004350_30244cztM0_level2.evt | modeM0/AS1A10_007T01_9000004350_30244cztM0_level2_quad_clean.evt |
| Size (bytes) | 568,391,040 | 81,777,600 |
| Size | 542.1 MB | 78.0 MB |
| Events in quadrant A | 3,550,125 | 492,341 |
| Events in quadrant B | 5,649,129 | 495,213 |
| Events in quadrant C | 3,661,268 | 489,707 |
| Events in quadrant D | 3,851,860 | 484,095 |
| Mode M9 | |||
|---|---|---|---|
| Quadrant | BADHDUFLAG | Total packets | Discarded packets |
| A | 0 | 2 | 0 |
| B | 0 | 2 | 0 |
| C | 0 | 2 | 0 |
| D | 0 | 2 | 0 |
| Mode SS | |||
|---|---|---|---|
| Quadrant | BADHDUFLAG | Total packets | Discarded packets |
| A | 0 | 150 | 0 |
| B | 0 | 150 | 0 |
| C | 0 | 150 | 0 |
| D | 0 | 150 | 0 |
| Mode M0 | |||
|---|---|---|---|
| Quadrant | BADHDUFLAG | Total packets | Discarded packets |
| A | 0 | 15254 | 1 |
| B | 0 | 22474 | 3 |
| C | 0 | 15294 | 1 |
| D | 0 | 15832 | 1 |
| Quadrant | Total seconds | Saturated seconds | Saturation percentage |
|---|---|---|---|
| A | 7397 | 123 | 1.662836% |
| B | 7397 | 191 | 2.582128% |
| C | 7397 | 156 | 2.108963% |
| D | 7397 | 93 | 1.257266% |
Noise dominated data is calculated using 1-second bins in cleaned event files. If a bin has >2000 counts, and if more than 50% of those come from <1% of pixels, then it is considered to be noise-dominated and hence unusable.
| Quadrant | # 1 sec bins | Bins with >0 counts | Bins with >2000 counts | High rate bins dominated by noise | Noise dominated (total time) | Noise dominated (detector-on time) | Marked lightcurve |
|---|---|---|---|---|---|---|---|
| A | 7652 | 7397 | 0 | 0 | 0.00% | 0.00% | 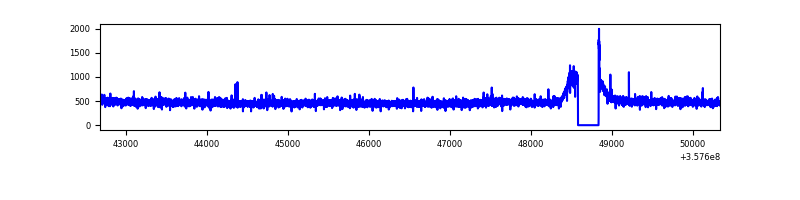 |
| B | 7652 | 7397 | 7 | 7 | 0.09% | 0.09% | 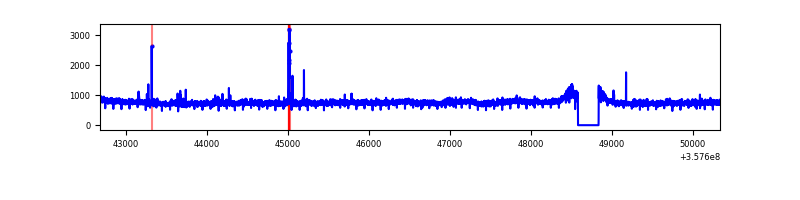 |
| C | 7652 | 7398 | 0 | 0 | 0.00% | 0.00% | 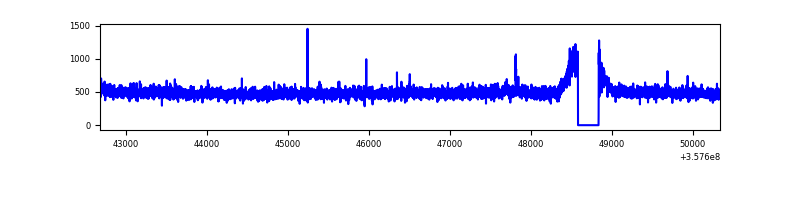 |
| D | 7652 | 7397 | 2 | 2 | 0.03% | 0.03% | 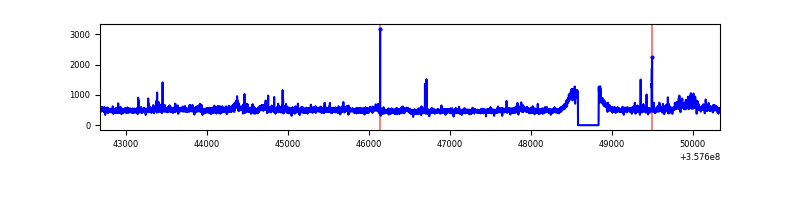 |
Top three noisy pixels from each quadrant. If the there are fewer than three noisy pixels in the level2.evt file, extra rows are filled as -1
| Pixel properties | Quadrant properties | ||||||
|---|---|---|---|---|---|---|---|
| Quadrant | DetID | PixID | Counts | Sigma | Mean | Median | Sigma |
| A | 13 | 254 | 14557 | 73.5 | 915 | 896 | 185.9 |
| A | 8 | 192 | 11315 | 56.06 | 915 | 896 | 185.9 |
| A | 3 | 137 | 9648 | 47.09 | 915 | 896 | 185.9 |
| B | 6 | 159 | 2060335 | 11744.19 | 897 | 873 | 175.4 |
| B | 5 | 172 | 26386 | 145.49 | 897 | 873 | 175.4 |
| B | 0 | 229 | 23224 | 127.46 | 897 | 873 | 175.4 |
| C | 14 | 238 | 143643 | 684.2 | 880 | 885 | 208.7 |
| C | 3 | 233 | 54683 | 257.84 | 880 | 885 | 208.7 |
| C | 2 | 114 | 17792 | 81.03 | 880 | 885 | 208.7 |
| D | 8 | 195 | 315471 | 1419.28 | 890 | 870 | 221.7 |
| D | 1 | 52 | 96847 | 432.99 | 890 | 870 | 221.7 |
| D | 2 | 234 | 35766 | 157.43 | 890 | 870 | 221.7 |
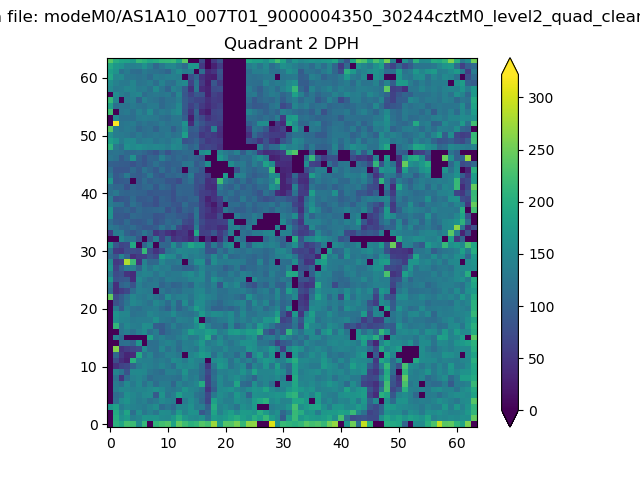
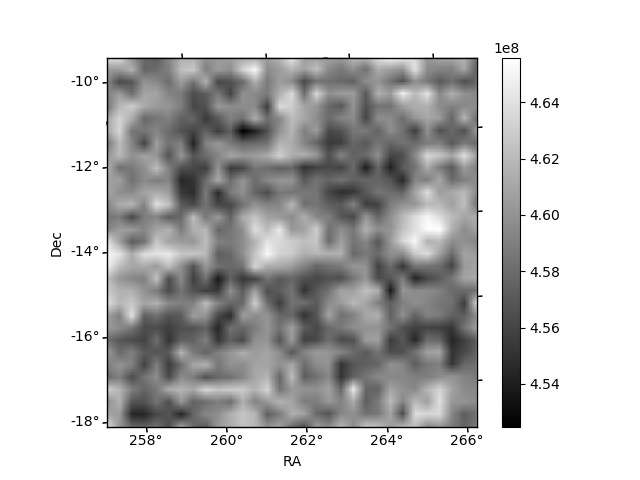
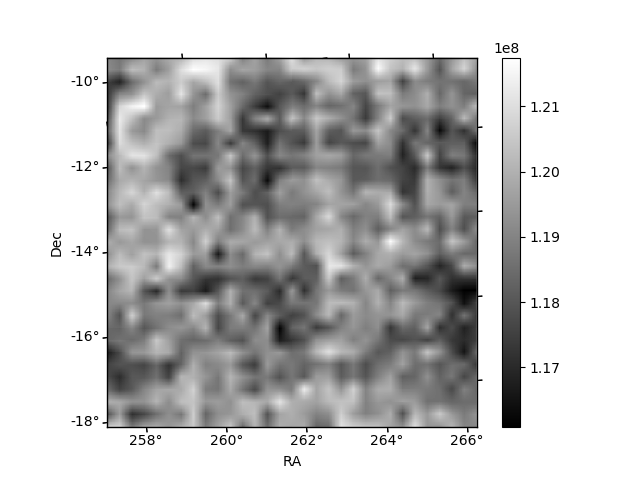
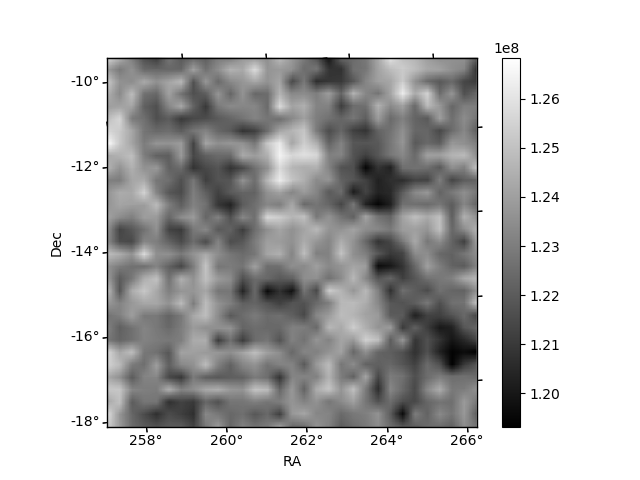
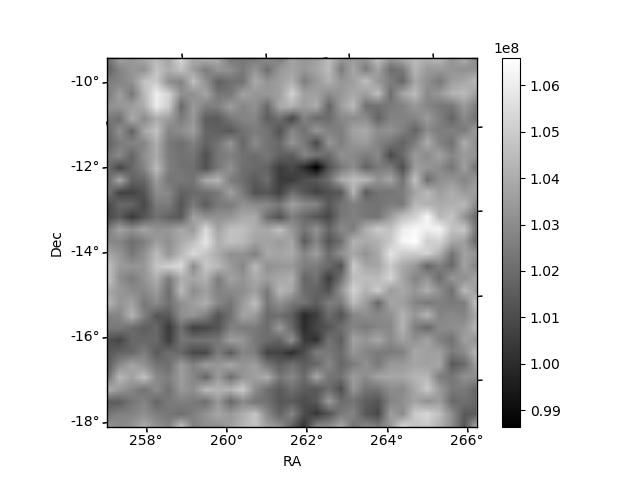
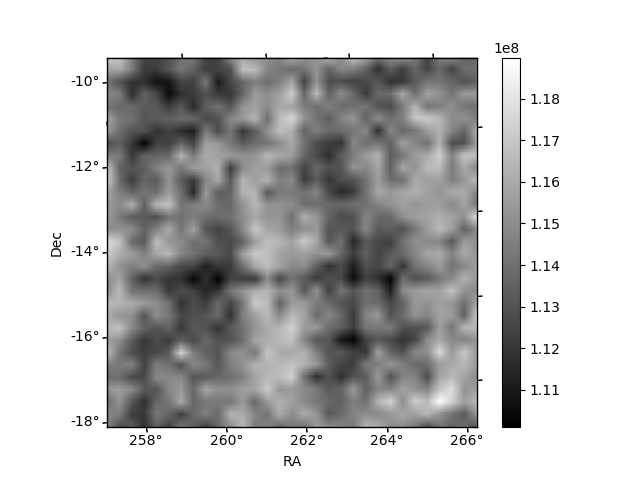
Histogram calculated using DETX and DETY for each event in the final _common_clean file
| Quadrant A | 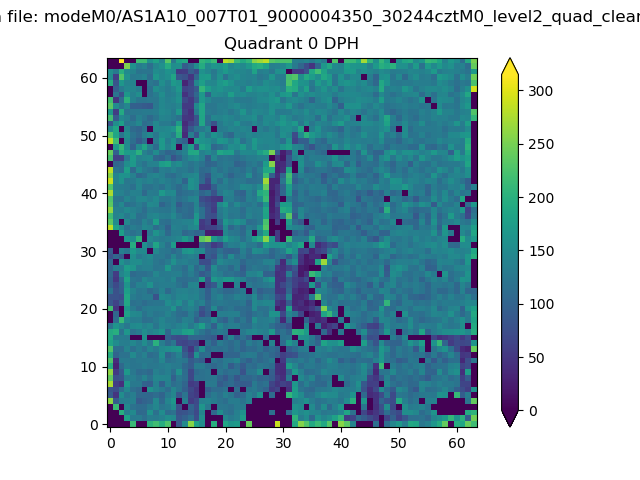 |
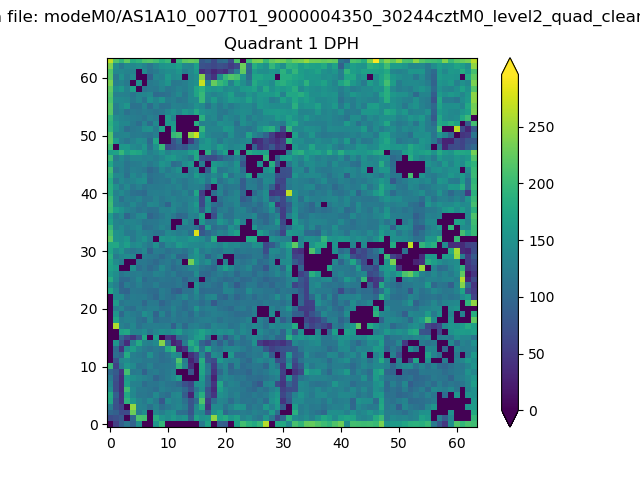 |
Quadrant B |
|---|---|---|---|
| Quadrant D | 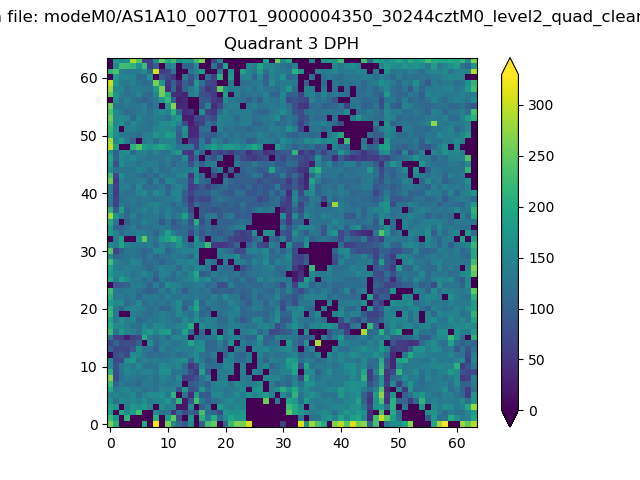 |
 |
Quadrant C |
| Plot type | Count rate plots | Images |
|---|---|---|
| Comparison with Poisson distribution Blue bars denote a histogram of data divided into 1 sec bins. Red curve is a Poisson curve with rate = median count rate of data. |
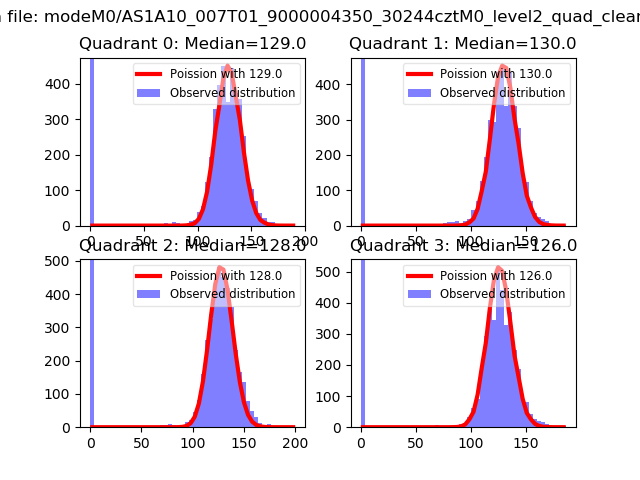 |
 |
| Quadrant-wise count rates Data is divided into 100 sec bins |
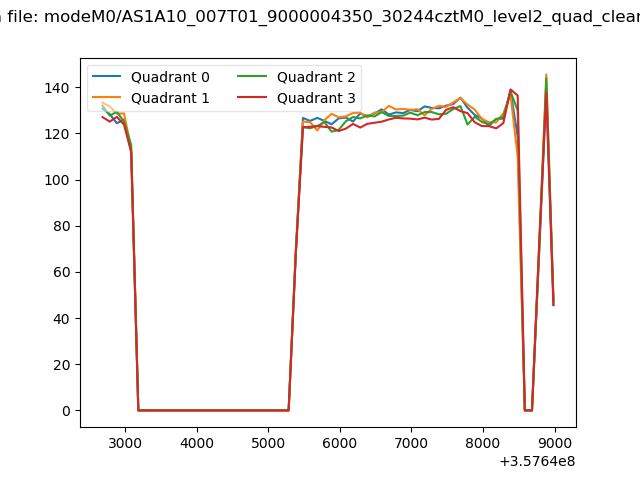 |
|
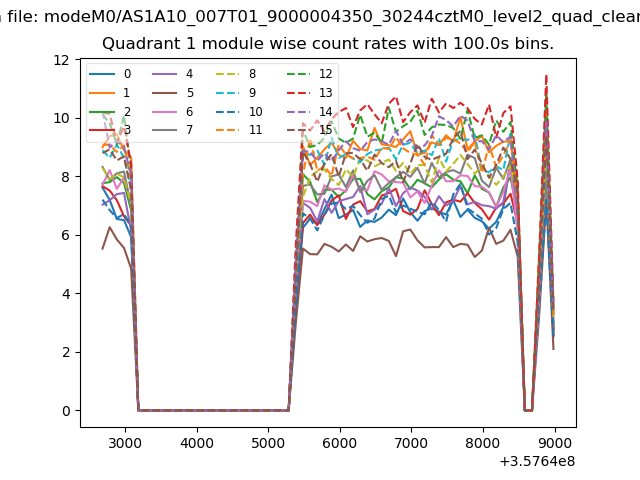
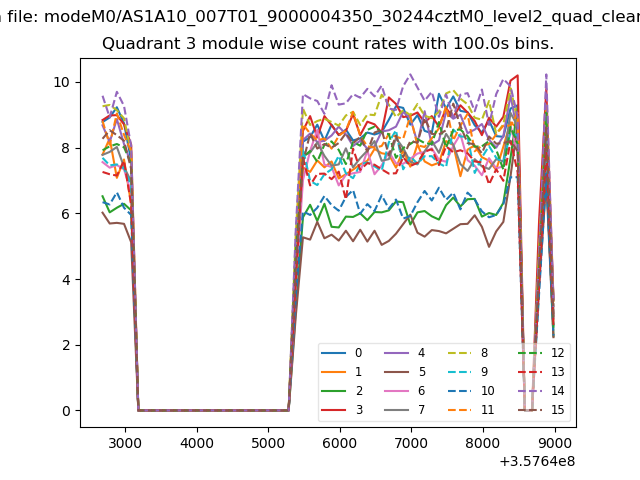
| Module-wise count rates for Quadrant A Data is divided into 100 sec bins |
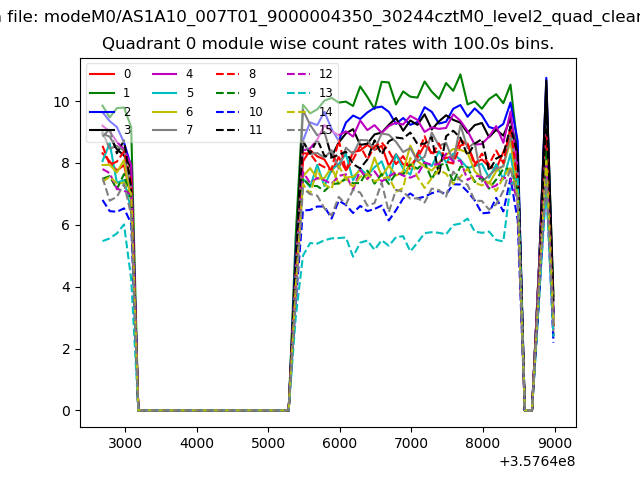 |
 |
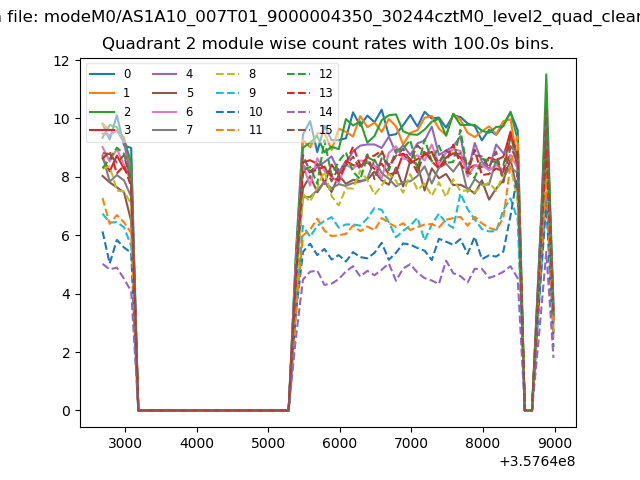
| Module-wise count rates for Quadrant B Data is divided into 100 sec bins |
 |
 |
| Module-wise count rates for Quadrant C Data is divided into 100 sec bins |
 |
 |
| Module-wise count rates for Quadrant D Data is divided into 100 sec bins |
 |
 |
| Parameter | Plot |
|---|---|
| CZT HV Monitor | 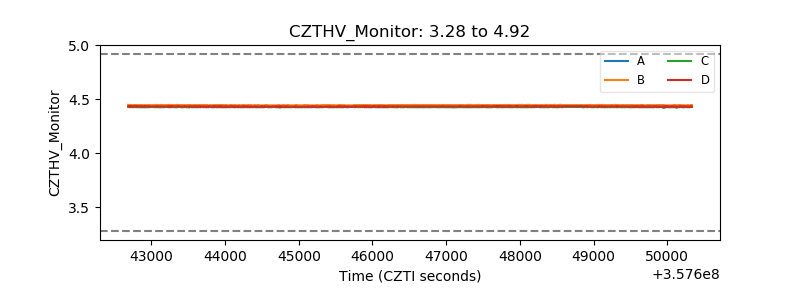 |
| D_VDD | 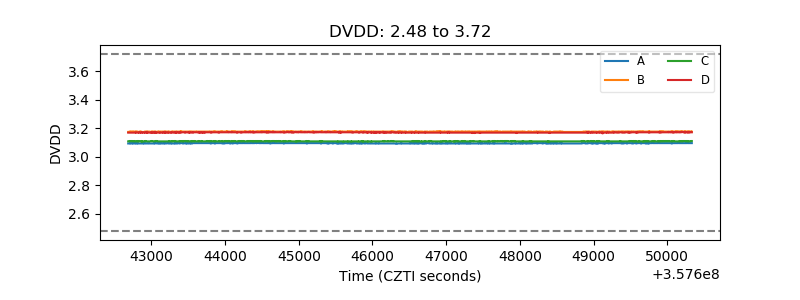 |
| Temperature 1 | 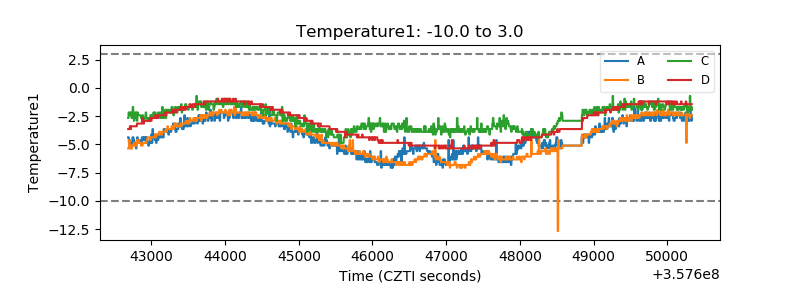 |
| Veto HV Monitor | 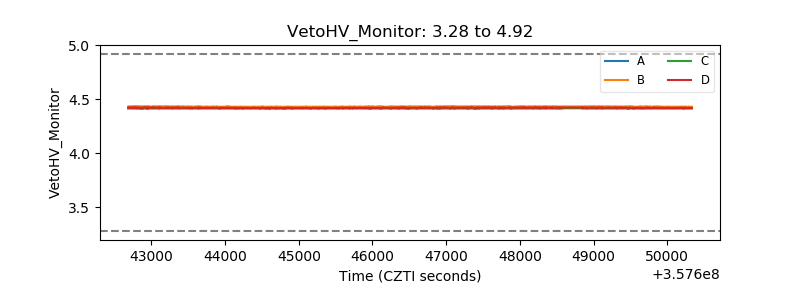 |
| Veto LLD | 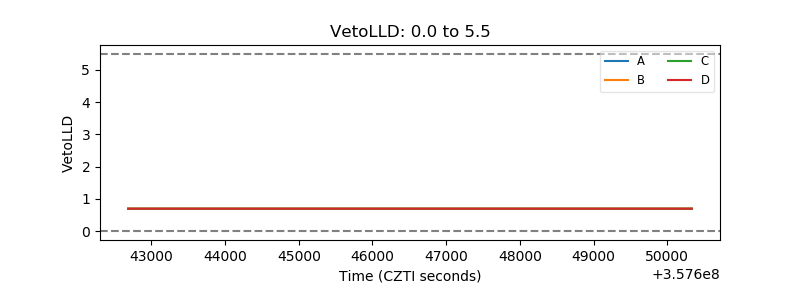 |
| Alpha Counter | 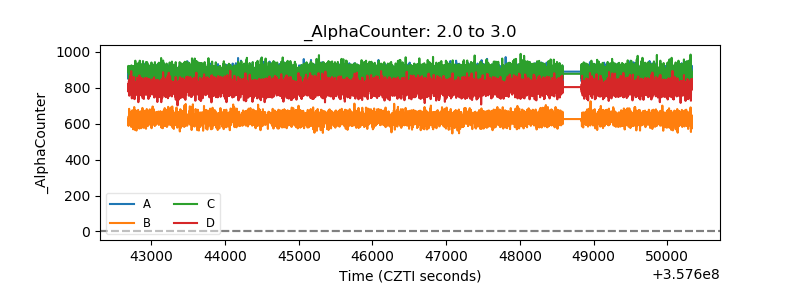 |
| _CPM_Rate | 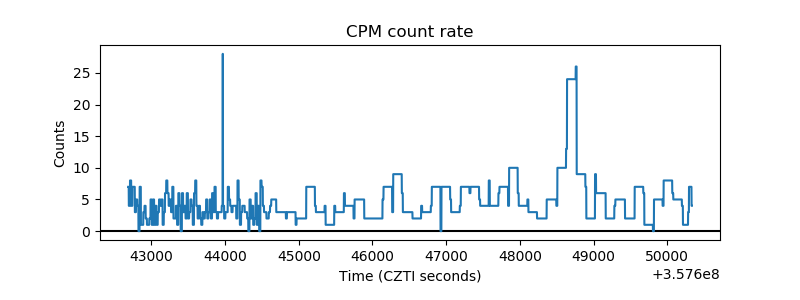 |
| CZT Counter | 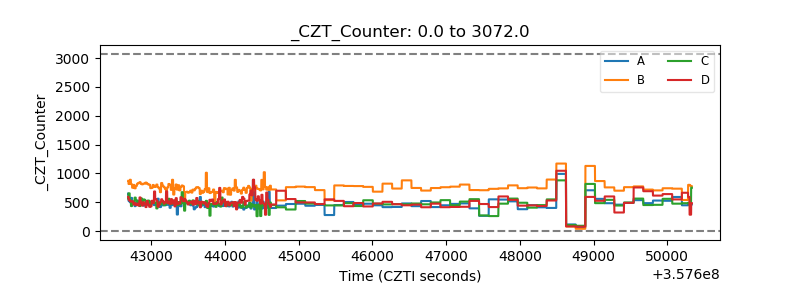 |
| +2.5 Volts monitor |  |
| +5 Volts monitor | 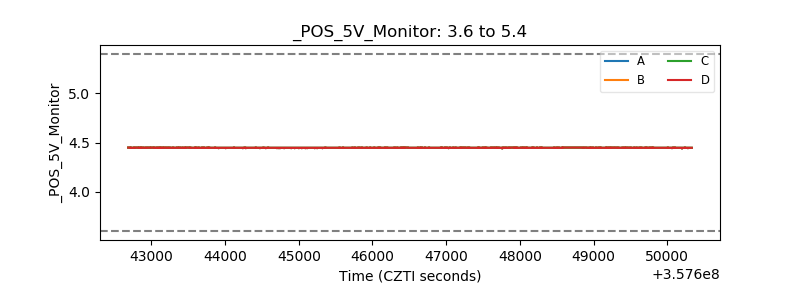 |
| _ROLL_ROT | 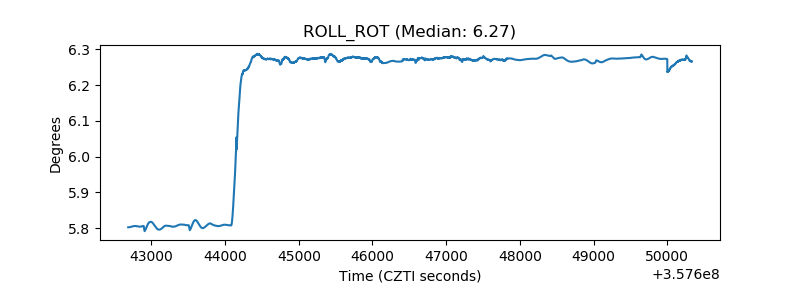 |
| _Roll_DEC | 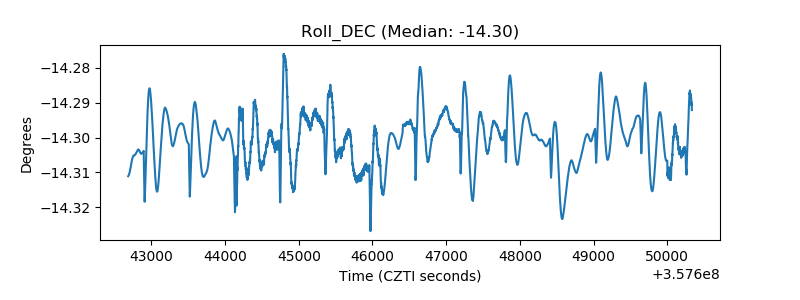 |
| _Roll_RA | 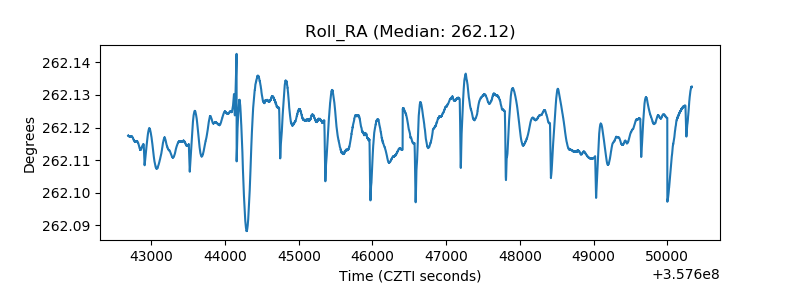 |
| Veto Counter | 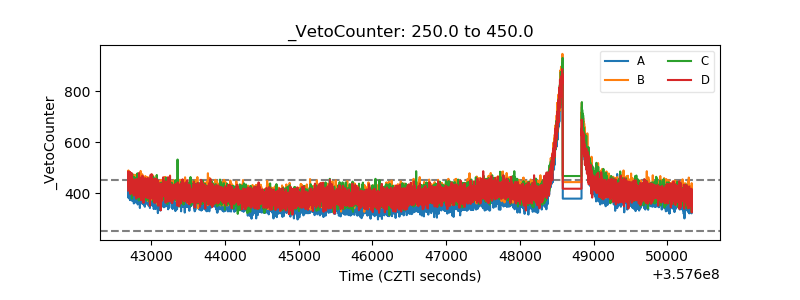 |