| Param | Original file | Final file |
|---|---|---|
| Filename | modeM0/AS1A10_007T01_9000004350_30246cztM0_level2.evt | modeM0/AS1A10_007T01_9000004350_30246cztM0_level2_quad_clean.evt |
| Size (bytes) | 985,242,240 | 150,238,080 |
| Size | 939.6 MB | 143.3 MB |
| Events in quadrant A | 6,259,873 | 919,900 |
| Events in quadrant B | 9,900,771 | 924,087 |
| Events in quadrant C | 6,268,594 | 908,847 |
| Events in quadrant D | 6,531,224 | 899,597 |
| Mode M9 | |||
|---|---|---|---|
| Quadrant | BADHDUFLAG | Total packets | Discarded packets |
| A | 0 | 12 | 0 |
| B | 0 | 12 | 0 |
| C | 0 | 12 | 0 |
| D | 0 | 12 | 0 |
| Mode SS | |||
|---|---|---|---|
| Quadrant | BADHDUFLAG | Total packets | Discarded packets |
| A | 0 | 264 | 0 |
| B | 0 | 264 | 0 |
| C | 0 | 264 | 0 |
| D | 0 | 264 | 0 |
| Mode M0 | |||
|---|---|---|---|
| Quadrant | BADHDUFLAG | Total packets | Discarded packets |
| A | 0 | 26926 | 2 |
| B | 0 | 39309 | 4 |
| C | 0 | 26522 | 2 |
| D | 0 | 27410 | 2 |
| Quadrant | Total seconds | Saturated seconds | Saturation percentage |
|---|---|---|---|
| A | 12991 | 113 | 0.869833% |
| B | 12990 | 168 | 1.293303% |
| C | 12990 | 141 | 1.085450% |
| D | 12990 | 62 | 0.477290% |
Noise dominated data is calculated using 1-second bins in cleaned event files. If a bin has >2000 counts, and if more than 50% of those come from <1% of pixels, then it is considered to be noise-dominated and hence unusable.
| Quadrant | # 1 sec bins | Bins with >0 counts | Bins with >2000 counts | High rate bins dominated by noise | Noise dominated (total time) | Noise dominated (detector-on time) | Marked lightcurve |
|---|---|---|---|---|---|---|---|
| A | 14216 | 12992 | 15 | 15 | 0.11% | 0.12% | 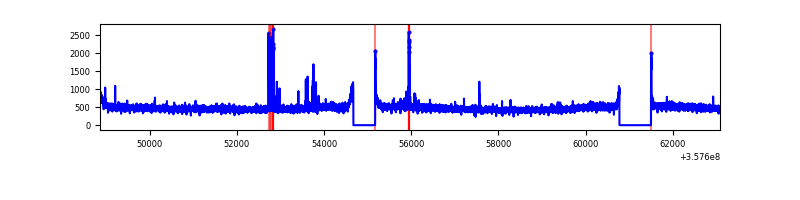 |
| B | 14215 | 12991 | 4 | 4 | 0.03% | 0.03% | 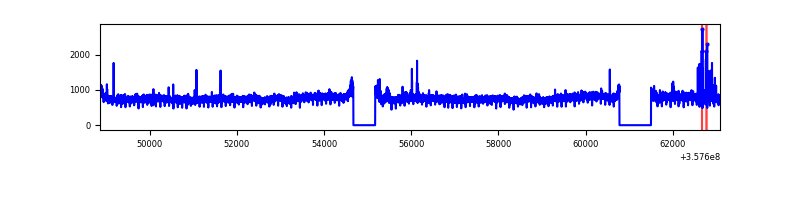 |
| C | 14215 | 12992 | 0 | 0 | 0.00% | 0.00% | 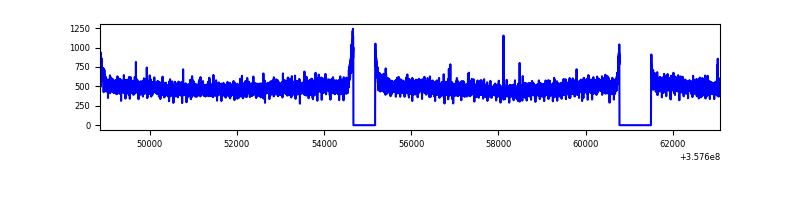 |
| D | 14215 | 12992 | 16 | 16 | 0.11% | 0.12% | 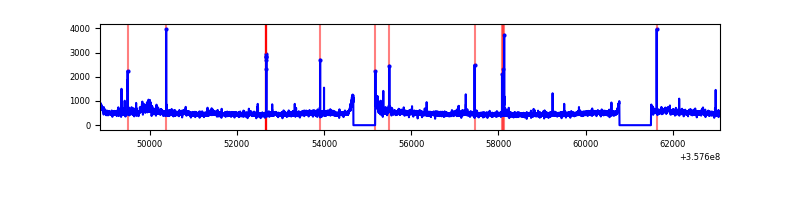 |
Top three noisy pixels from each quadrant. If the there are fewer than three noisy pixels in the level2.evt file, extra rows are filled as -1
| Pixel properties | Quadrant properties | ||||||
|---|---|---|---|---|---|---|---|
| Quadrant | DetID | PixID | Counts | Sigma | Mean | Median | Sigma |
| A | 0 | 13 | 119959 | 374.9 | 1579 | 1544 | 315.9 |
| A | 8 | 192 | 26870 | 80.18 | 1579 | 1544 | 315.9 |
| A | 13 | 254 | 24245 | 71.87 | 1579 | 1544 | 315.9 |
| B | 6 | 159 | 3642395 | 11987.31 | 1561 | 1520 | 303.7 |
| B | 0 | 229 | 65760 | 211.51 | 1561 | 1520 | 303.7 |
| B | 12 | 111 | 38203 | 120.78 | 1561 | 1520 | 303.7 |
| C | 14 | 238 | 245919 | 679.36 | 1525 | 1535 | 359.7 |
| C | 3 | 233 | 49093 | 132.21 | 1525 | 1535 | 359.7 |
| C | 2 | 114 | 30172 | 79.61 | 1525 | 1535 | 359.7 |
| D | 8 | 195 | 511240 | 1352.08 | 1536 | 1502 | 377.0 |
| D | 1 | 52 | 70598 | 183.28 | 1536 | 1502 | 377.0 |
| D | 2 | 234 | 60077 | 155.37 | 1536 | 1502 | 377.0 |
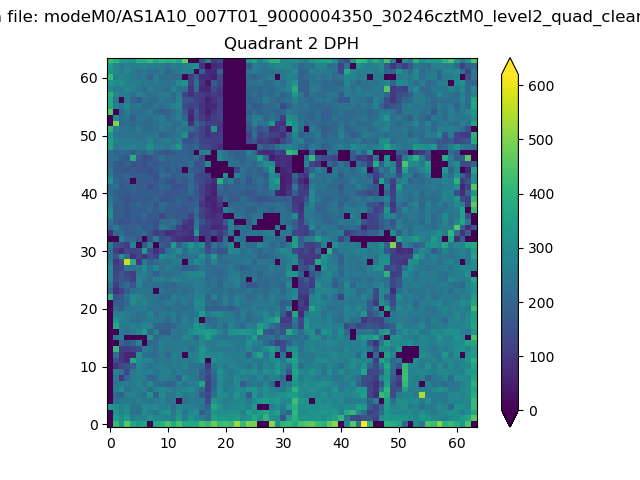
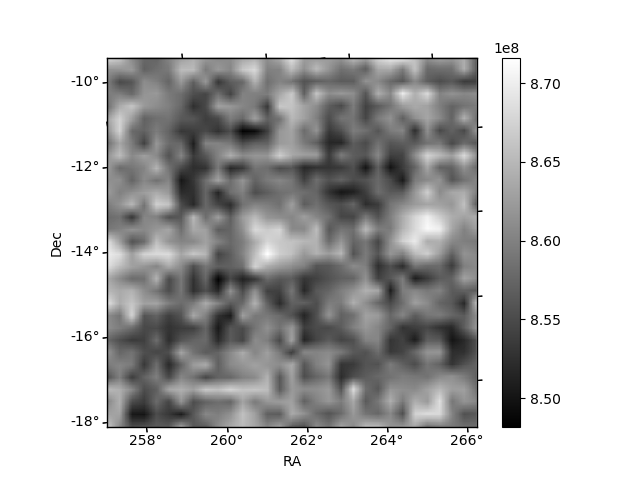
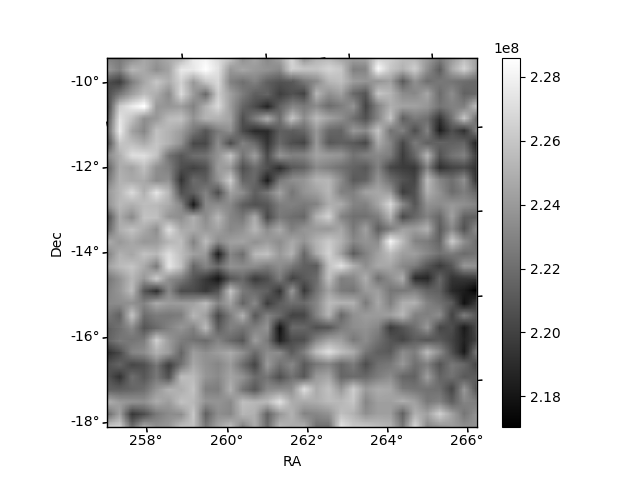
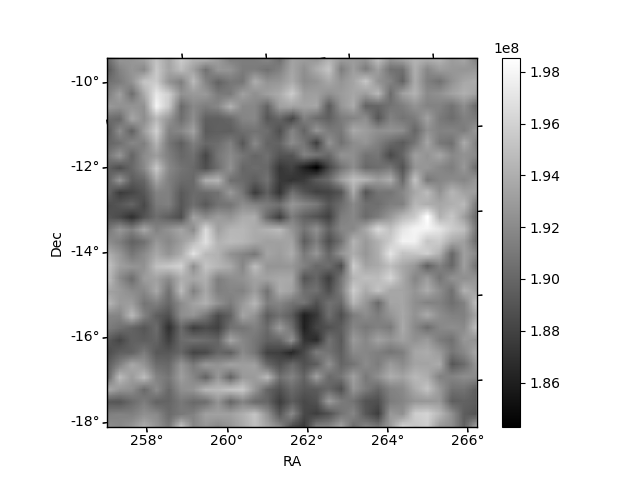
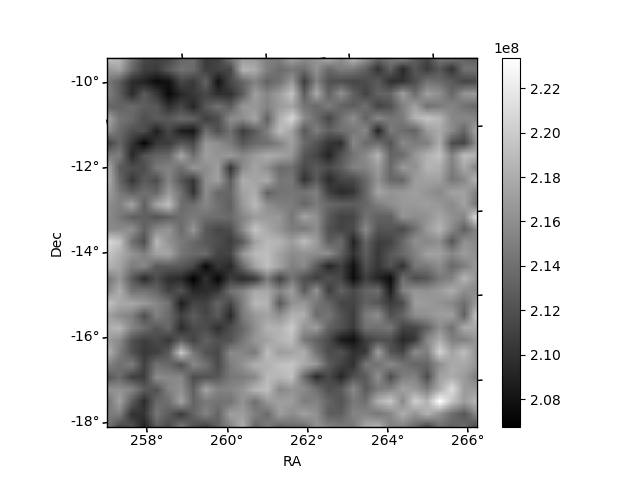
Histogram calculated using DETX and DETY for each event in the final _common_clean file
| Quadrant A | 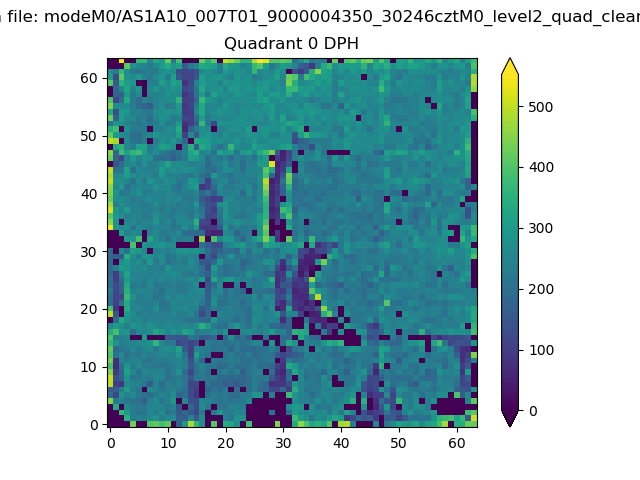 |
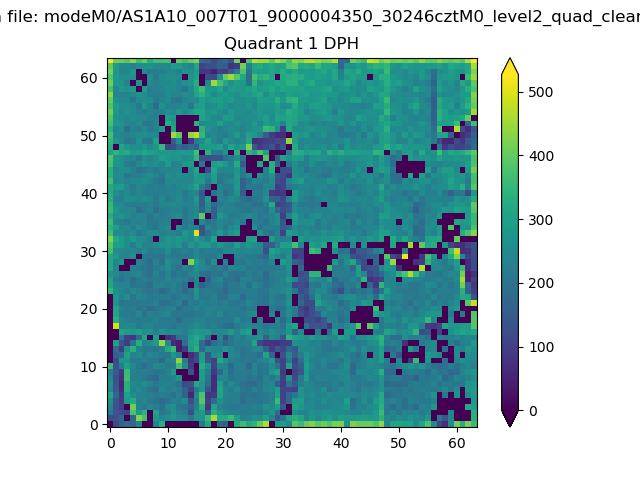 |
Quadrant B |
|---|---|---|---|
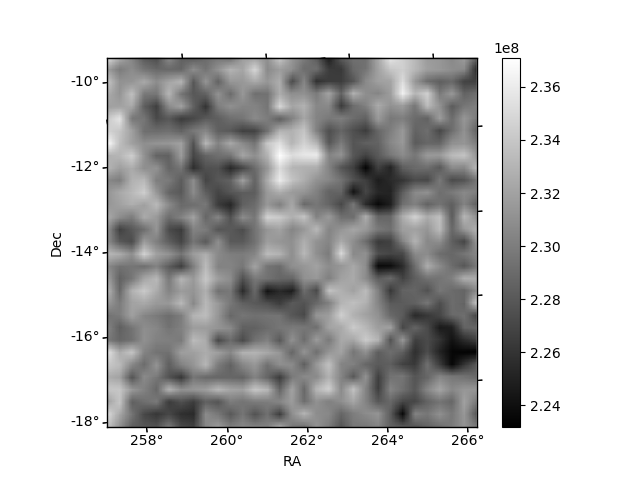
| Quadrant D | 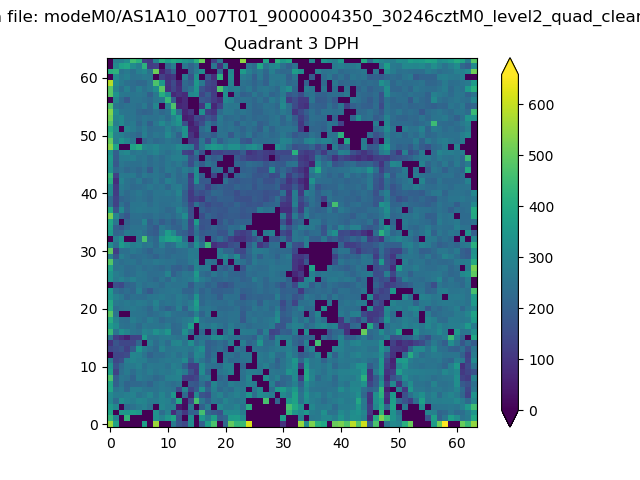 |
 |
Quadrant C |
| Plot type | Count rate plots | Images |
|---|---|---|
| Comparison with Poisson distribution Blue bars denote a histogram of data divided into 1 sec bins. Red curve is a Poisson curve with rate = median count rate of data. |
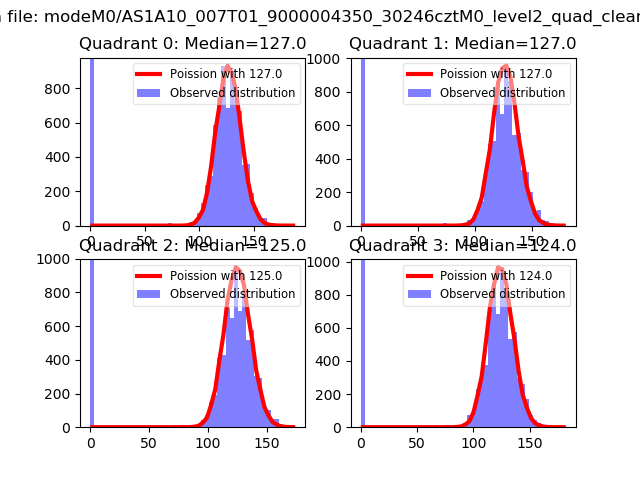 |
 |
| Quadrant-wise count rates Data is divided into 100 sec bins |
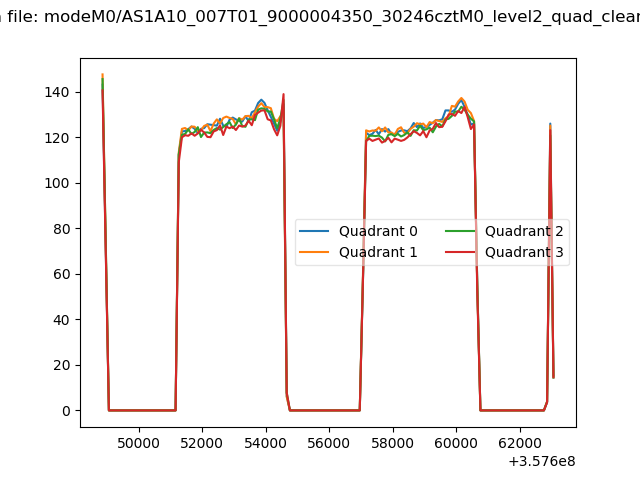 |
|
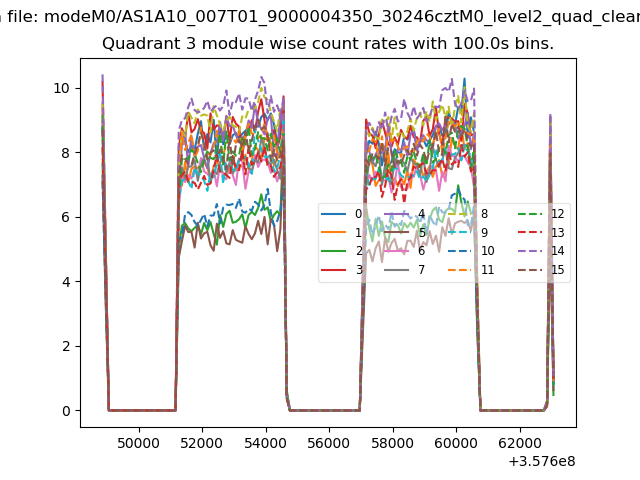
| Module-wise count rates for Quadrant A Data is divided into 100 sec bins |
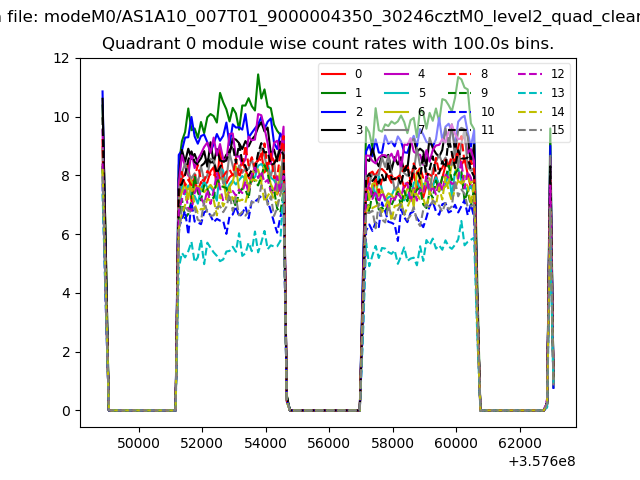 |
 |
| Module-wise count rates for Quadrant B Data is divided into 100 sec bins |
 |
 |
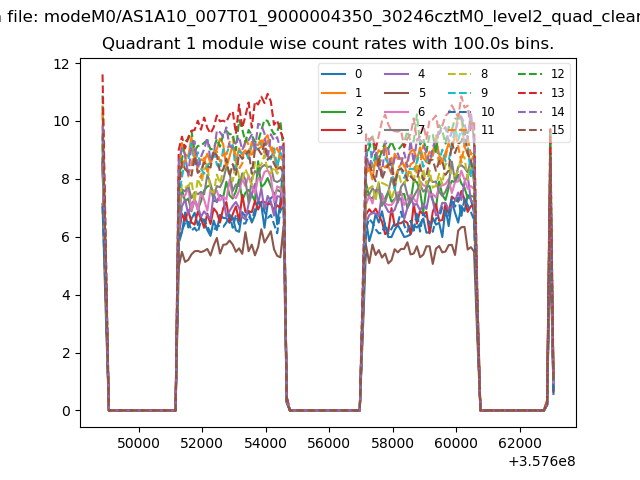
| Module-wise count rates for Quadrant C Data is divided into 100 sec bins |
 |
 |
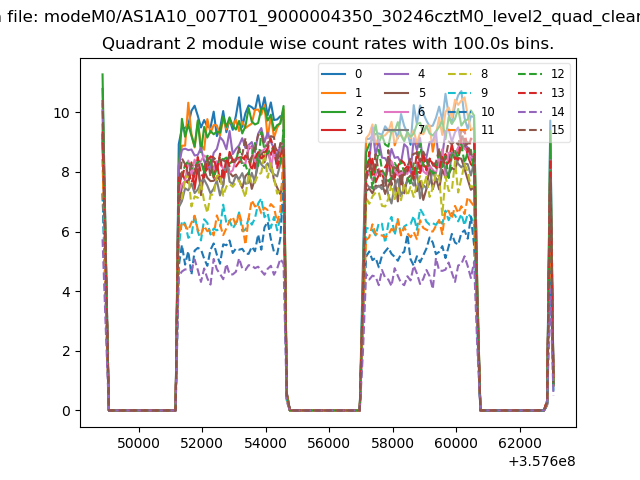
| Module-wise count rates for Quadrant D Data is divided into 100 sec bins |
 |
 |
| Parameter | Plot |
|---|---|
| CZT HV Monitor | 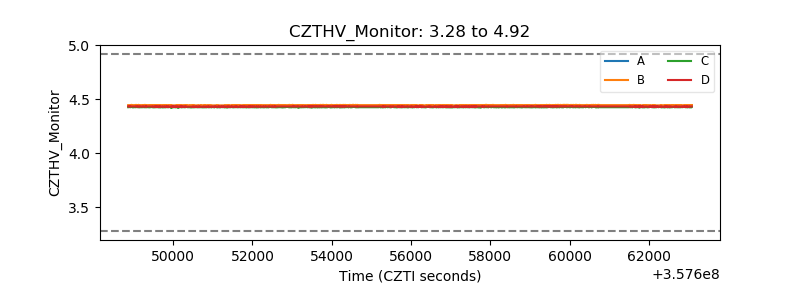 |
| D_VDD | 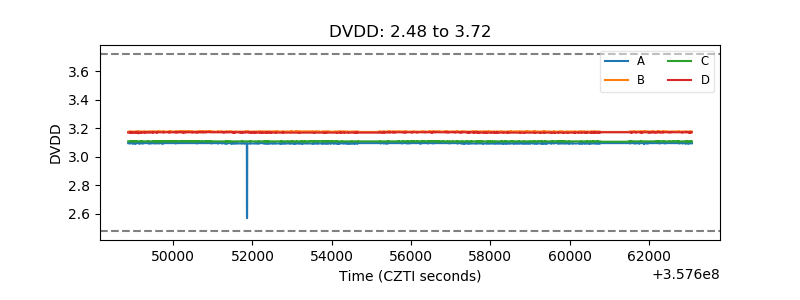 |
| Temperature 1 | 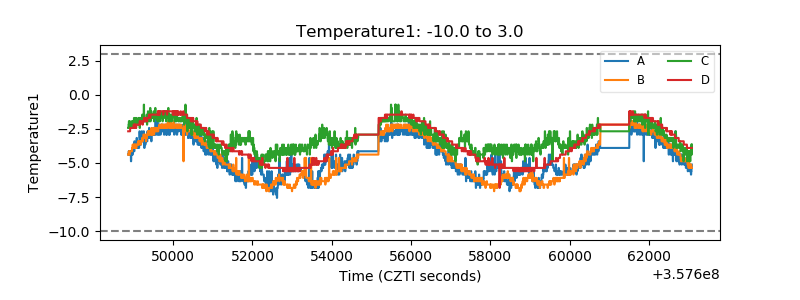 |
| Veto HV Monitor | 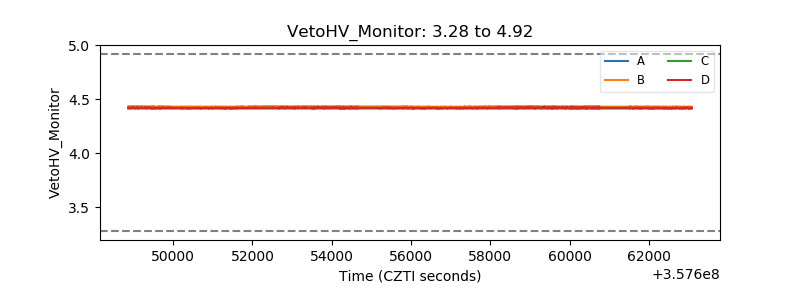 |
| Veto LLD | 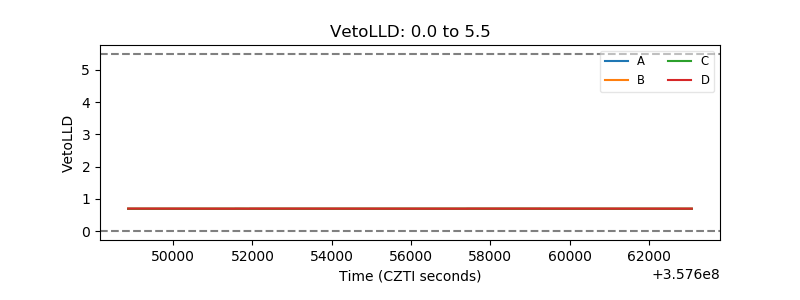 |
| Alpha Counter | 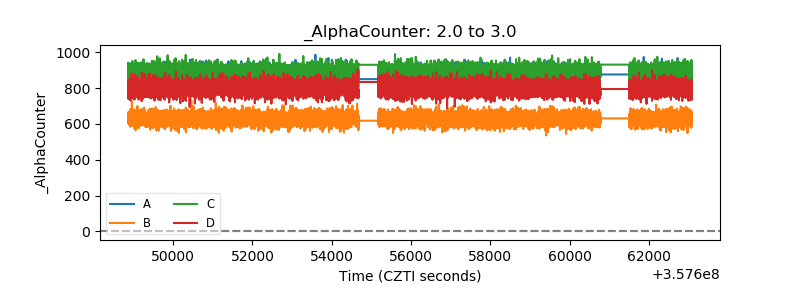 |
| _CPM_Rate | 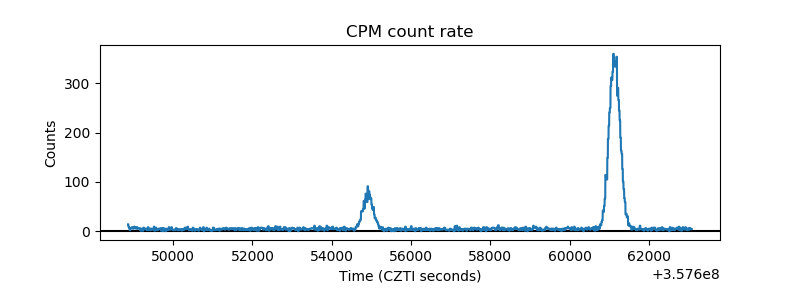 |
| CZT Counter | 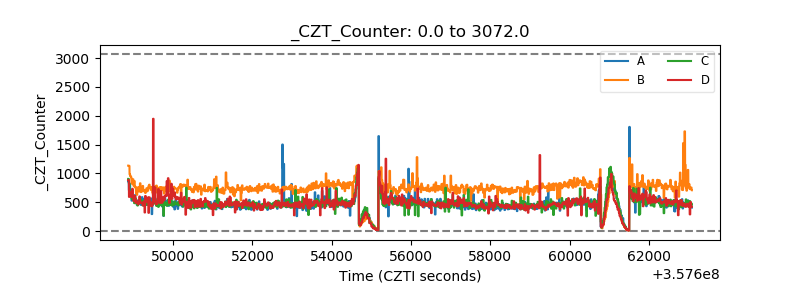 |
| +2.5 Volts monitor |  |
| +5 Volts monitor |  |
| _ROLL_ROT | 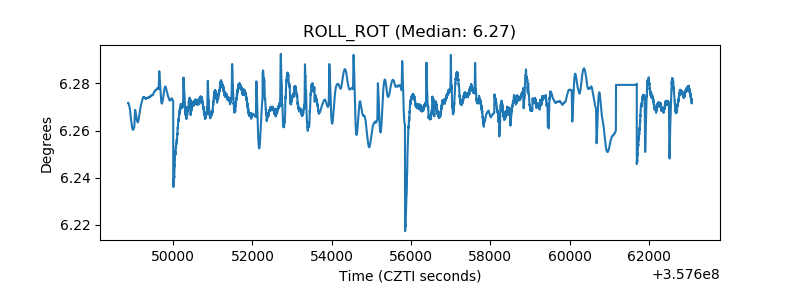 |
| _Roll_DEC | 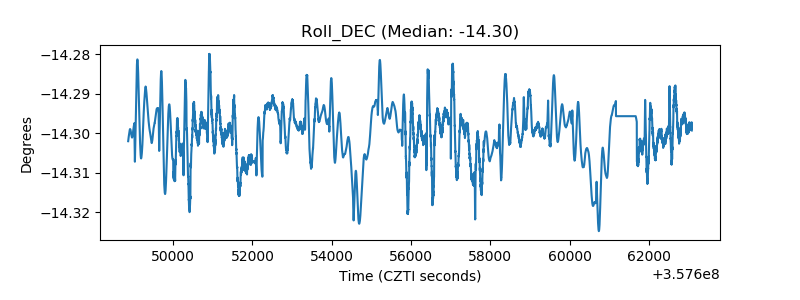 |
| _Roll_RA | 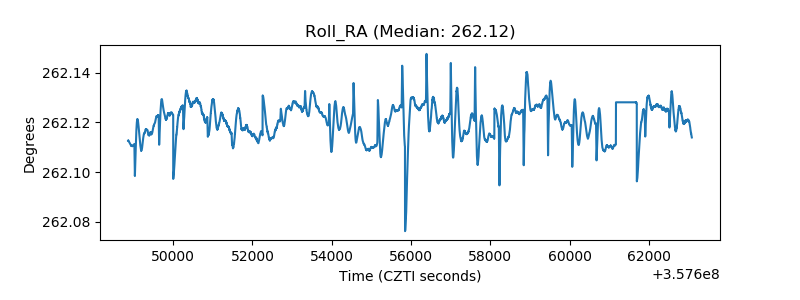 |
| Veto Counter | 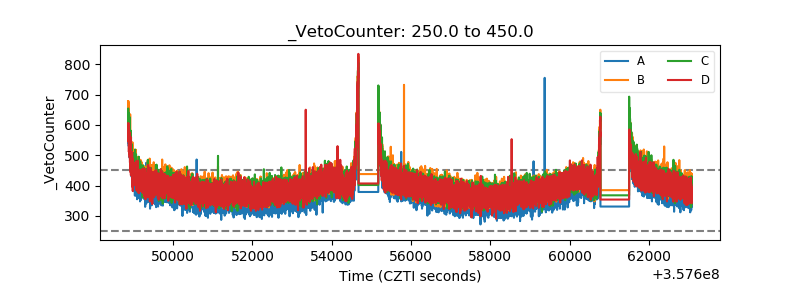 |