| Param | Original file | Final file |
|---|---|---|
| Filename | modeM0/AS1A10_007T01_9000004350_30248cztM0_level2.evt | modeM0/AS1A10_007T01_9000004350_30248cztM0_level2_quad_clean.evt |
| Size (bytes) | 508,429,440 | 87,681,600 |
| Size | 484.9 MB | 83.6 MB |
| Events in quadrant A | 3,161,621 | 555,833 |
| Events in quadrant B | 5,193,758 | 556,201 |
| Events in quadrant C | 3,315,671 | 549,221 |
| Events in quadrant D | 3,286,356 | 540,941 |
| Mode M9 | |||
|---|---|---|---|
| Quadrant | BADHDUFLAG | Total packets | Discarded packets |
| A | 0 | 16 | 0 |
| B | 0 | 17 | 0 |
| C | 0 | 17 | 0 |
| D | 0 | 17 | 0 |
| Mode SS | |||
|---|---|---|---|
| Quadrant | BADHDUFLAG | Total packets | Discarded packets |
| A | 0 | 134 | 0 |
| B | 0 | 134 | 0 |
| C | 0 | 134 | 0 |
| D | 0 | 134 | 0 |
| Mode M0 | |||
|---|---|---|---|
| Quadrant | BADHDUFLAG | Total packets | Discarded packets |
| A | 0 | 13539 | 2 |
| B | 0 | 20003 | 2 |
| C | 0 | 13807 | 2 |
| D | 0 | 13939 | 2 |
| Quadrant | Total seconds | Saturated seconds | Saturation percentage |
|---|---|---|---|
| A | 6488 | 44 | 0.678175% |
| B | 6488 | 145 | 2.234895% |
| C | 6488 | 112 | 1.726264% |
| D | 6487 | 21 | 0.323724% |
Noise dominated data is calculated using 1-second bins in cleaned event files. If a bin has >2000 counts, and if more than 50% of those come from <1% of pixels, then it is considered to be noise-dominated and hence unusable.
| Quadrant | # 1 sec bins | Bins with >0 counts | Bins with >2000 counts | High rate bins dominated by noise | Noise dominated (total time) | Noise dominated (detector-on time) | Marked lightcurve |
|---|---|---|---|---|---|---|---|
| A | 7533 | 6489 | 5 | 5 | 0.07% | 0.08% | 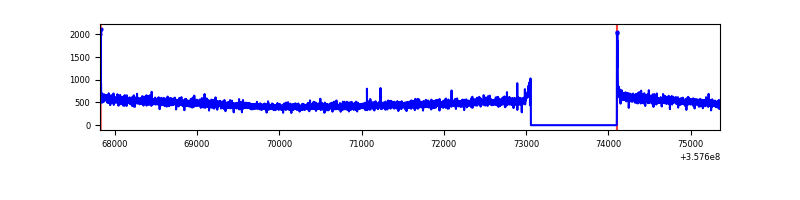 |
| B | 7533 | 6489 | 39 | 39 | 0.52% | 0.60% | 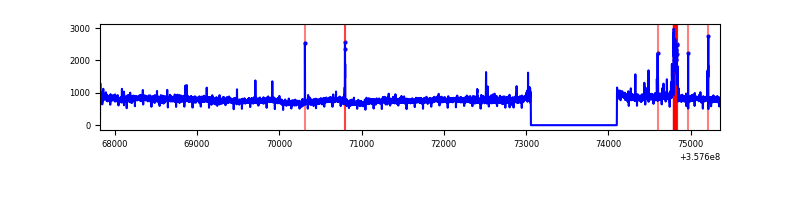 |
| C | 7533 | 6489 | 0 | 0 | 0.00% | 0.00% | 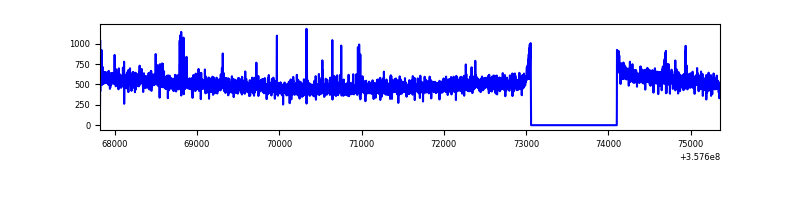 |
| D | 7532 | 6488 | 1 | 1 | 0.01% | 0.02% | 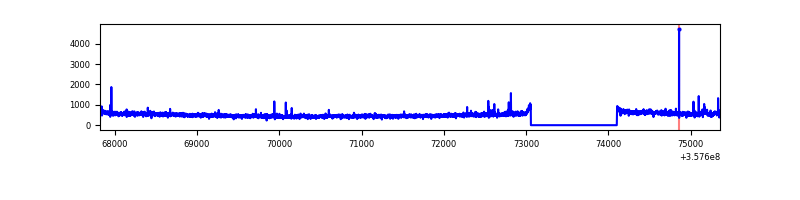 |
Top three noisy pixels from each quadrant. If the there are fewer than three noisy pixels in the level2.evt file, extra rows are filled as -1
| Pixel properties | Quadrant properties | ||||||
|---|---|---|---|---|---|---|---|
| Quadrant | DetID | PixID | Counts | Sigma | Mean | Median | Sigma |
| A | 8 | 192 | 27544 | 164.07 | 812 | 796 | 163.0 |
| A | 13 | 254 | 12423 | 71.32 | 812 | 796 | 163.0 |
| A | 3 | 137 | 8442 | 46.9 | 812 | 796 | 163.0 |
| B | 6 | 159 | 1858305 | 11965.3 | 806 | 785 | 155.2 |
| B | 6 | 36 | 114723 | 733.94 | 806 | 785 | 155.2 |
| B | 4 | 80 | 26947 | 168.52 | 806 | 785 | 155.2 |
| C | 14 | 238 | 154901 | 833.89 | 787 | 792 | 184.8 |
| C | 14 | 254 | 41180 | 218.54 | 787 | 792 | 184.8 |
| C | 3 | 233 | 40503 | 214.88 | 787 | 792 | 184.8 |
| D | 8 | 195 | 242598 | 1229.19 | 789 | 771 | 196.7 |
| D | 2 | 234 | 30239 | 149.78 | 789 | 771 | 196.7 |
| D | 2 | 250 | 12116 | 57.67 | 789 | 771 | 196.7 |
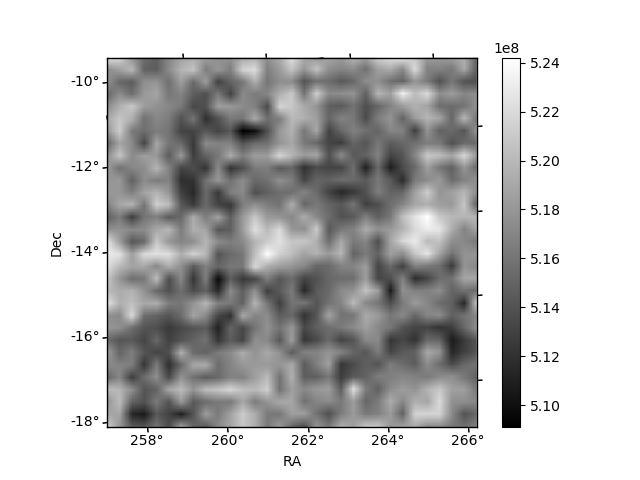
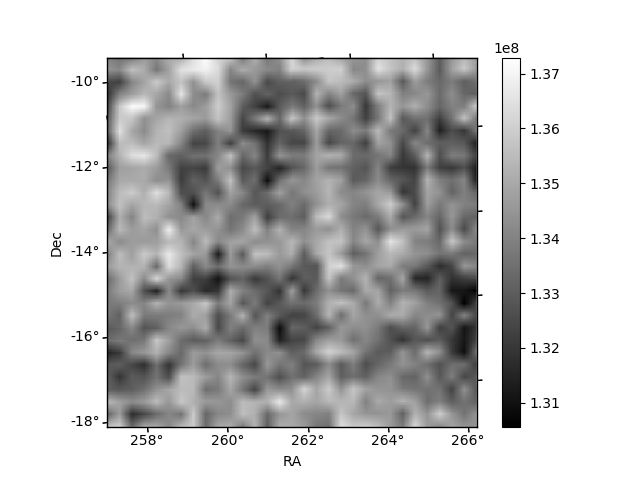
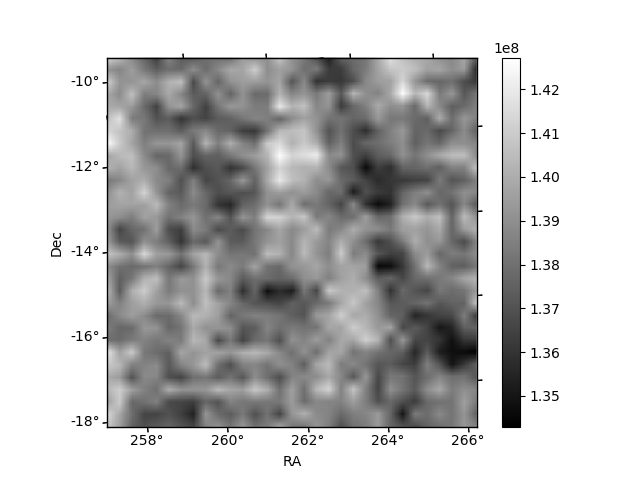
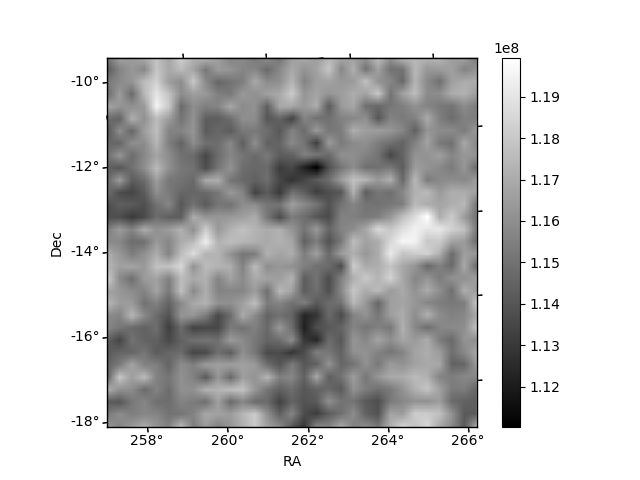
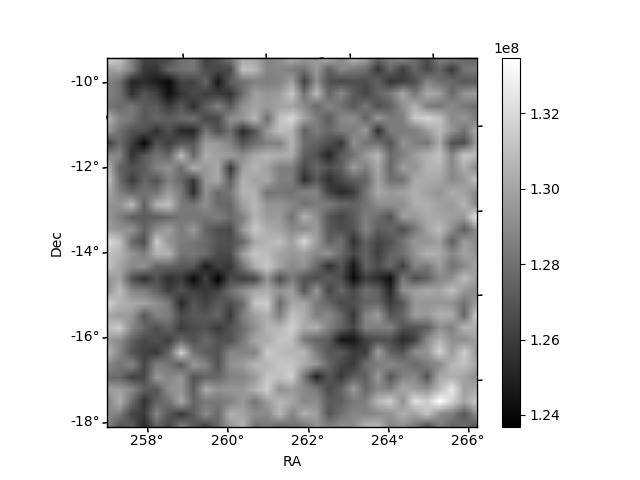
Histogram calculated using DETX and DETY for each event in the final _common_clean file
| Quadrant A | 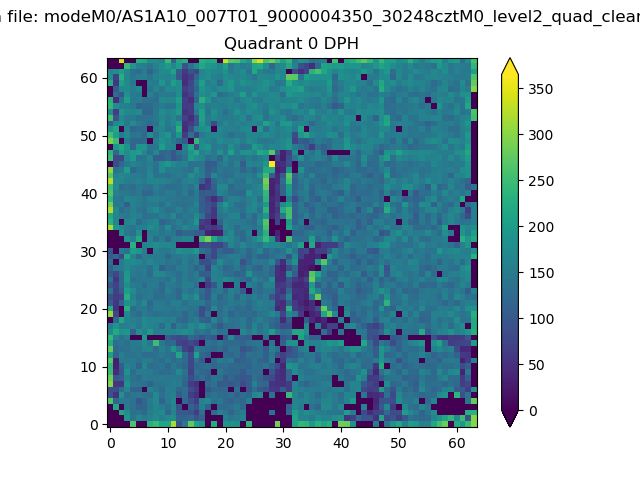 |
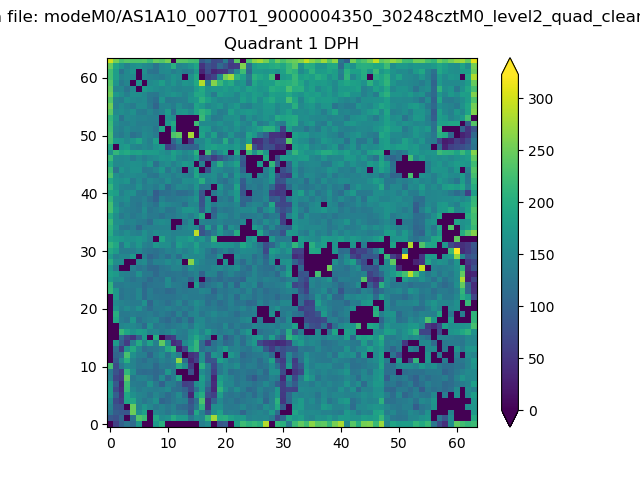 |
Quadrant B |
|---|---|---|---|
| Quadrant D | 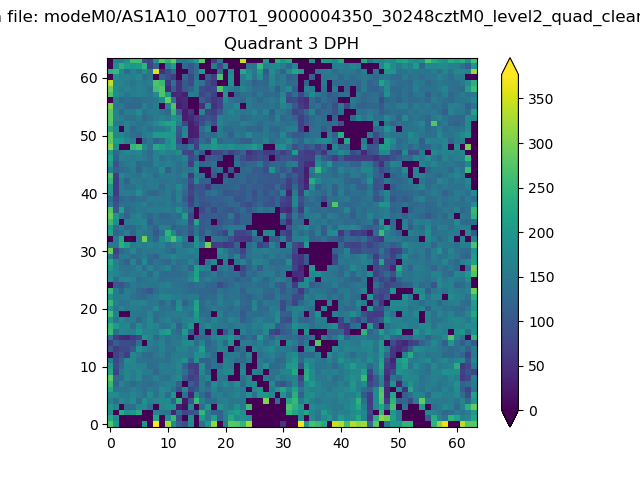 |
 |
Quadrant C |
| Plot type | Count rate plots | Images |
|---|---|---|
| Comparison with Poisson distribution Blue bars denote a histogram of data divided into 1 sec bins. Red curve is a Poisson curve with rate = median count rate of data. |
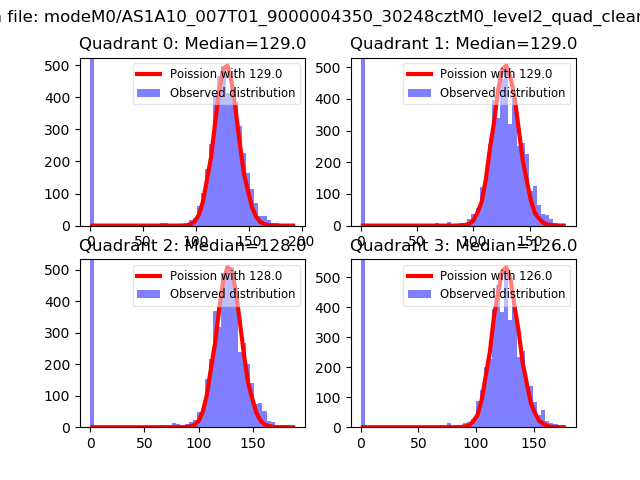 |
 |
| Quadrant-wise count rates Data is divided into 100 sec bins |
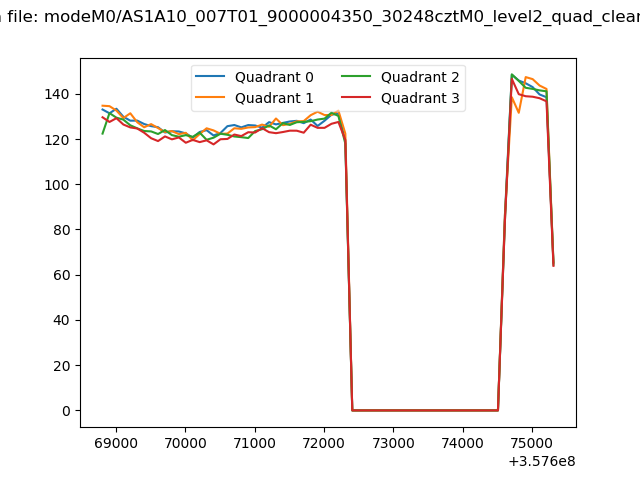 |
|
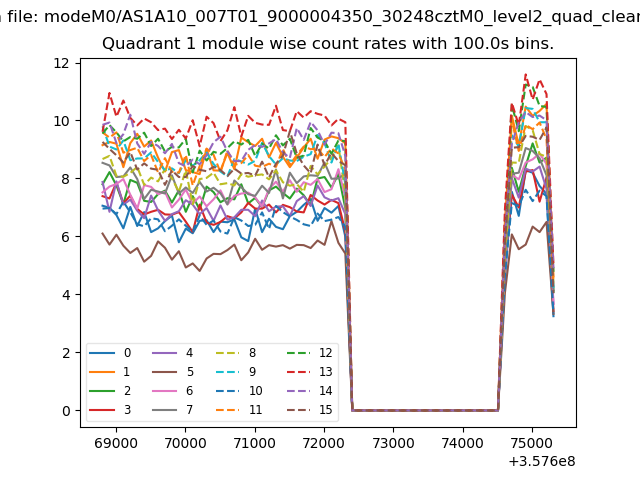
| Module-wise count rates for Quadrant A Data is divided into 100 sec bins |
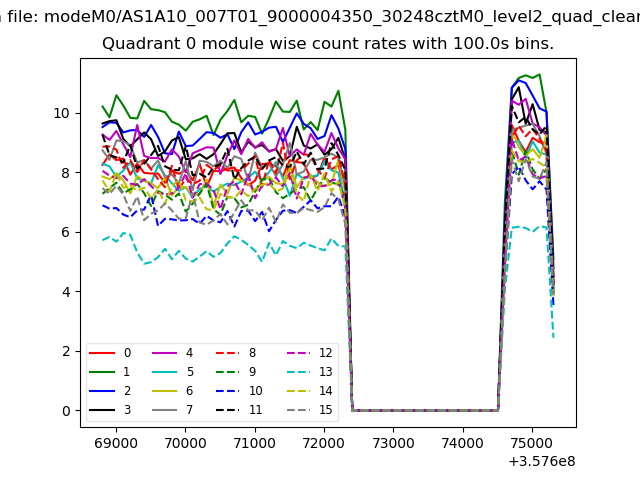 |
 |
| Module-wise count rates for Quadrant B Data is divided into 100 sec bins |
 |
 |
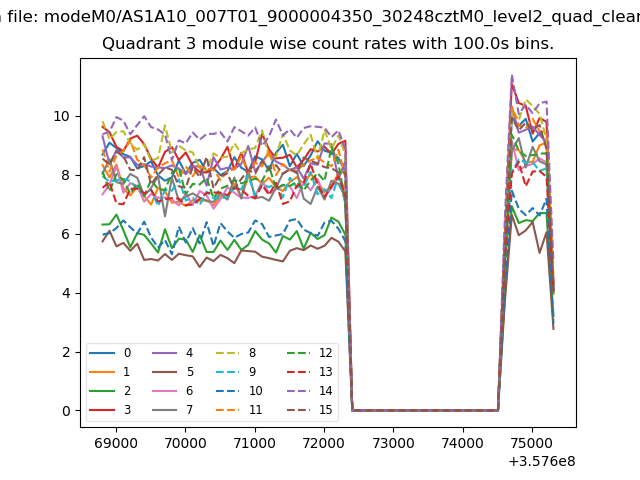
| Module-wise count rates for Quadrant C Data is divided into 100 sec bins |
 |
 |
| Module-wise count rates for Quadrant D Data is divided into 100 sec bins |
 |
 |
| Parameter | Plot |
|---|---|
| CZT HV Monitor | 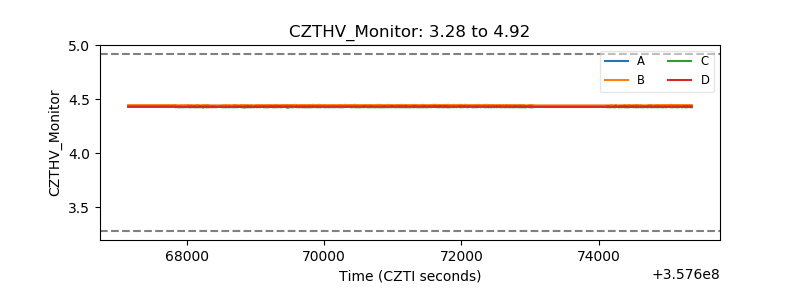 |
| D_VDD | 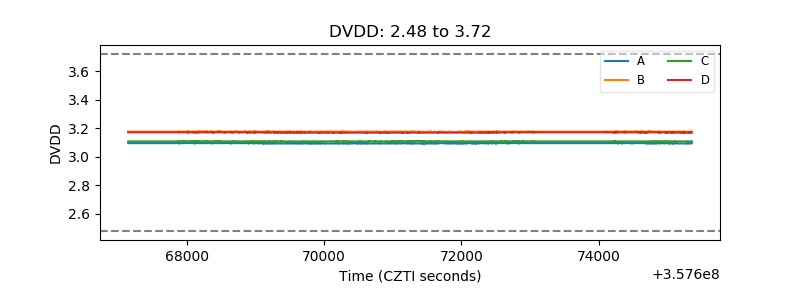 |
| Temperature 1 | 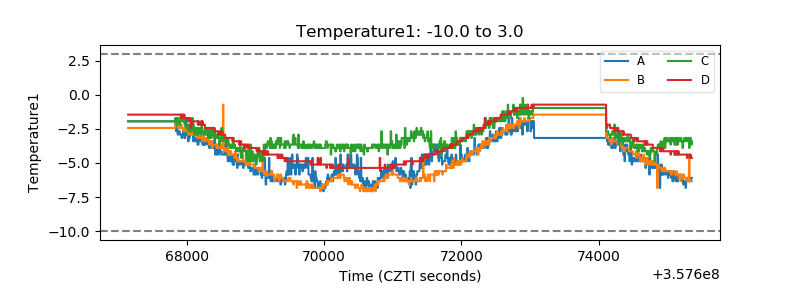 |
| Veto HV Monitor | 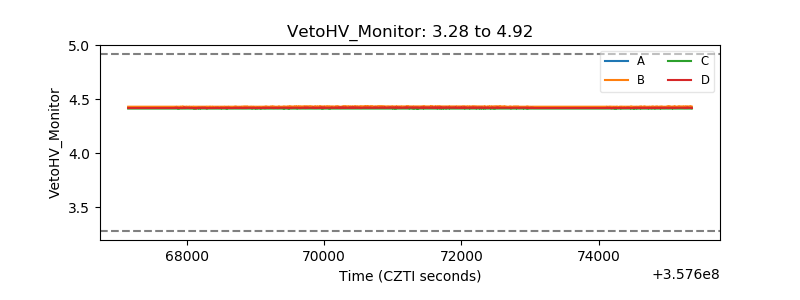 |
| Veto LLD | 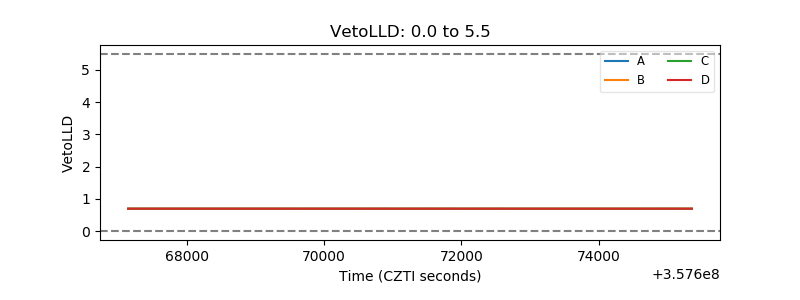 |
| Alpha Counter |  |
| _CPM_Rate | 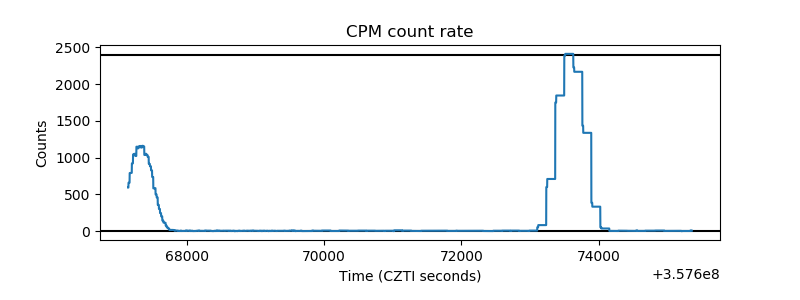 |
| CZT Counter | 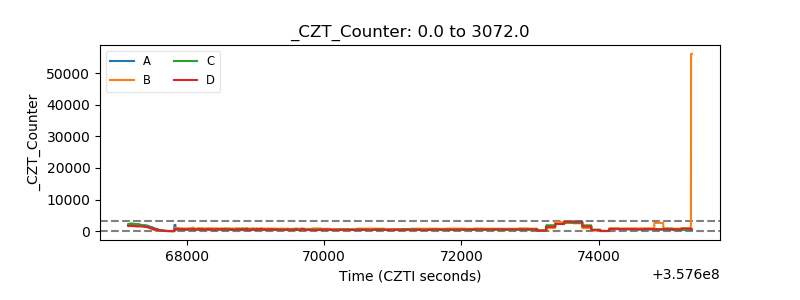 |
| +2.5 Volts monitor |  |
| +5 Volts monitor | 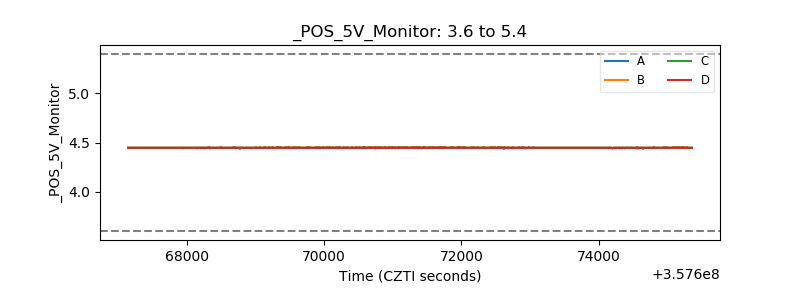 |
| _ROLL_ROT | 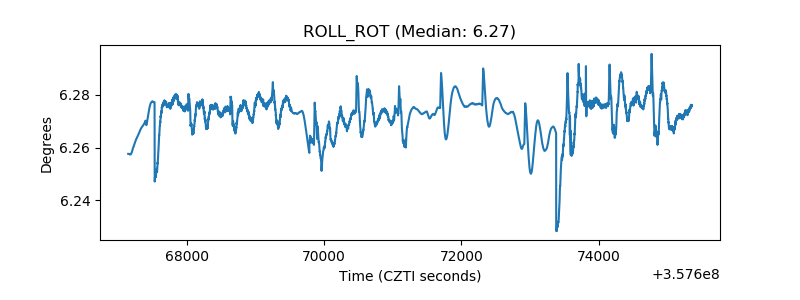 |
| _Roll_DEC | 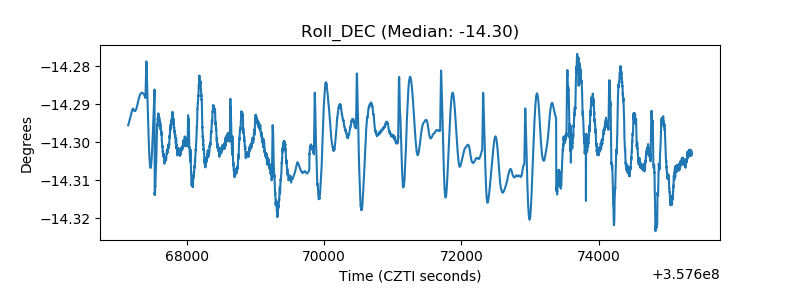 |
| _Roll_RA | 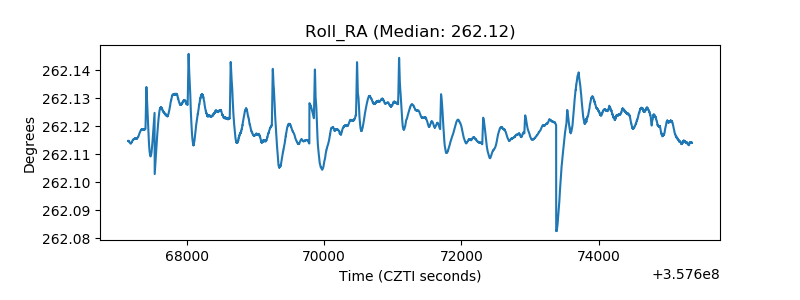 |
| Veto Counter | 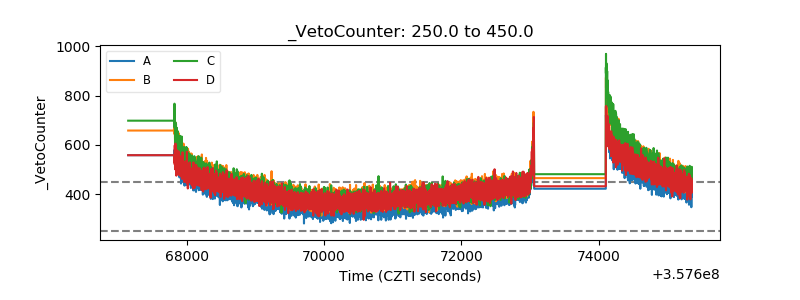 |