| Param | Original file | Final file |
|---|---|---|
| Filename | modeM0/AS1A10_007T01_9000004350_30251cztM0_level2.evt | modeM0/AS1A10_007T01_9000004350_30251cztM0_level2_quad_clean.evt |
| Size (bytes) | 592,801,920 | 110,730,240 |
| Size | 565.3 MB | 105.6 MB |
| Events in quadrant A | 3,294,715 | 743,824 |
| Events in quadrant B | 7,048,753 | 701,814 |
| Events in quadrant C | 3,446,854 | 745,131 |
| Events in quadrant D | 3,733,893 | 720,538 |
| Mode M9 | |||
|---|---|---|---|
| Quadrant | BADHDUFLAG | Total packets | Discarded packets |
| A | 0 | 25 | 0 |
| B | 0 | 25 | 0 |
| C | 0 | 25 | 0 |
| D | 0 | 25 | 0 |
| Mode SS | |||
|---|---|---|---|
| Quadrant | BADHDUFLAG | Total packets | Discarded packets |
| A | 0 | 130 | 0 |
| B | 0 | 130 | 0 |
| C | 0 | 130 | 0 |
| D | 0 | 130 | 0 |
| Mode M0 | |||
|---|---|---|---|
| Quadrant | BADHDUFLAG | Total packets | Discarded packets |
| A | 0 | 13792 | 2 |
| B | 0 | 25401 | 2 |
| C | 0 | 14238 | 2 |
| D | 0 | 15231 | 2 |
| Quadrant | Total seconds | Saturated seconds | Saturation percentage |
|---|---|---|---|
| A | 6336 | 43 | 0.678662% |
| B | 6337 | 1082 | 17.074325% |
| C | 6337 | 137 | 2.161906% |
| D | 6337 | 46 | 0.725896% |
Noise dominated data is calculated using 1-second bins in cleaned event files. If a bin has >2000 counts, and if more than 50% of those come from <1% of pixels, then it is considered to be noise-dominated and hence unusable.
| Quadrant | # 1 sec bins | Bins with >0 counts | Bins with >2000 counts | High rate bins dominated by noise | Noise dominated (total time) | Noise dominated (detector-on time) | Marked lightcurve |
|---|---|---|---|---|---|---|---|
| A | 8811 | 6338 | 5 | 5 | 0.06% | 0.08% | 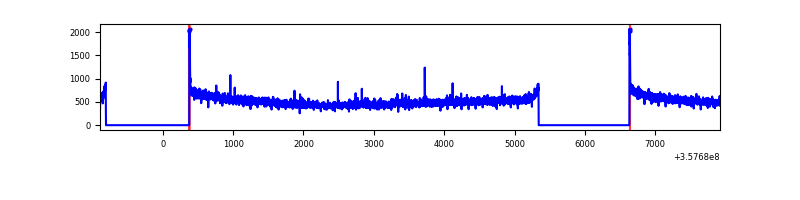 |
| B | 8812 | 6338 | 706 | 706 | 8.01% | 11.14% | 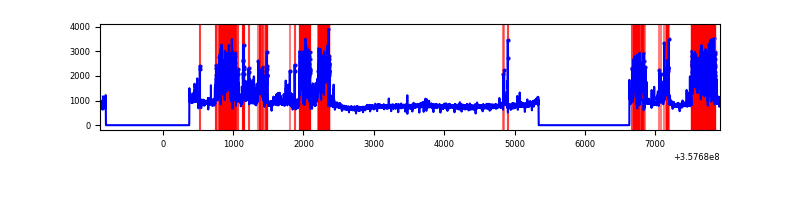 |
| C | 8812 | 6339 | 0 | 0 | 0.00% | 0.00% | 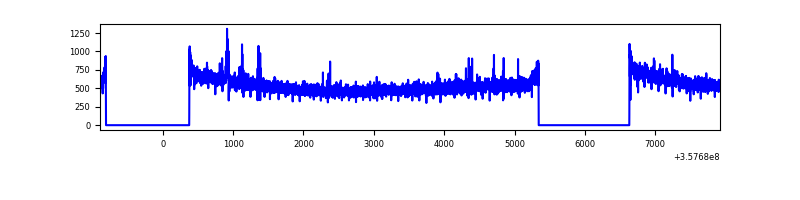 |
| D | 8812 | 6339 | 30 | 30 | 0.34% | 0.47% | 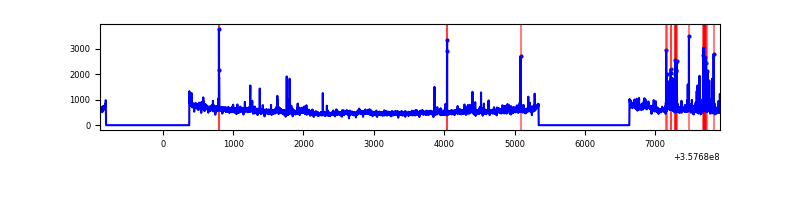 |
Top three noisy pixels from each quadrant. If the there are fewer than three noisy pixels in the level2.evt file, extra rows are filled as -1
| Pixel properties | Quadrant properties | ||||||
|---|---|---|---|---|---|---|---|
| Quadrant | DetID | PixID | Counts | Sigma | Mean | Median | Sigma |
| A | 8 | 192 | 25794 | 147.63 | 844 | 829 | 169.1 |
| A | 13 | 254 | 11955 | 65.79 | 844 | 829 | 169.1 |
| A | 0 | 13 | 11710 | 64.34 | 844 | 829 | 169.1 |
| B | 6 | 36 | 2126058 | 14093.69 | 804 | 786 | 150.8 |
| B | 6 | 159 | 1733071 | 11487.61 | 804 | 786 | 150.8 |
| B | 4 | 80 | 29372 | 189.57 | 804 | 786 | 150.8 |
| C | 14 | 238 | 151103 | 775.93 | 829 | 838 | 193.7 |
| C | 14 | 254 | 25420 | 126.93 | 829 | 838 | 193.7 |
| C | 2 | 114 | 14814 | 72.17 | 829 | 838 | 193.7 |
| D | 8 | 195 | 303167 | 1541.43 | 823 | 809 | 196.2 |
| D | 1 | 52 | 167924 | 851.95 | 823 | 809 | 196.2 |
| D | 2 | 250 | 36792 | 183.44 | 823 | 809 | 196.2 |
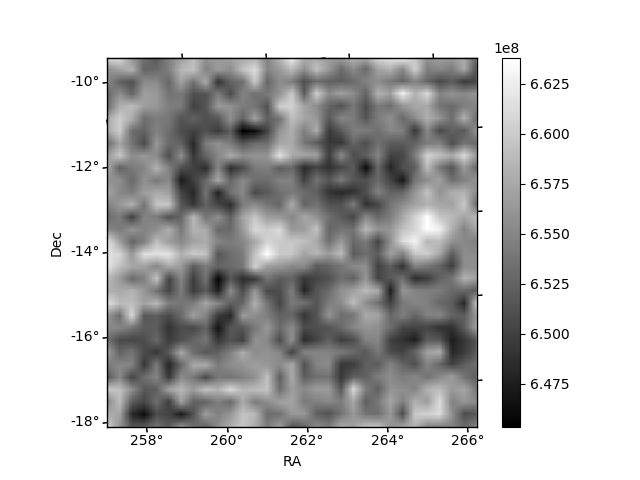
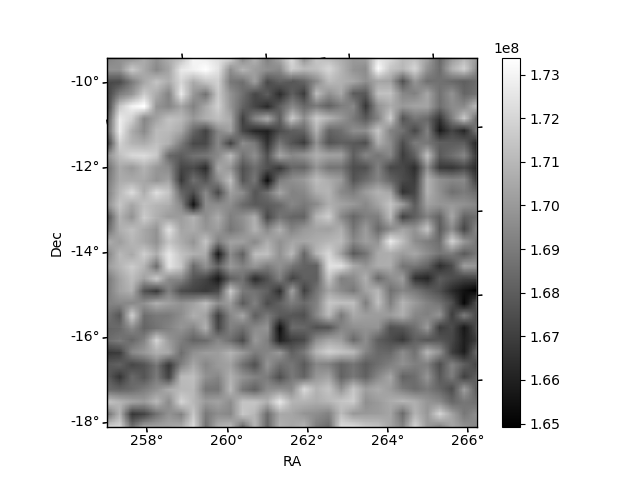
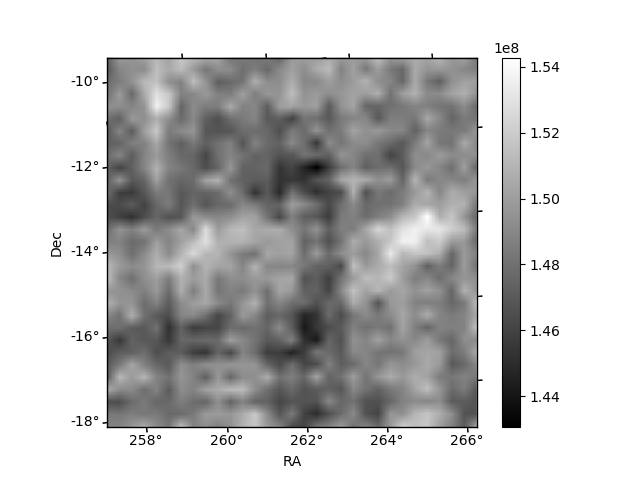
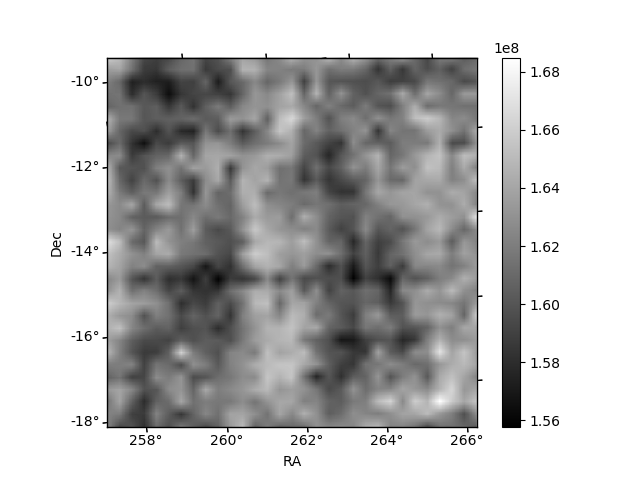
Histogram calculated using DETX and DETY for each event in the final _common_clean file
| Quadrant A | 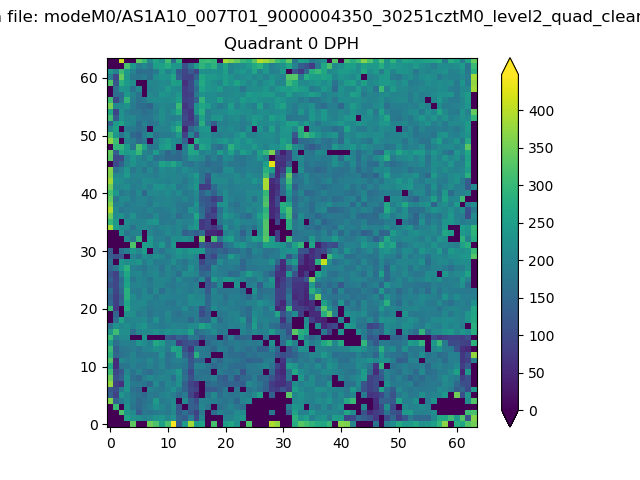 |
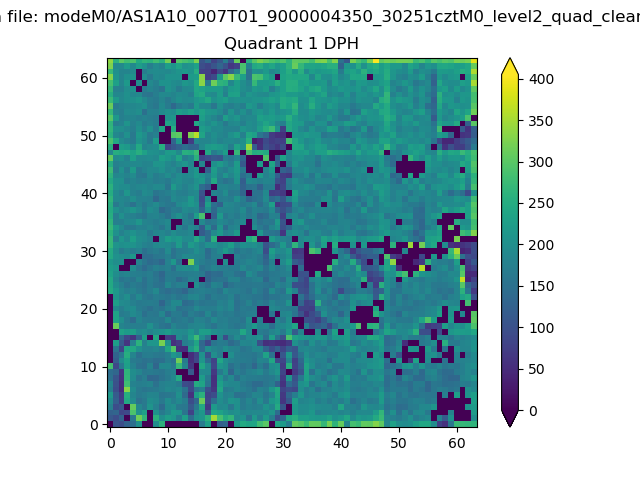 |
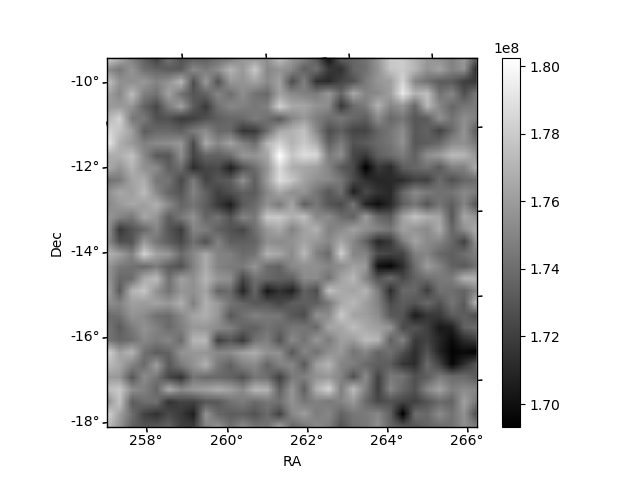
Quadrant B |
|---|---|---|---|
| Quadrant D | 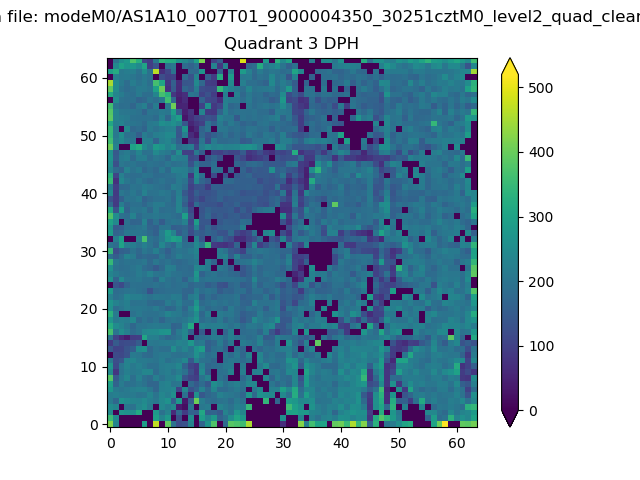 |
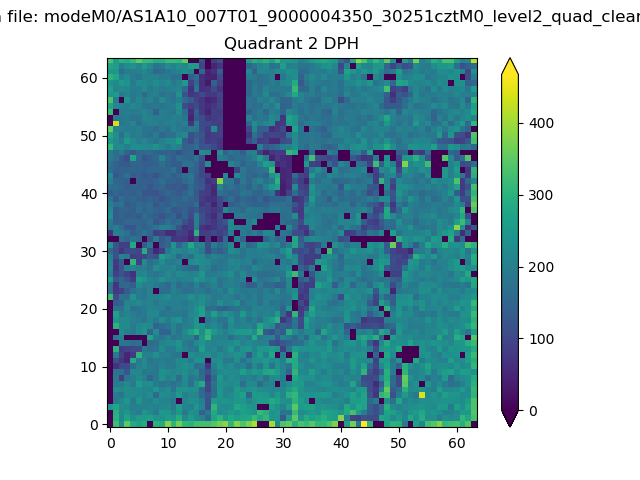 |
Quadrant C |
| Plot type | Count rate plots | Images |
|---|---|---|
| Comparison with Poisson distribution Blue bars denote a histogram of data divided into 1 sec bins. Red curve is a Poisson curve with rate = median count rate of data. |
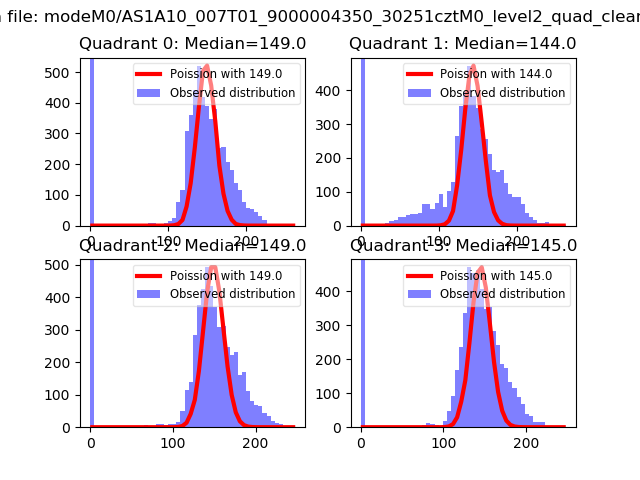 |
 |
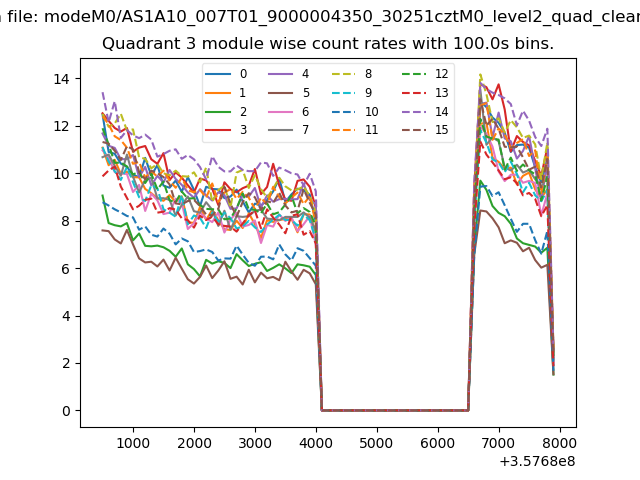
| Quadrant-wise count rates Data is divided into 100 sec bins |
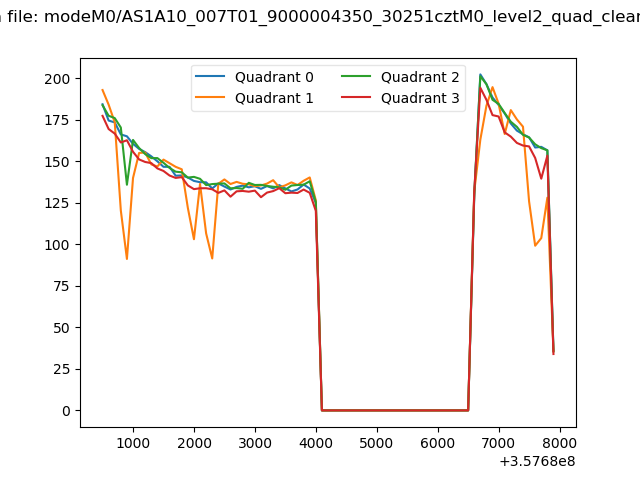 |
|
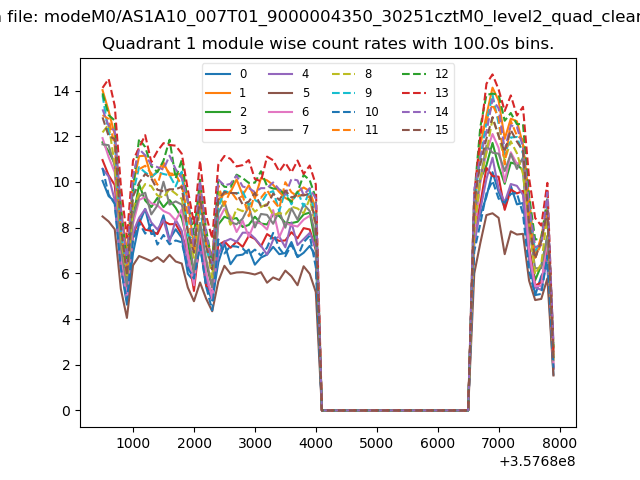
| Module-wise count rates for Quadrant A Data is divided into 100 sec bins |
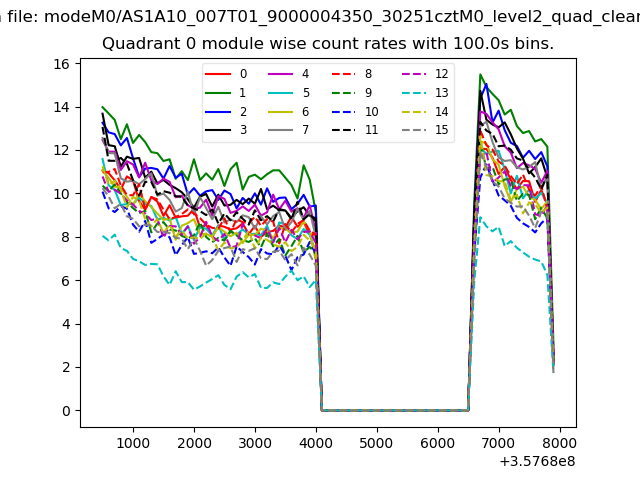 |
 |
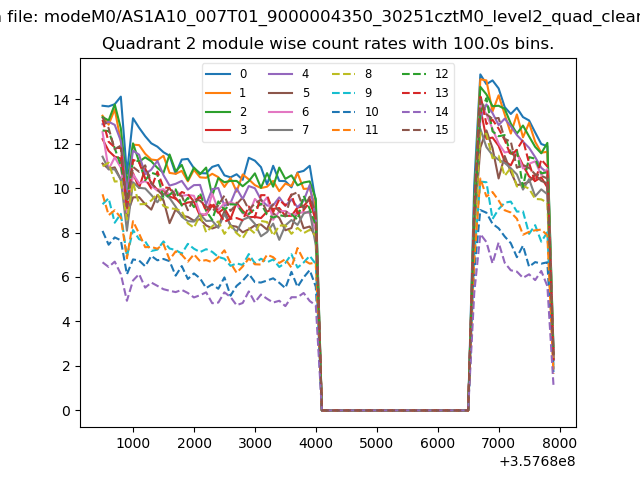
| Module-wise count rates for Quadrant B Data is divided into 100 sec bins |
 |
 |
| Module-wise count rates for Quadrant C Data is divided into 100 sec bins |
 |
 |
| Module-wise count rates for Quadrant D Data is divided into 100 sec bins |
 |
 |
| Parameter | Plot |
|---|---|
| CZT HV Monitor | 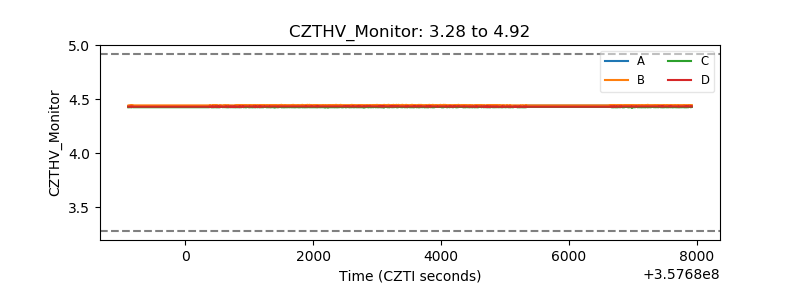 |
| D_VDD | 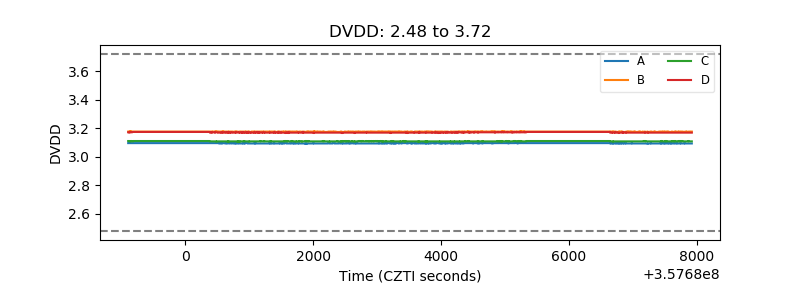 |
| Temperature 1 | 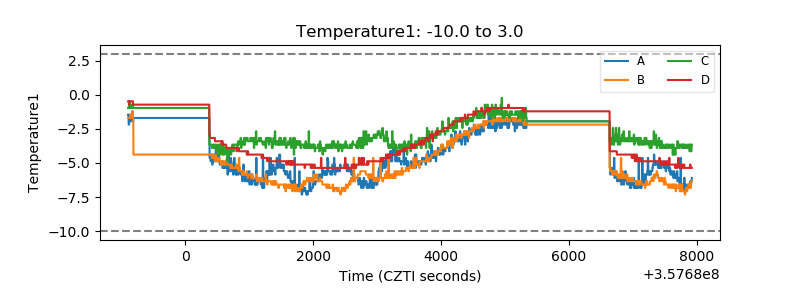 |
| Veto HV Monitor | 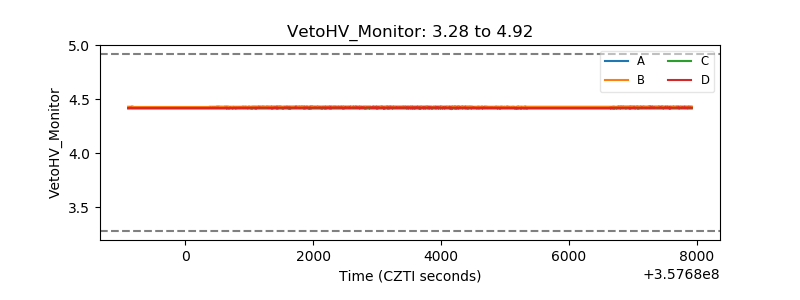 |
| Veto LLD | 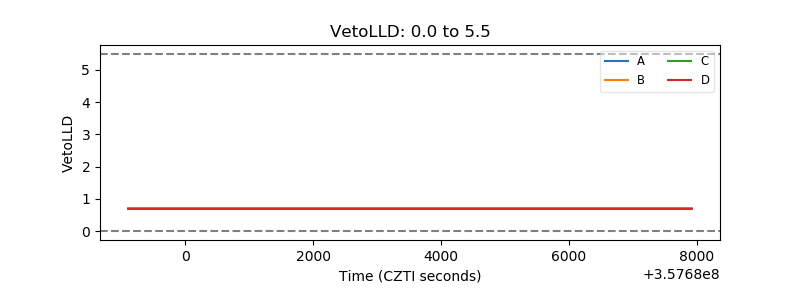 |
| Alpha Counter | 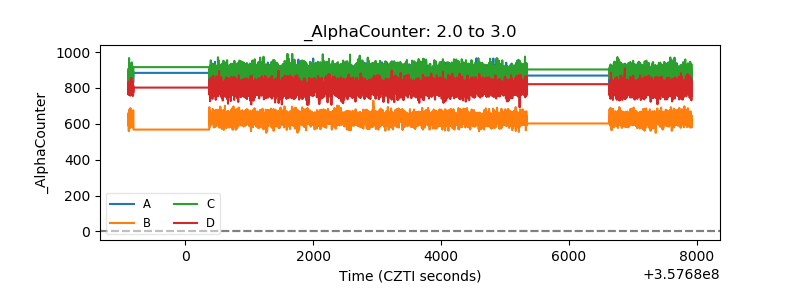 |
| _CPM_Rate |  |
| CZT Counter | 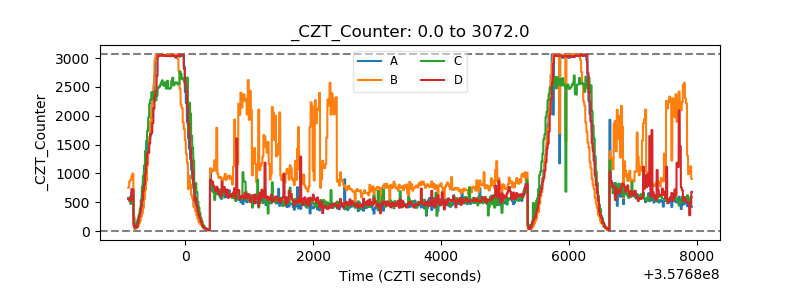 |
| +2.5 Volts monitor |  |
| +5 Volts monitor |  |
| _ROLL_ROT |  |
| _Roll_DEC | 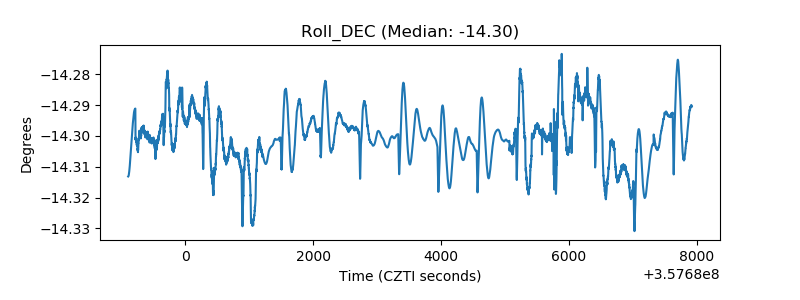 |
| _Roll_RA | 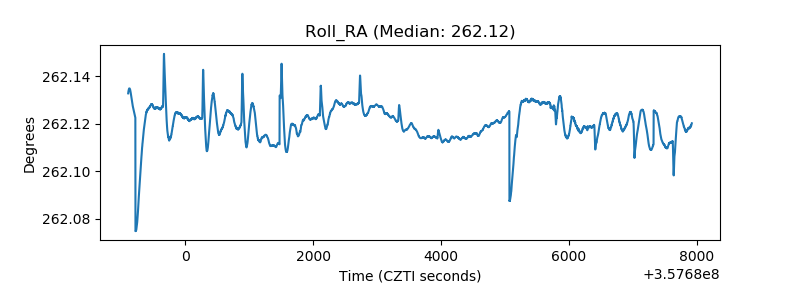 |
| Veto Counter |  |