| Param | Original file | Final file |
|---|---|---|
| Filename | modeM0/AS1A10_007T01_9000004350_30252cztM0_level2.evt | modeM0/AS1A10_007T01_9000004350_30252cztM0_level2_quad_clean.evt |
| Size (bytes) | 609,045,120 | 109,117,440 |
| Size | 580.8 MB | 104.1 MB |
| Events in quadrant A | 3,242,589 | 731,931 |
| Events in quadrant B | 6,764,924 | 707,222 |
| Events in quadrant C | 3,378,740 | 737,199 |
| Events in quadrant D | 4,645,346 | 701,088 |
| Mode M9 | |||
|---|---|---|---|
| Quadrant | BADHDUFLAG | Total packets | Discarded packets |
| A | 0 | 19 | 0 |
| B | 0 | 20 | 0 |
| C | 0 | 20 | 0 |
| D | 0 | 20 | 0 |
| Mode SS | |||
|---|---|---|---|
| Quadrant | BADHDUFLAG | Total packets | Discarded packets |
| A | 0 | 124 | 0 |
| B | 0 | 124 | 0 |
| C | 0 | 124 | 0 |
| D | 0 | 124 | 0 |
| Mode M0 | |||
|---|---|---|---|
| Quadrant | BADHDUFLAG | Total packets | Discarded packets |
| A | 0 | 13332 | 2 |
| B | 0 | 24155 | 2 |
| C | 0 | 13804 | 2 |
| D | 0 | 17959 | 2 |
| Quadrant | Total seconds | Saturated seconds | Saturation percentage |
|---|---|---|---|
| A | 6117 | 40 | 0.653915% |
| B | 6117 | 878 | 14.353441% |
| C | 6117 | 90 | 1.471309% |
| D | 6117 | 215 | 3.514795% |
Noise dominated data is calculated using 1-second bins in cleaned event files. If a bin has >2000 counts, and if more than 50% of those come from <1% of pixels, then it is considered to be noise-dominated and hence unusable.
| Quadrant | # 1 sec bins | Bins with >0 counts | Bins with >2000 counts | High rate bins dominated by noise | Noise dominated (total time) | Noise dominated (detector-on time) | Marked lightcurve |
|---|---|---|---|---|---|---|---|
| A | 7477 | 6118 | 4 | 4 | 0.05% | 0.07% | 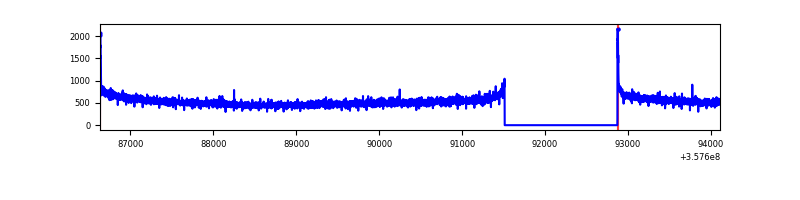 |
| B | 7477 | 6118 | 627 | 627 | 8.39% | 10.25% | 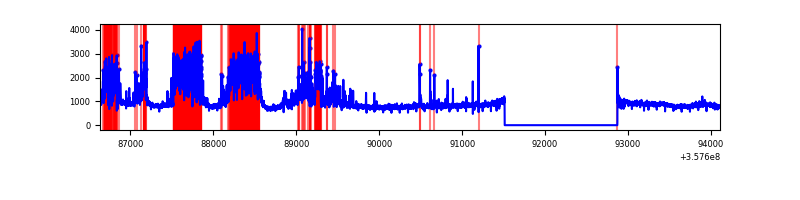 |
| C | 7477 | 6118 | 0 | 0 | 0.00% | 0.00% | 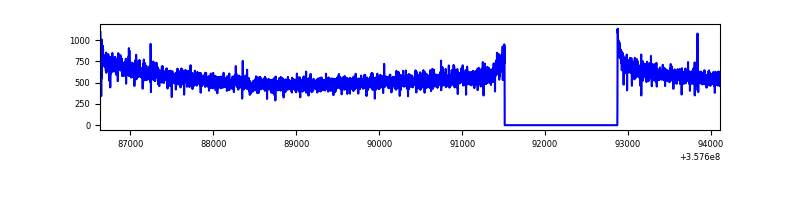 |
| D | 7477 | 6118 | 148 | 148 | 1.98% | 2.42% | 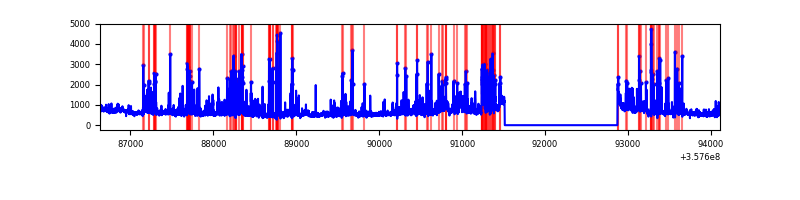 |
Top three noisy pixels from each quadrant. If the there are fewer than three noisy pixels in the level2.evt file, extra rows are filled as -1
| Pixel properties | Quadrant properties | ||||||
|---|---|---|---|---|---|---|---|
| Quadrant | DetID | PixID | Counts | Sigma | Mean | Median | Sigma |
| A | 8 | 192 | 23215 | 135.54 | 833 | 817 | 165.3 |
| A | 13 | 254 | 11151 | 62.54 | 833 | 817 | 165.3 |
| A | 3 | 137 | 7625 | 41.2 | 833 | 817 | 165.3 |
| B | 6 | 36 | 1885028 | 12604.8 | 806 | 788 | 149.5 |
| B | 6 | 159 | 1658377 | 11088.6 | 806 | 788 | 149.5 |
| B | 4 | 80 | 51095 | 336.53 | 806 | 788 | 149.5 |
| C | 14 | 238 | 137734 | 713.25 | 823 | 833 | 191.9 |
| C | 3 | 233 | 14962 | 73.61 | 823 | 833 | 191.9 |
| C | 2 | 114 | 14348 | 70.41 | 823 | 833 | 191.9 |
| D | 1 | 52 | 1140121 | 6008.44 | 806 | 793 | 189.6 |
| D | 8 | 195 | 292554 | 1538.65 | 806 | 793 | 189.6 |
| D | 13 | 104 | 59200 | 308.02 | 806 | 793 | 189.6 |
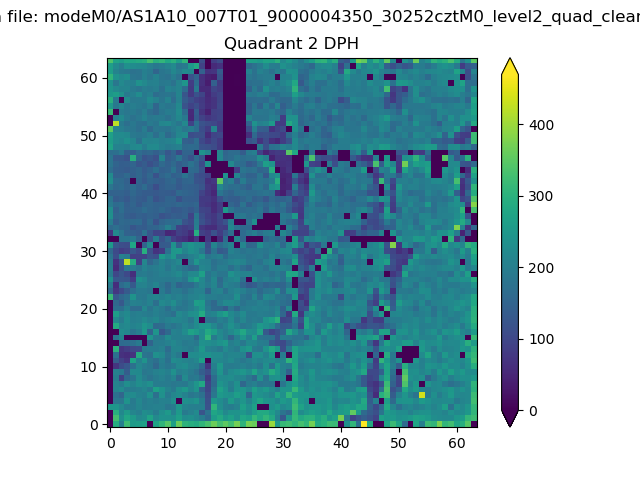
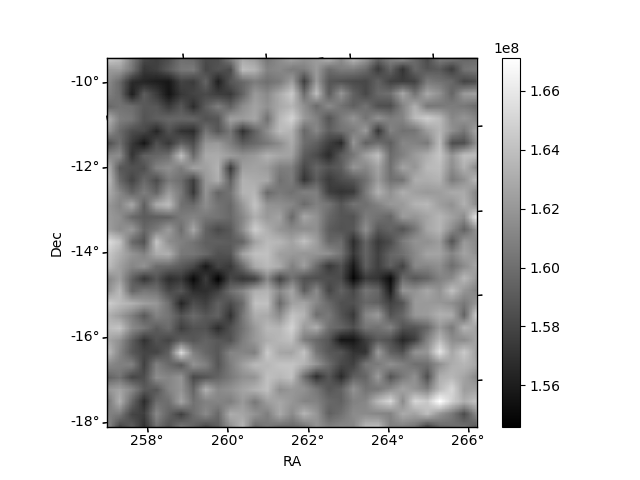
Histogram calculated using DETX and DETY for each event in the final _common_clean file
| Quadrant A | 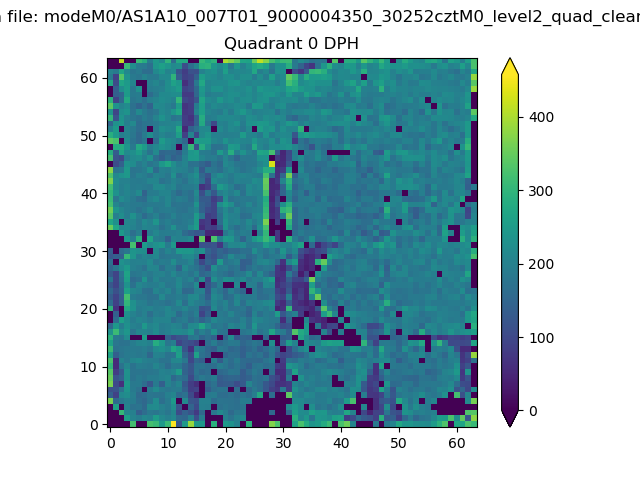 |
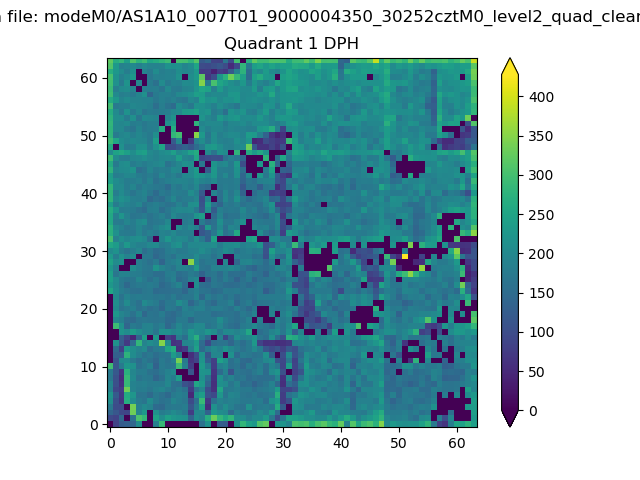 |
Quadrant B |
|---|---|---|---|
| Quadrant D | 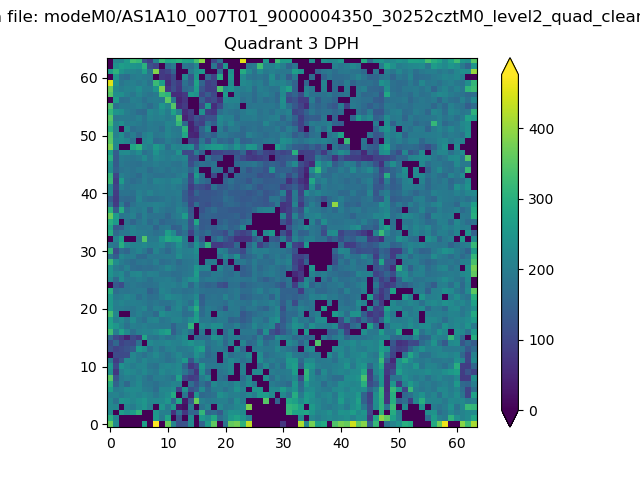 |
 |
Quadrant C |
| Plot type | Count rate plots | Images |
|---|---|---|
| Comparison with Poisson distribution Blue bars denote a histogram of data divided into 1 sec bins. Red curve is a Poisson curve with rate = median count rate of data. |
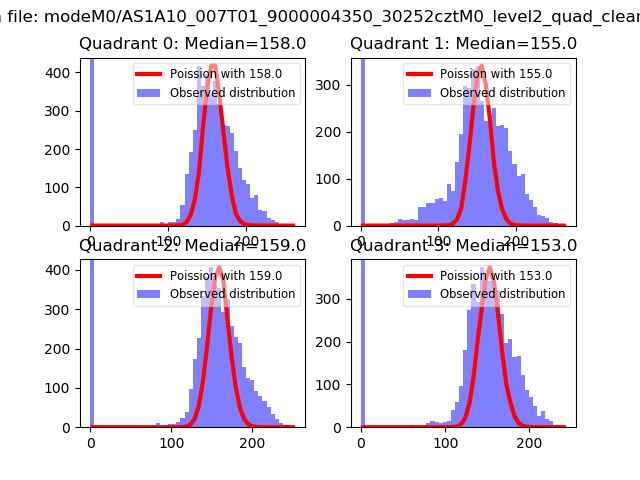 |
 |
| Quadrant-wise count rates Data is divided into 100 sec bins |
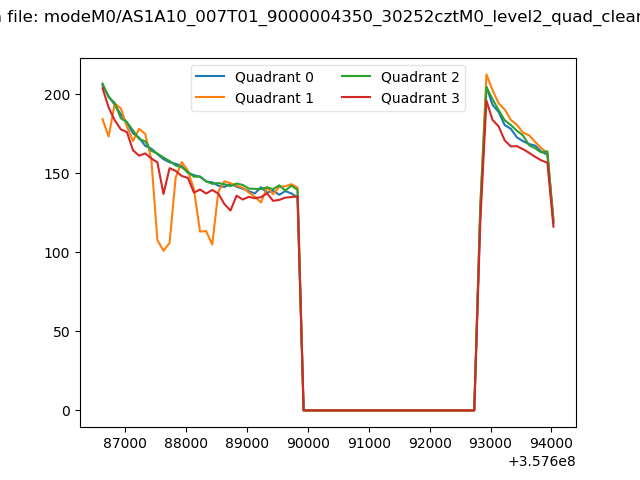 |
|
| Module-wise count rates for Quadrant A Data is divided into 100 sec bins |
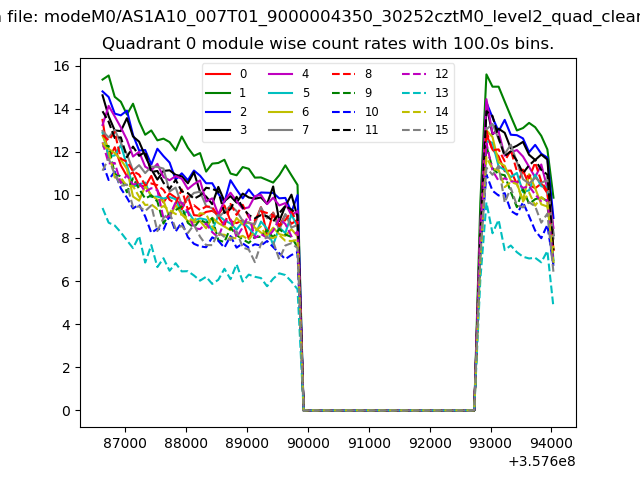 |
 |
| Module-wise count rates for Quadrant B Data is divided into 100 sec bins |
 |
 |
| Module-wise count rates for Quadrant C Data is divided into 100 sec bins |
 |
 |
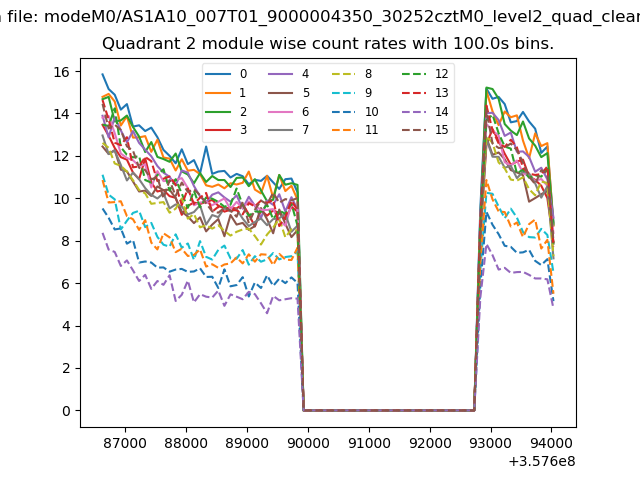
| Module-wise count rates for Quadrant D Data is divided into 100 sec bins |
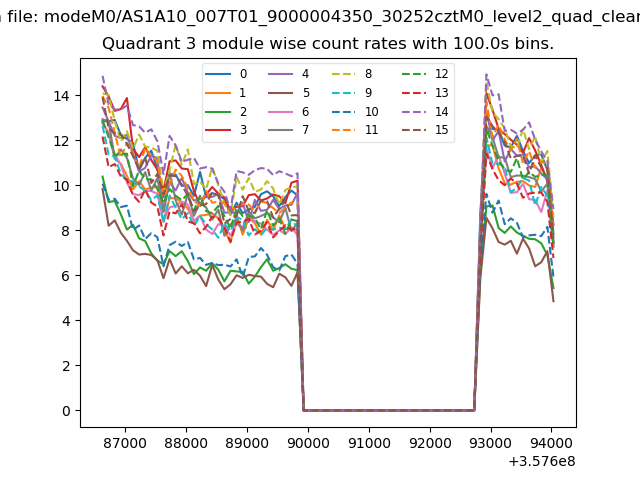 |
 |
| Parameter | Plot |
|---|---|
| CZT HV Monitor | 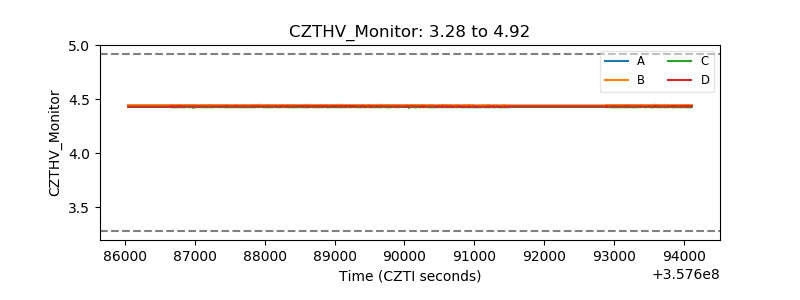 |
| D_VDD | 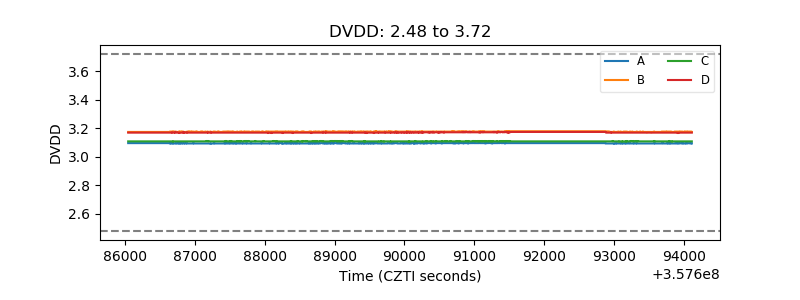 |
| Temperature 1 | 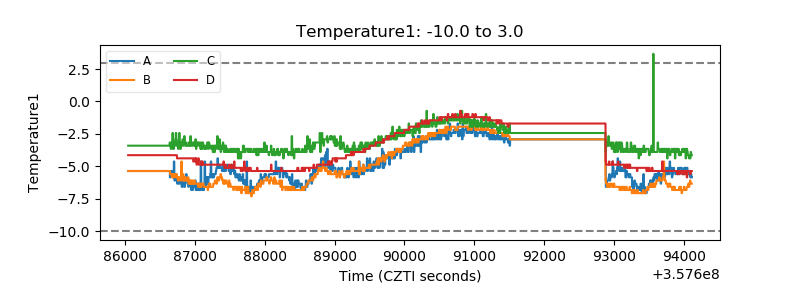 |
| Veto HV Monitor | 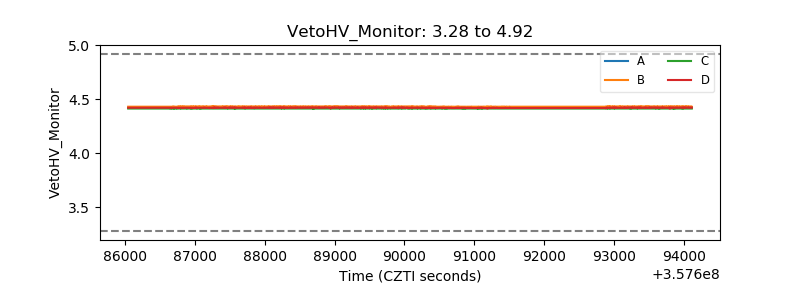 |
| Veto LLD | 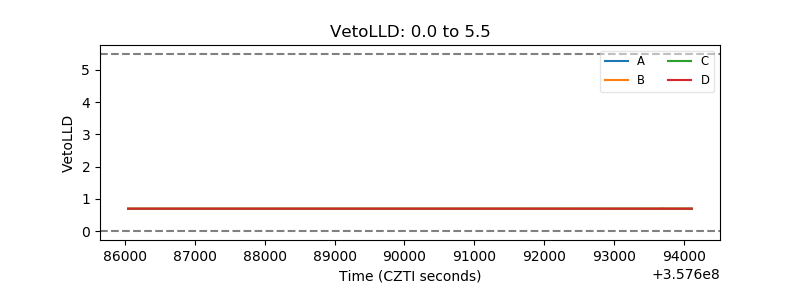 |
| Alpha Counter | 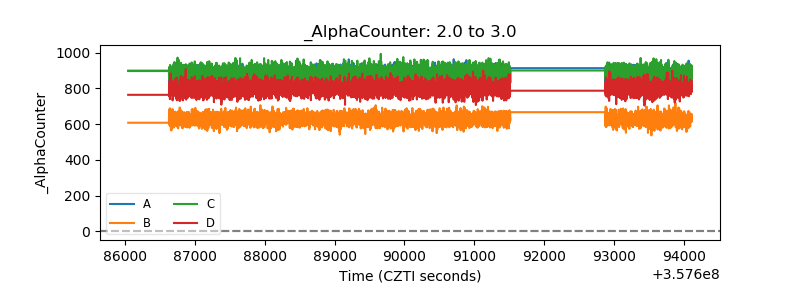 |
| _CPM_Rate |  |
| CZT Counter | 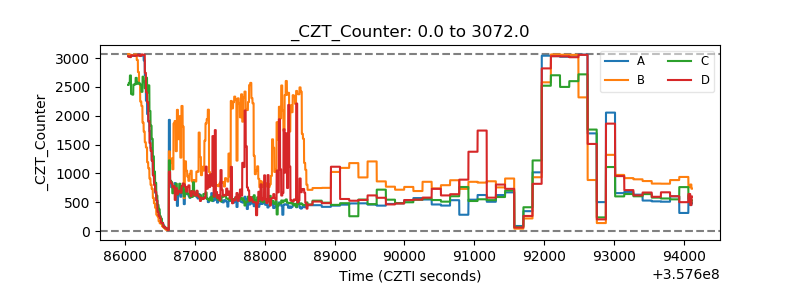 |
| +2.5 Volts monitor | 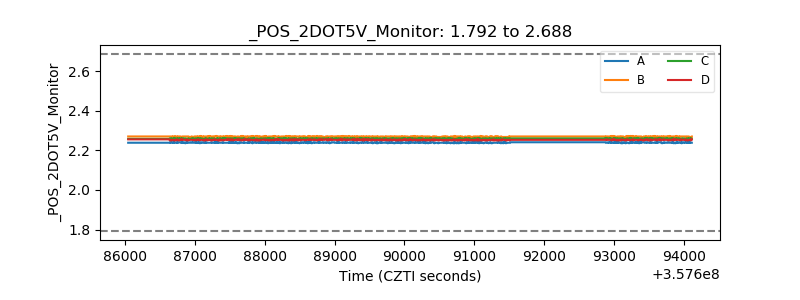 |
| +5 Volts monitor |  |
| _ROLL_ROT | 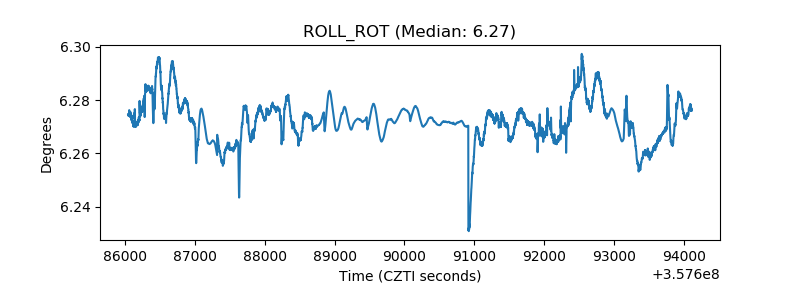 |
| _Roll_DEC | 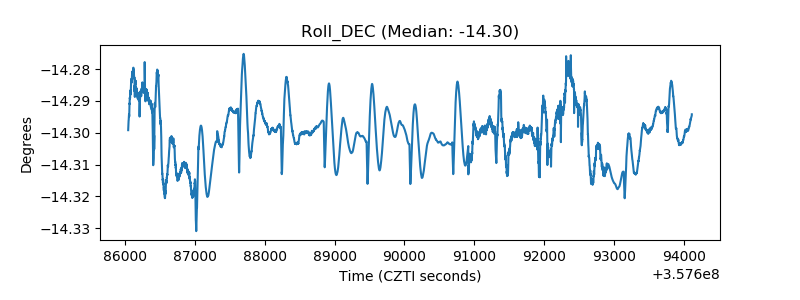 |
| _Roll_RA | 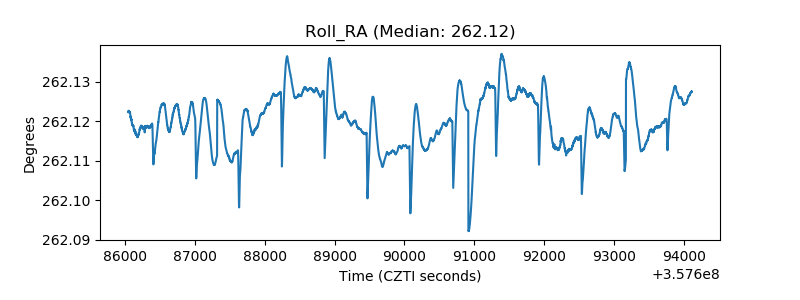 |
| Veto Counter | 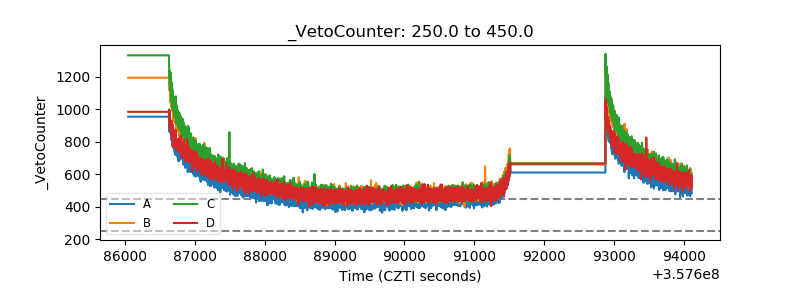 |