| Param | Original file | Final file |
|---|---|---|
| Filename | modeM0/AS1A10_007T01_9000004350_30253cztM0_level2.evt | modeM0/AS1A10_007T01_9000004350_30253cztM0_level2_quad_clean.evt |
| Size (bytes) | 610,191,360 | 113,549,760 |
| Size | 581.9 MB | 108.3 MB |
| Events in quadrant A | 3,580,529 | 747,696 |
| Events in quadrant B | 5,427,492 | 764,638 |
| Events in quadrant C | 3,654,856 | 747,350 |
| Events in quadrant D | 5,370,779 | 719,494 |
| Mode M9 | |||
|---|---|---|---|
| Quadrant | BADHDUFLAG | Total packets | Discarded packets |
| A | 0 | 22 | 0 |
| B | 0 | 23 | 0 |
| C | 0 | 23 | 0 |
| D | 0 | 23 | 0 |
| Mode SS | |||
|---|---|---|---|
| Quadrant | BADHDUFLAG | Total packets | Discarded packets |
| A | 0 | 132 | 0 |
| B | 0 | 132 | 0 |
| C | 0 | 132 | 0 |
| D | 0 | 132 | 0 |
| Mode M0 | |||
|---|---|---|---|
| Quadrant | BADHDUFLAG | Total packets | Discarded packets |
| A | 0 | 14539 | 2 |
| B | 0 | 20473 | 2 |
| C | 0 | 14781 | 2 |
| D | 0 | 20243 | 2 |
| Quadrant | Total seconds | Saturated seconds | Saturation percentage |
|---|---|---|---|
| A | 6602 | 84 | 1.272342% |
| B | 6601 | 170 | 2.575367% |
| C | 6601 | 143 | 2.166338% |
| D | 6601 | 453 | 6.862597% |
Noise dominated data is calculated using 1-second bins in cleaned event files. If a bin has >2000 counts, and if more than 50% of those come from <1% of pixels, then it is considered to be noise-dominated and hence unusable.
| Quadrant | # 1 sec bins | Bins with >0 counts | Bins with >2000 counts | High rate bins dominated by noise | Noise dominated (total time) | Noise dominated (detector-on time) | Marked lightcurve |
|---|---|---|---|---|---|---|---|
| A | 7952 | 6603 | 15 | 15 | 0.19% | 0.23% | 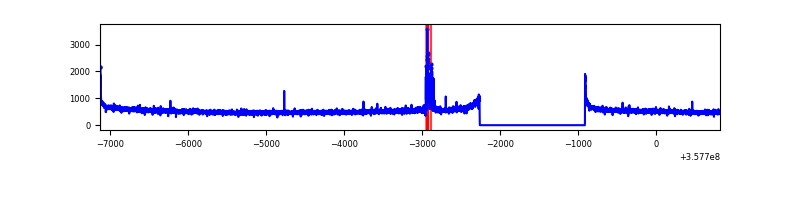 |
| B | 7951 | 6602 | 16 | 16 | 0.20% | 0.24% | 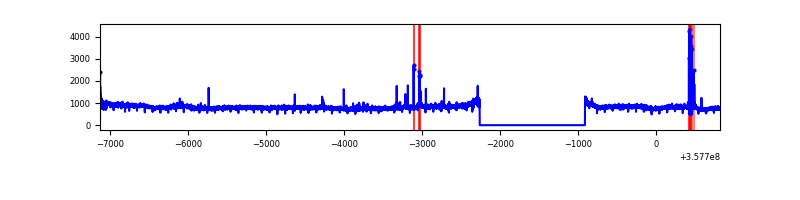 |
| C | 7951 | 6602 | 0 | 0 | 0.00% | 0.00% | 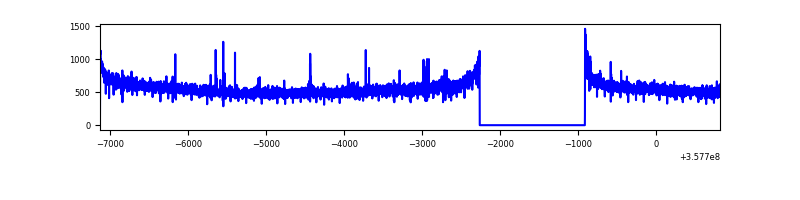 |
| D | 7951 | 6602 | 338 | 338 | 4.25% | 5.12% | 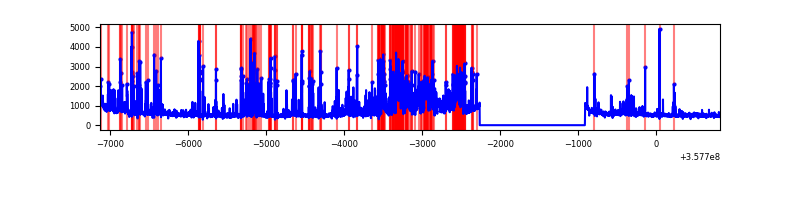 |
Top three noisy pixels from each quadrant. If the there are fewer than three noisy pixels in the level2.evt file, extra rows are filled as -1
| Pixel properties | Quadrant properties | ||||||
|---|---|---|---|---|---|---|---|
| Quadrant | DetID | PixID | Counts | Sigma | Mean | Median | Sigma |
| A | 0 | 13 | 87073 | 491.25 | 897 | 882 | 175.5 |
| A | 8 | 192 | 22260 | 121.84 | 897 | 882 | 175.5 |
| A | 13 | 254 | 12110 | 63.99 | 897 | 882 | 175.5 |
| B | 6 | 159 | 1835339 | 10938.87 | 893 | 873 | 167.7 |
| B | 4 | 80 | 49340 | 289.01 | 893 | 873 | 167.7 |
| B | 6 | 36 | 26025 | 149.98 | 893 | 873 | 167.7 |
| C | 14 | 238 | 153147 | 742.32 | 879 | 888 | 205.1 |
| C | 3 | 233 | 46110 | 220.48 | 879 | 888 | 205.1 |
| C | 14 | 254 | 17096 | 79.02 | 879 | 888 | 205.1 |
| D | 1 | 52 | 1746795 | 8707.46 | 860 | 846 | 200.5 |
| D | 8 | 195 | 219753 | 1091.74 | 860 | 846 | 200.5 |
| D | 5 | 222 | 62570 | 307.83 | 860 | 846 | 200.5 |
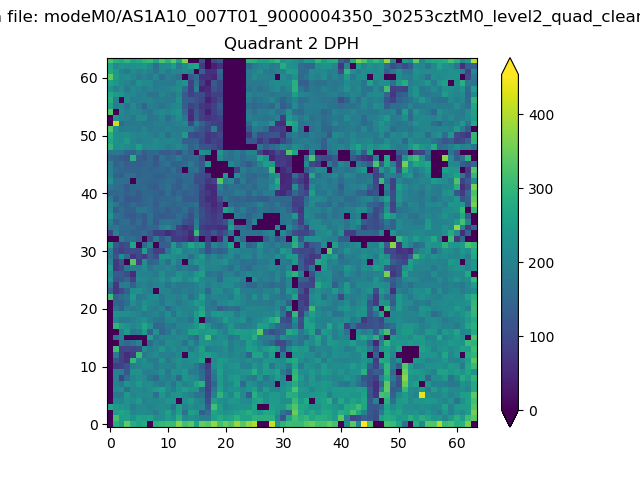
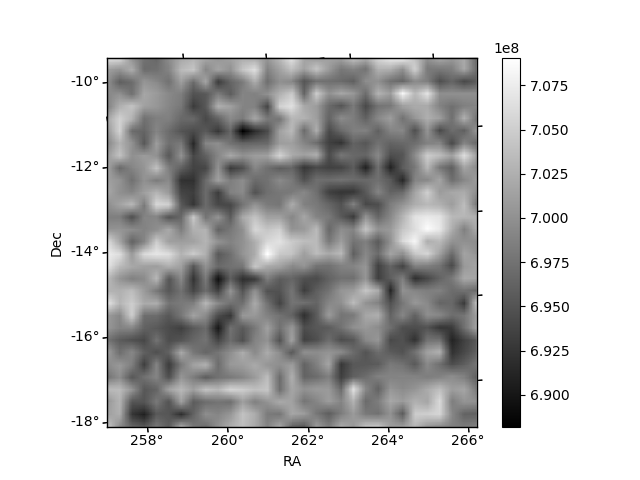
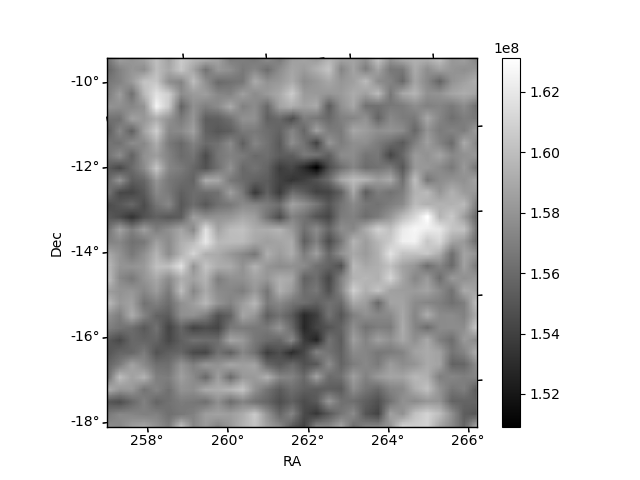
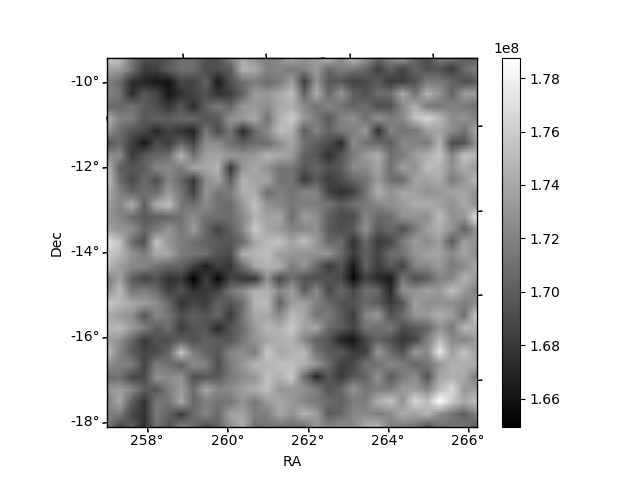
Histogram calculated using DETX and DETY for each event in the final _common_clean file
| Quadrant A | 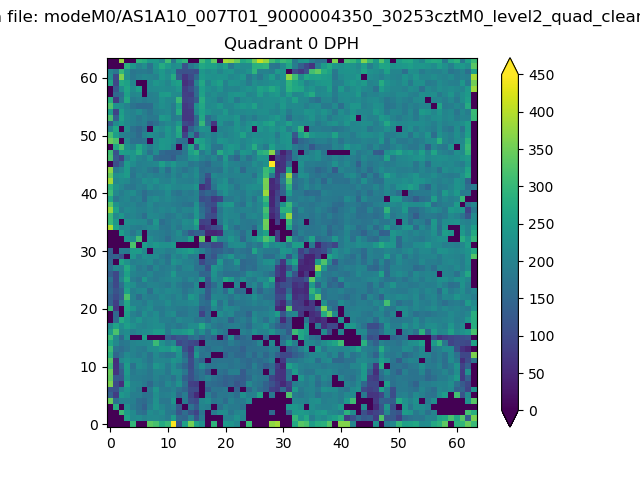 |
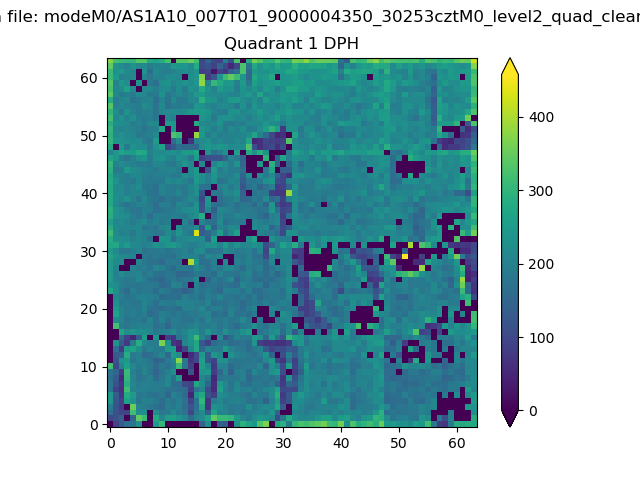 |
Quadrant B |
|---|---|---|---|
| Quadrant D | 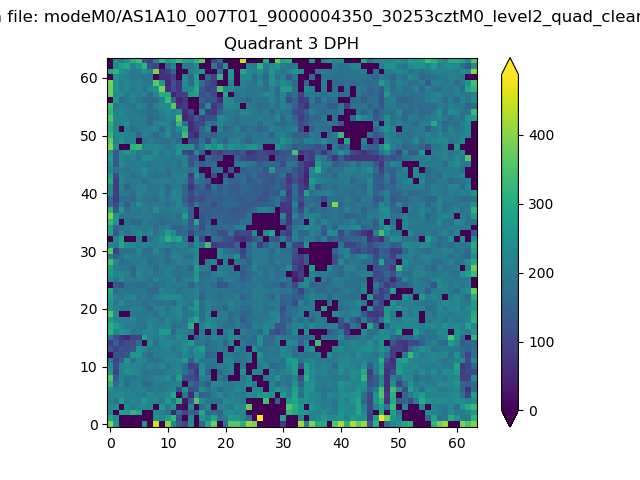 |
 |
Quadrant C |
| Plot type | Count rate plots | Images |
|---|---|---|
| Comparison with Poisson distribution Blue bars denote a histogram of data divided into 1 sec bins. Red curve is a Poisson curve with rate = median count rate of data. |
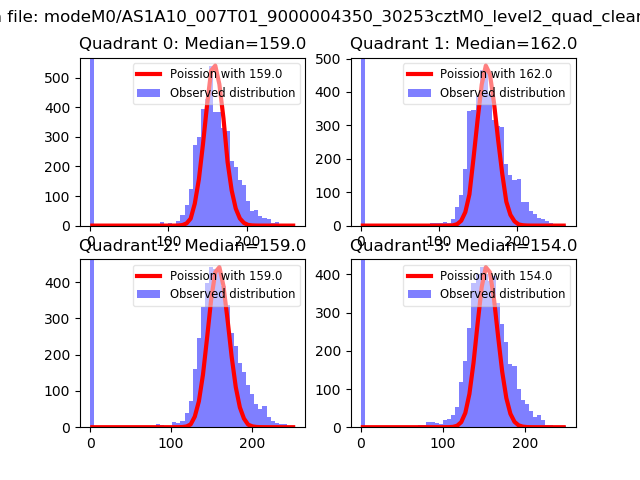 |
 |
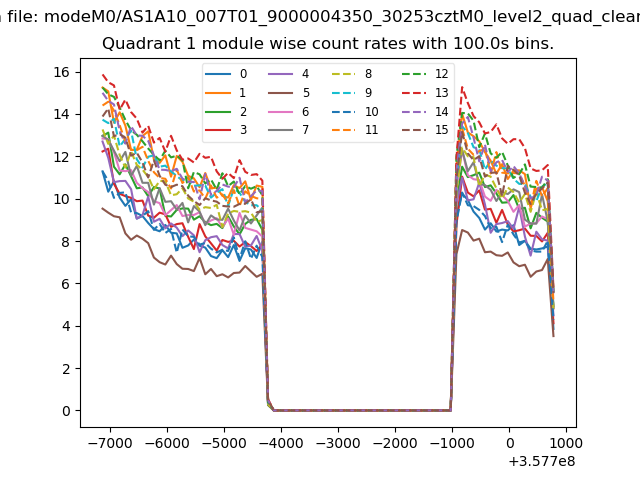
| Quadrant-wise count rates Data is divided into 100 sec bins |
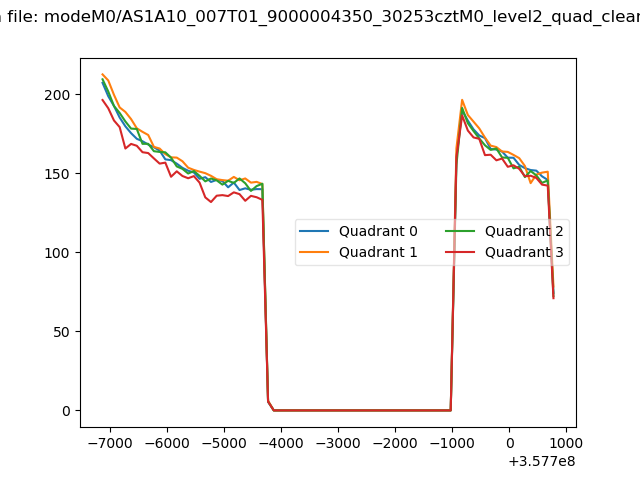 |
|
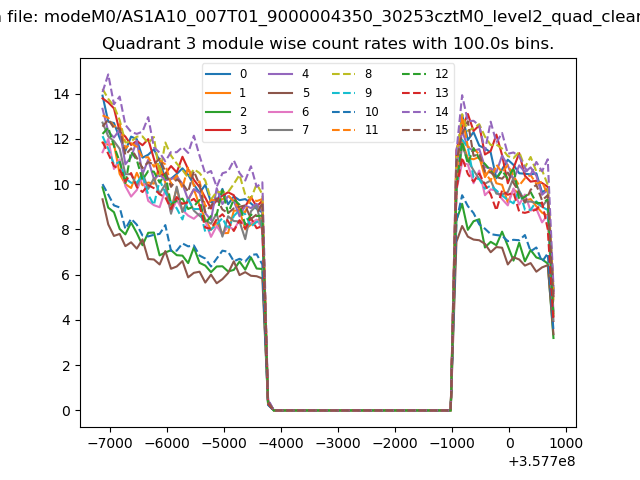
| Module-wise count rates for Quadrant A Data is divided into 100 sec bins |
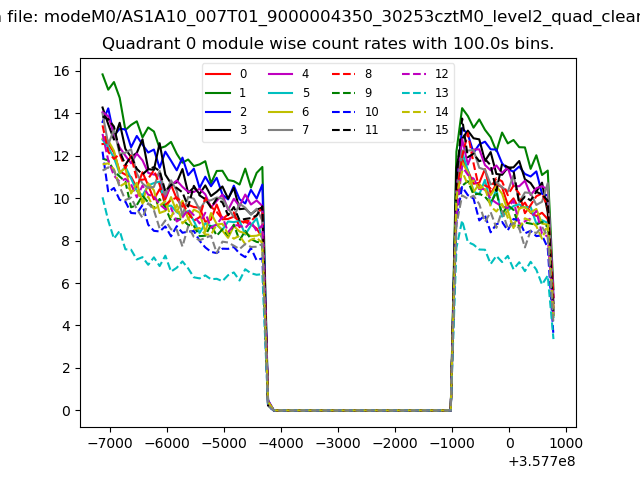 |
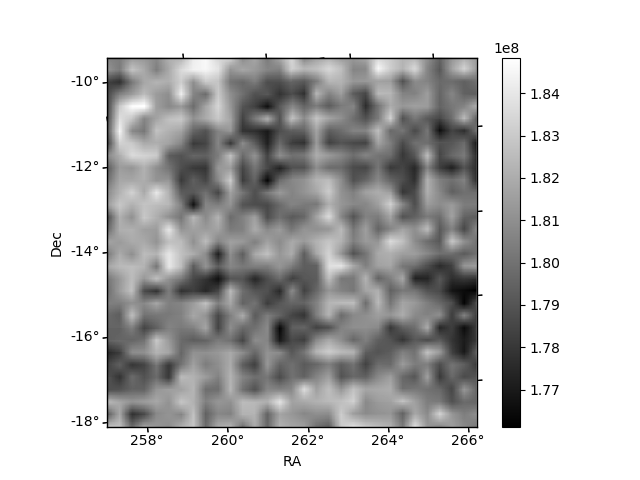 |
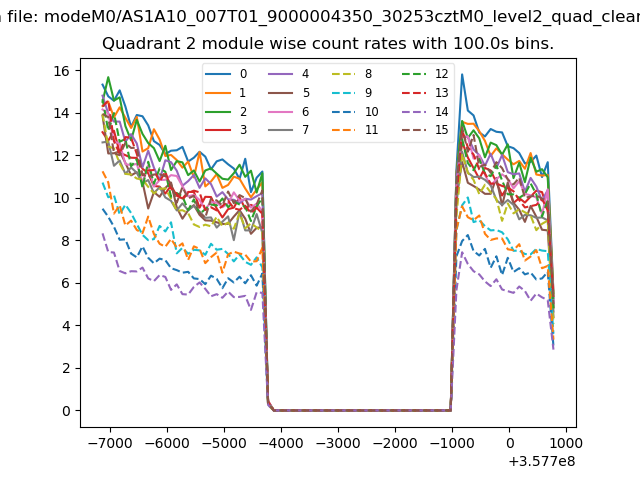
| Module-wise count rates for Quadrant B Data is divided into 100 sec bins |
 |
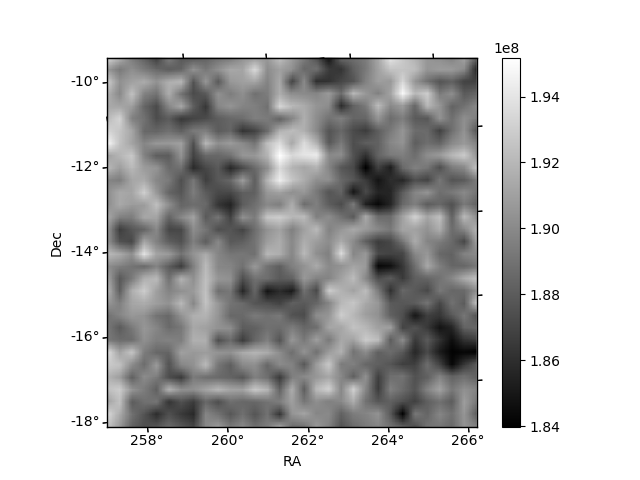 |
| Module-wise count rates for Quadrant C Data is divided into 100 sec bins |
 |
 |
| Module-wise count rates for Quadrant D Data is divided into 100 sec bins |
 |
 |
| Parameter | Plot |
|---|---|
| CZT HV Monitor | 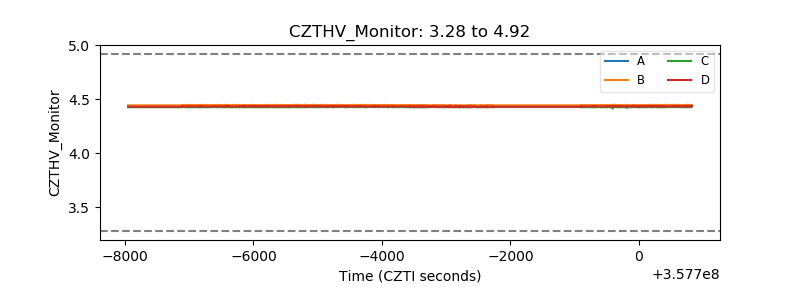 |
| D_VDD | 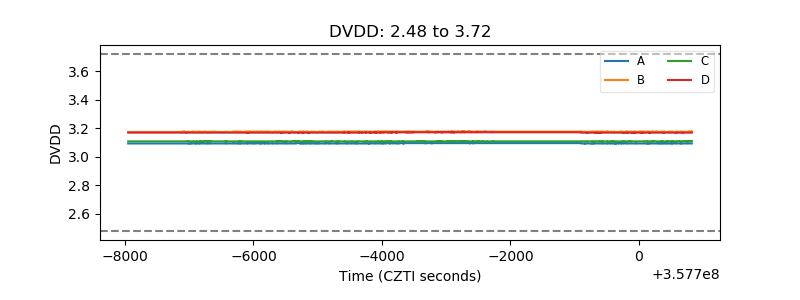 |
| Temperature 1 | 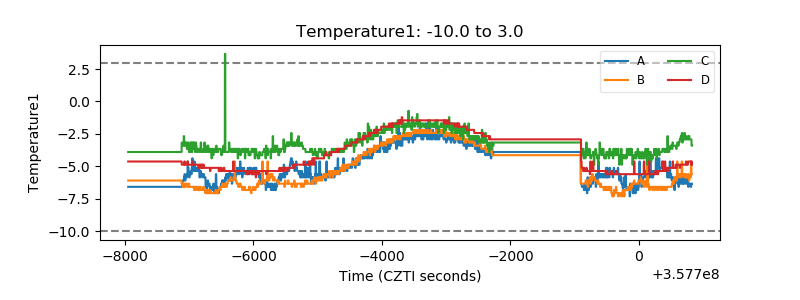 |
| Veto HV Monitor | 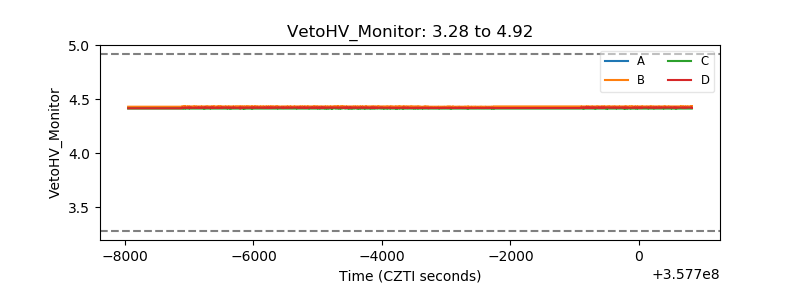 |
| Veto LLD | 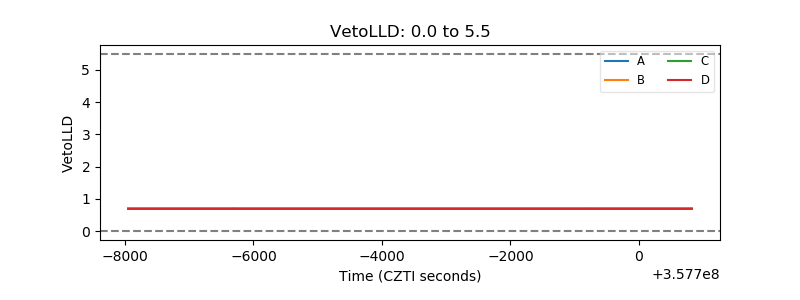 |
| Alpha Counter | 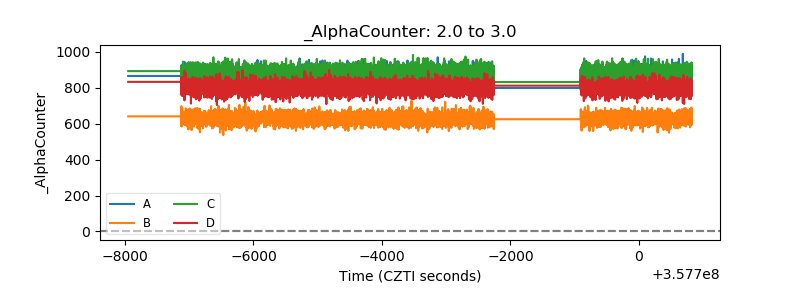 |
| _CPM_Rate | 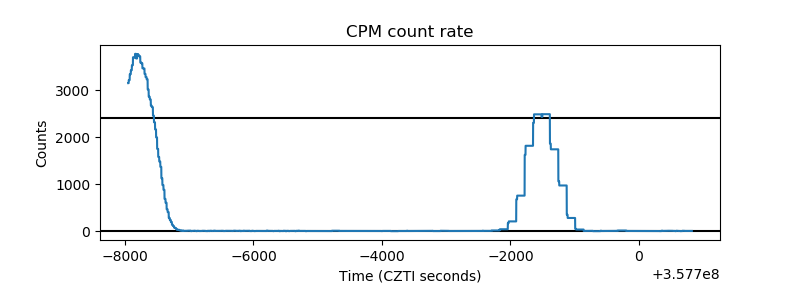 |
| CZT Counter | 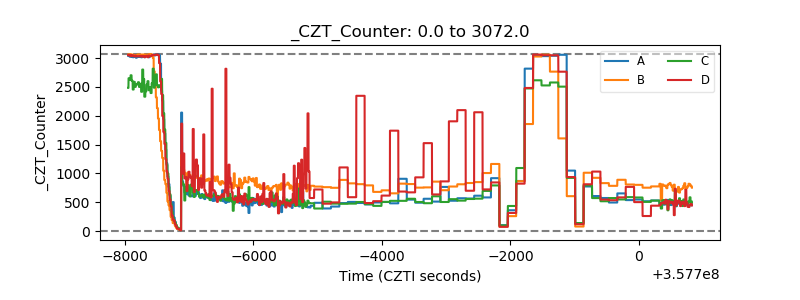 |
| +2.5 Volts monitor |  |
| +5 Volts monitor | 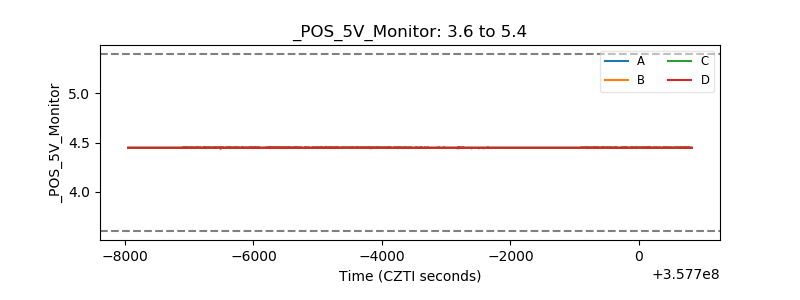 |
| _ROLL_ROT | 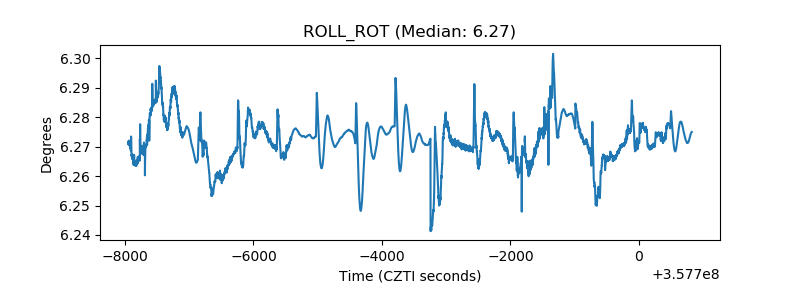 |
| _Roll_DEC | 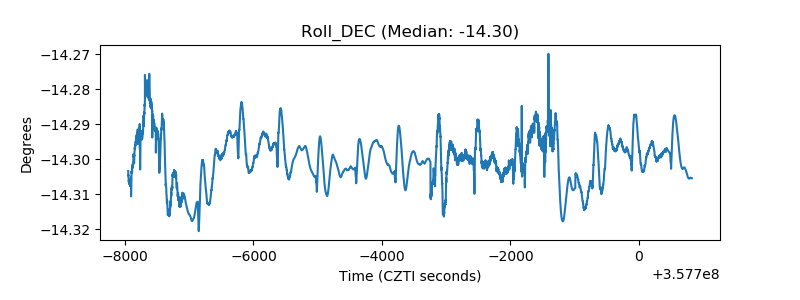 |
| _Roll_RA | 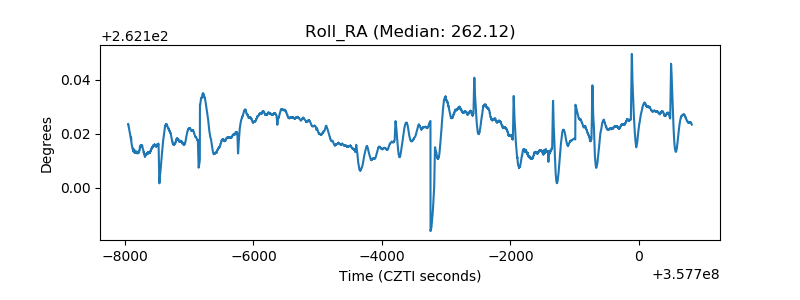 |
| Veto Counter | 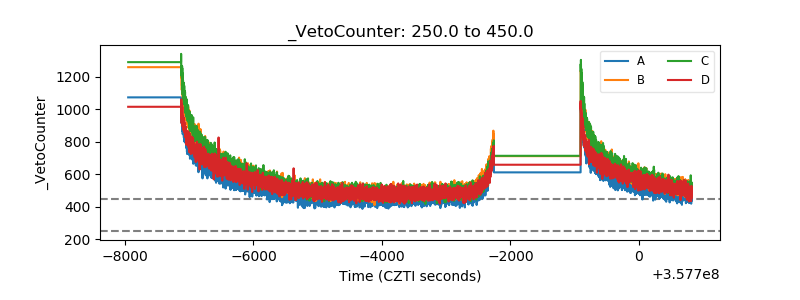 |