| Param | Original file | Final file |
|---|---|---|
| Filename | modeM0/AS1A10_007T01_9000004350_30256cztM0_level2.evt | modeM0/AS1A10_007T01_9000004350_30256cztM0_level2_quad_clean.evt |
| Size (bytes) | 794,695,680 | 93,579,840 |
| Size | 757.9 MB | 89.2 MB |
| Events in quadrant A | 7,021,192 | 545,111 |
| Events in quadrant B | 8,518,055 | 564,815 |
| Events in quadrant C | 3,606,721 | 615,399 |
| Events in quadrant D | 4,432,326 | 603,540 |
| Mode M9 | |||
|---|---|---|---|
| Quadrant | BADHDUFLAG | Total packets | Discarded packets |
| A | 0 | 6 | 0 |
| B | 0 | 6 | 0 |
| C | 0 | 6 | 0 |
| D | 0 | 6 | 0 |
| Mode SS | |||
|---|---|---|---|
| Quadrant | BADHDUFLAG | Total packets | Discarded packets |
| A | 0 | 146 | 0 |
| B | 0 | 146 | 0 |
| C | 0 | 146 | 0 |
| D | 0 | 146 | 0 |
| Mode M0 | |||
|---|---|---|---|
| Quadrant | BADHDUFLAG | Total packets | Discarded packets |
| A | 0 | 25553 | 2 |
| B | 0 | 30536 | 1 |
| C | 0 | 15024 | 1 |
| D | 0 | 17673 | 1 |
| Quadrant | Total seconds | Saturated seconds | Saturation percentage |
|---|---|---|---|
| A | 7239 | 1473 | 20.348114% |
| B | 7239 | 1620 | 22.378782% |
| C | 7240 | 159 | 2.196133% |
| D | 7240 | 149 | 2.058011% |
Noise dominated data is calculated using 1-second bins in cleaned event files. If a bin has >2000 counts, and if more than 50% of those come from <1% of pixels, then it is considered to be noise-dominated and hence unusable.
| Quadrant | # 1 sec bins | Bins with >0 counts | Bins with >2000 counts | High rate bins dominated by noise | Noise dominated (total time) | Noise dominated (detector-on time) | Marked lightcurve |
|---|---|---|---|---|---|---|---|
| A | 7789 | 7240 | 1207 | 1207 | 15.50% | 16.67% | 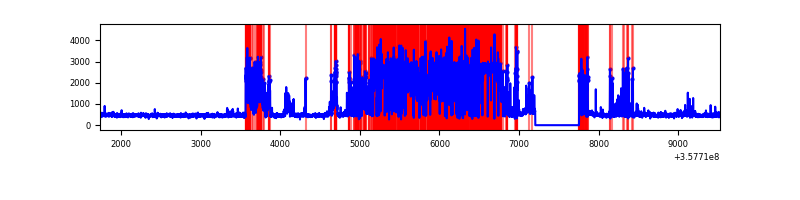 |
| B | 7788 | 7238 | 1073 | 1073 | 13.78% | 14.82% | 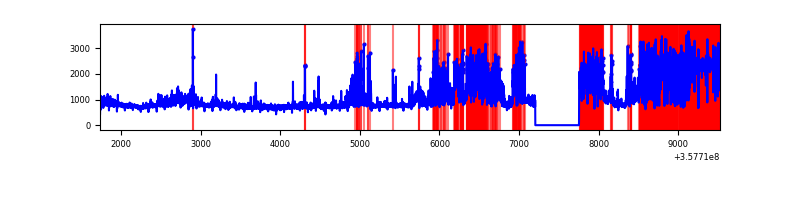 |
| C | 7790 | 7241 | 0 | 0 | 0.00% | 0.00% | 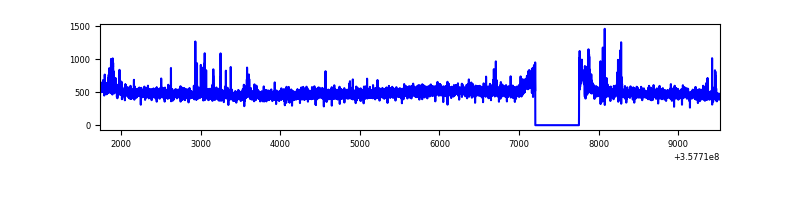 |
| D | 7790 | 7241 | 66 | 66 | 0.85% | 0.91% | 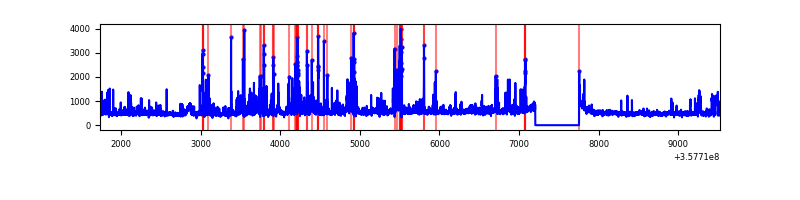 |
Top three noisy pixels from each quadrant. If the there are fewer than three noisy pixels in the level2.evt file, extra rows are filled as -1
| Pixel properties | Quadrant properties | ||||||
|---|---|---|---|---|---|---|---|
| Quadrant | DetID | PixID | Counts | Sigma | Mean | Median | Sigma |
| A | 14 | 239 | 3866733 | 23569.62 | 815 | 799 | 164.0 |
| A | 13 | 254 | 12273 | 69.95 | 815 | 799 | 164.0 |
| A | 8 | 192 | 8099 | 44.51 | 815 | 799 | 164.0 |
| B | 6 | 36 | 3417265 | 21784.23 | 807 | 786 | 156.8 |
| B | 6 | 159 | 1891647 | 12056.55 | 807 | 786 | 156.8 |
| B | 4 | 80 | 28961 | 179.65 | 807 | 786 | 156.8 |
| C | 14 | 238 | 167426 | 822.1 | 861 | 864 | 202.6 |
| C | 14 | 254 | 41456 | 200.35 | 861 | 864 | 202.6 |
| C | 3 | 233 | 30173 | 144.66 | 861 | 864 | 202.6 |
| D | 1 | 52 | 757362 | 3717.79 | 867 | 849 | 203.5 |
| D | 8 | 195 | 256468 | 1256.21 | 867 | 849 | 203.5 |
| D | 5 | 222 | 57849 | 280.12 | 867 | 849 | 203.5 |
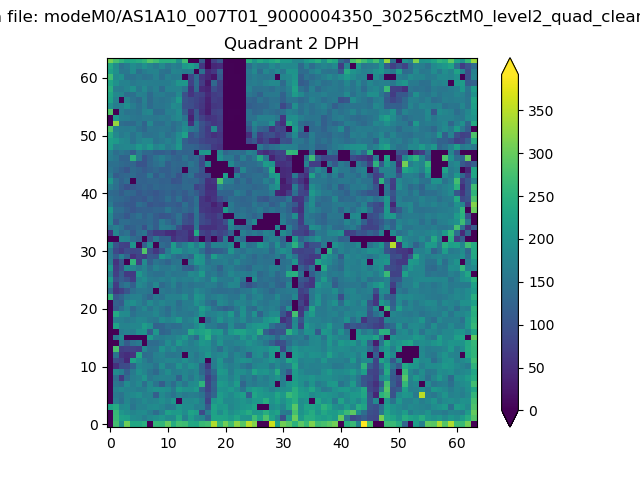
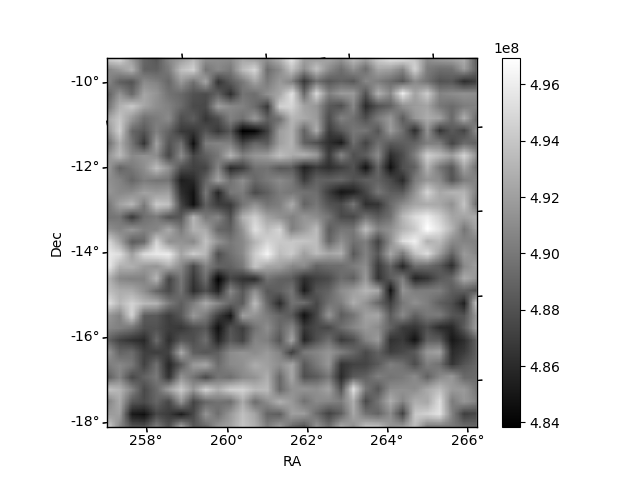
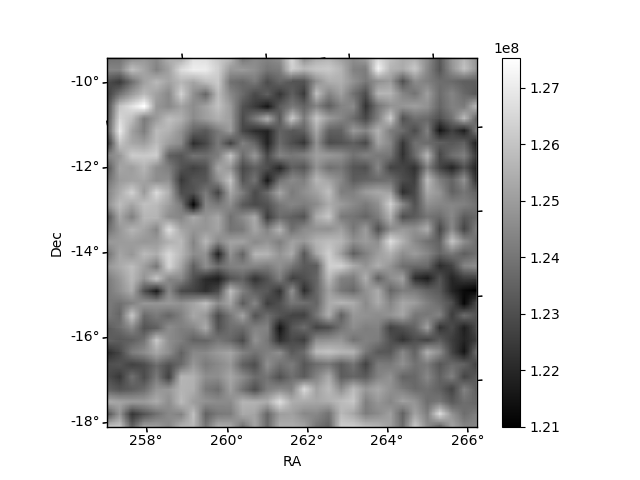
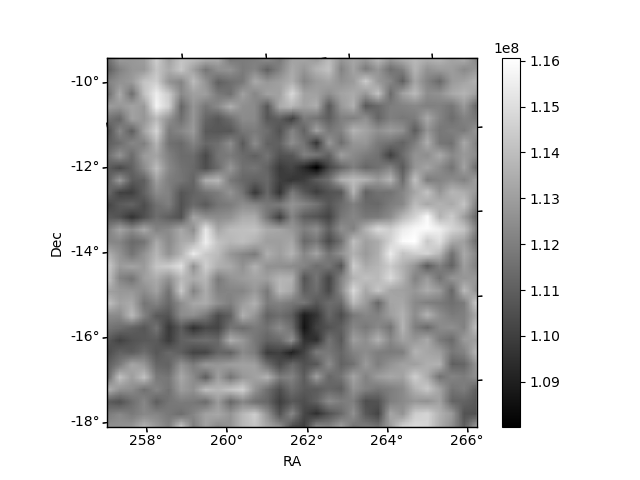
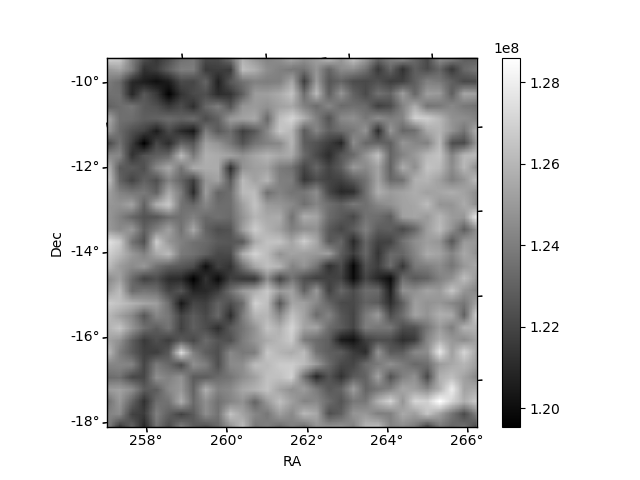
Histogram calculated using DETX and DETY for each event in the final _common_clean file
| Quadrant A | 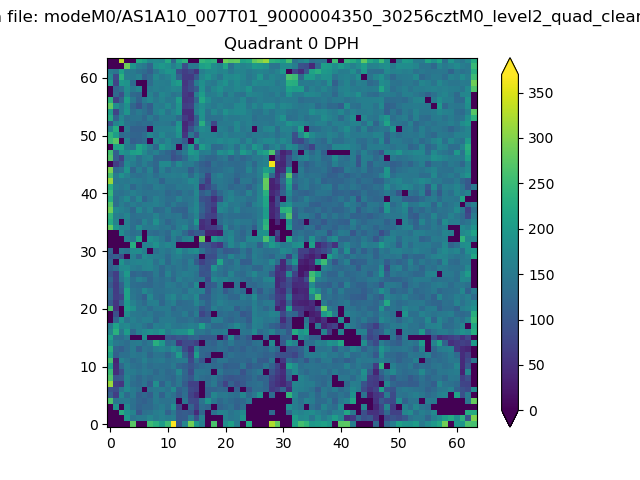 |
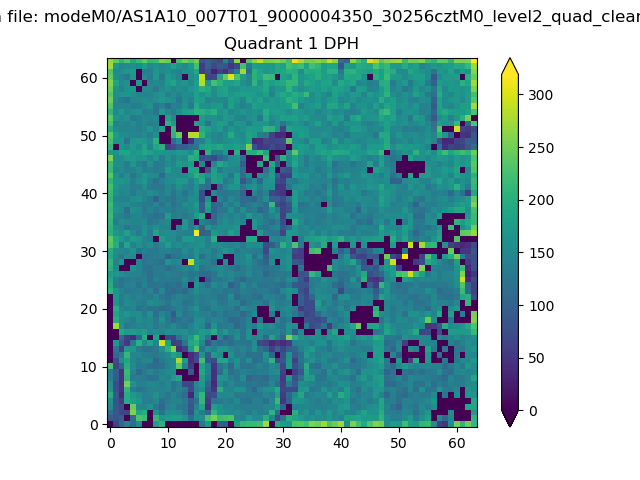 |
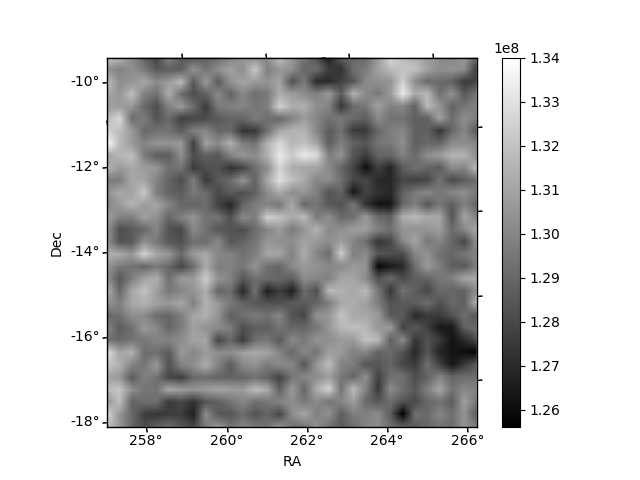
Quadrant B |
|---|---|---|---|
| Quadrant D | 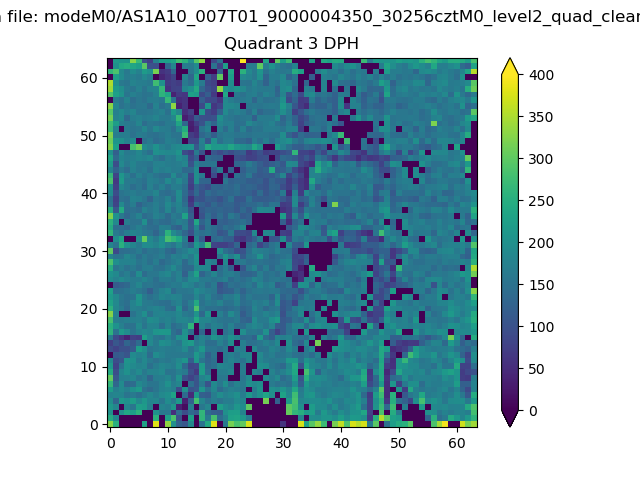 |
 |
Quadrant C |
| Plot type | Count rate plots | Images |
|---|---|---|
| Comparison with Poisson distribution Blue bars denote a histogram of data divided into 1 sec bins. Red curve is a Poisson curve with rate = median count rate of data. |
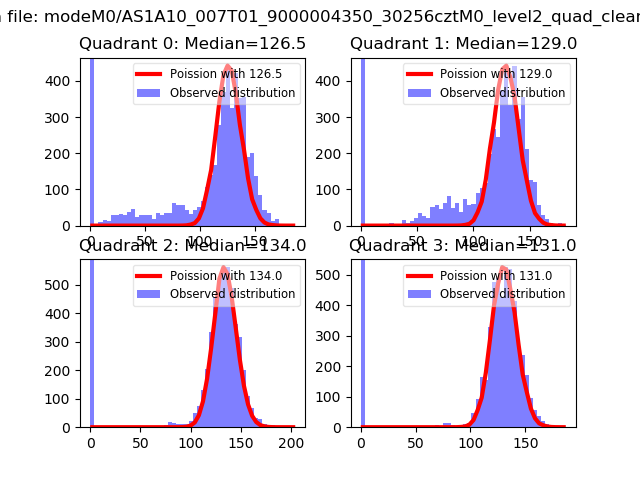 |
 |
| Quadrant-wise count rates Data is divided into 100 sec bins |
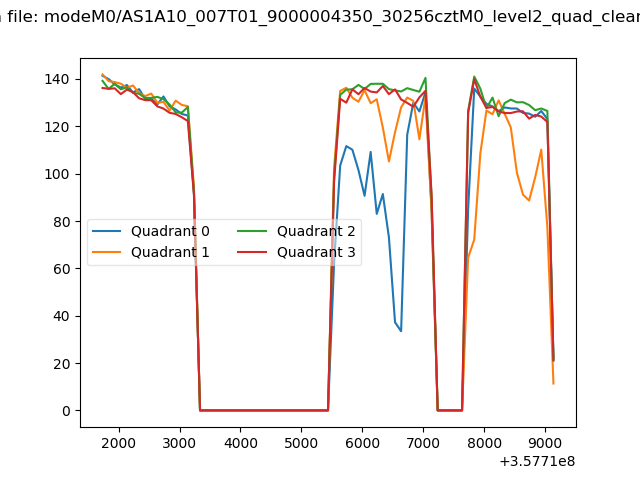 |
|
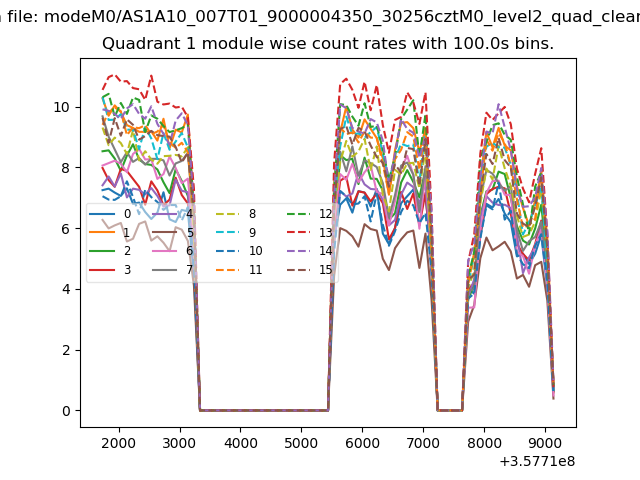
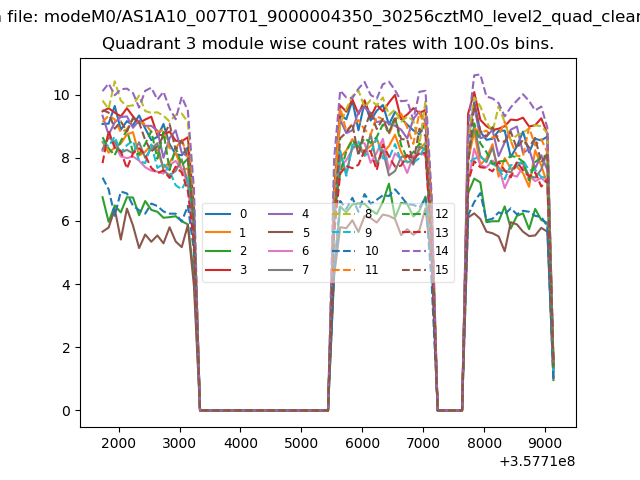
| Module-wise count rates for Quadrant A Data is divided into 100 sec bins |
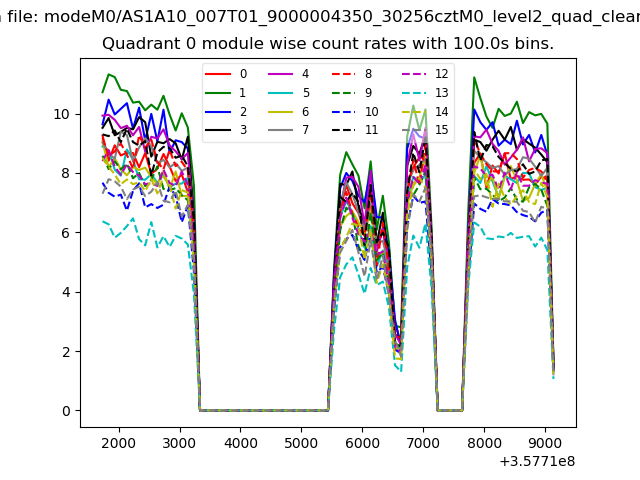 |
 |
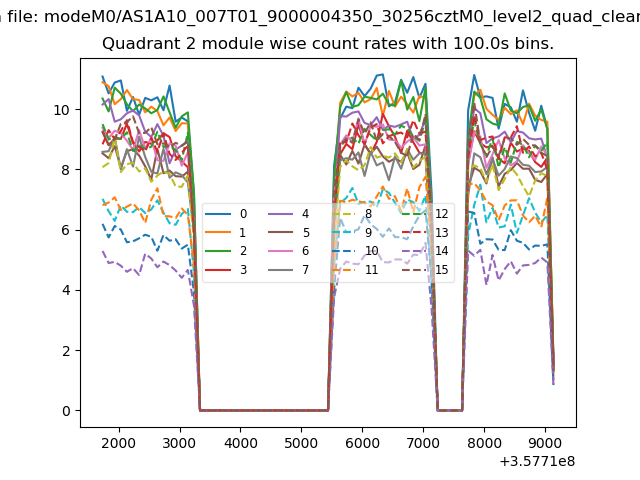
| Module-wise count rates for Quadrant B Data is divided into 100 sec bins |
 |
 |
| Module-wise count rates for Quadrant C Data is divided into 100 sec bins |
 |
 |
| Module-wise count rates for Quadrant D Data is divided into 100 sec bins |
 |
 |
| Parameter | Plot |
|---|---|
| CZT HV Monitor | 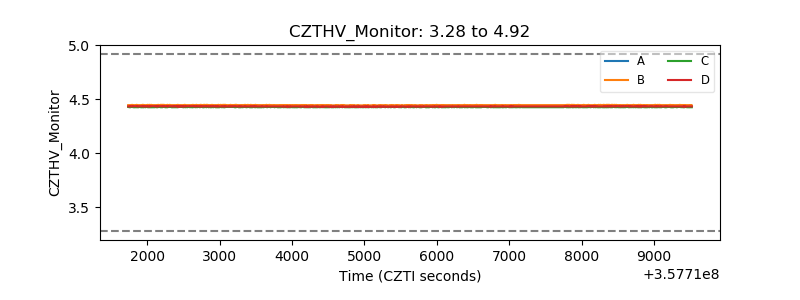 |
| D_VDD | 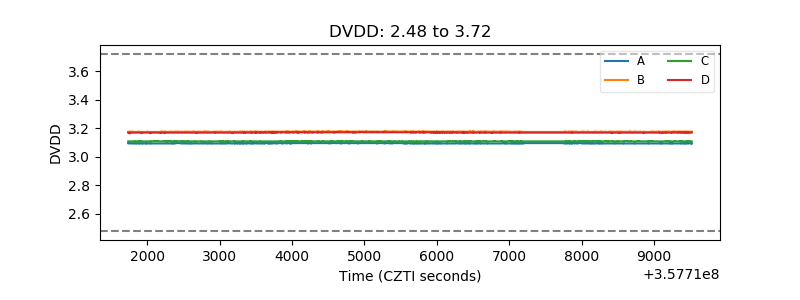 |
| Temperature 1 | 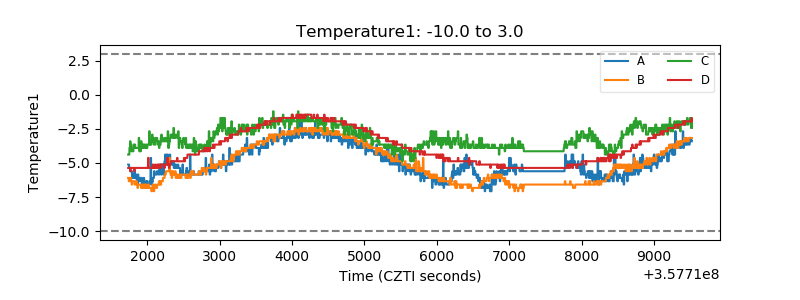 |
| Veto HV Monitor |  |
| Veto LLD | 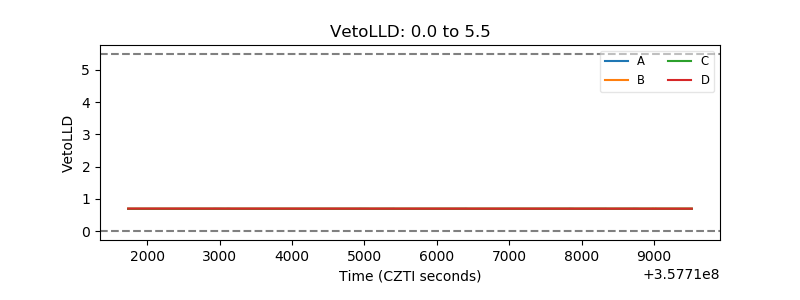 |
| Alpha Counter | 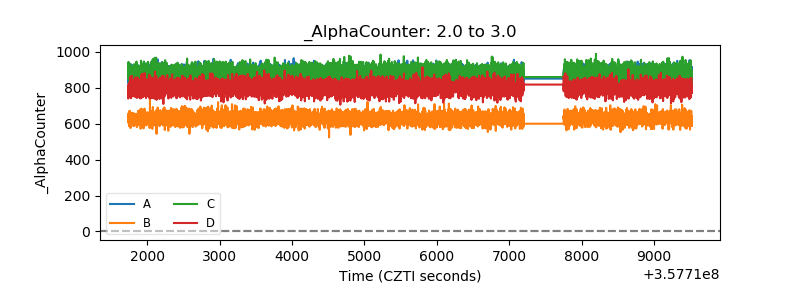 |
| _CPM_Rate | 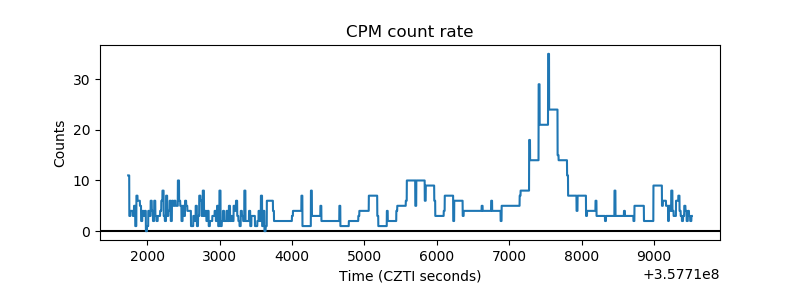 |
| CZT Counter | 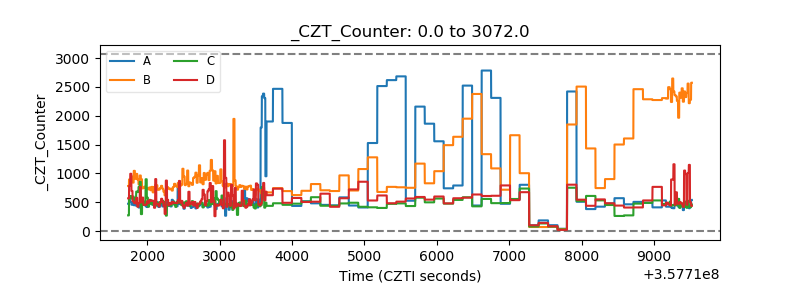 |
| +2.5 Volts monitor |  |
| +5 Volts monitor |  |
| _ROLL_ROT | 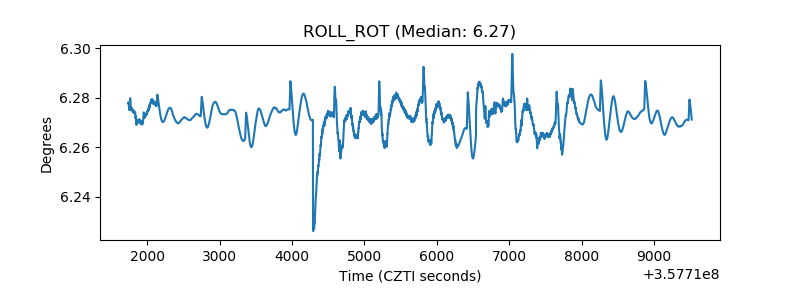 |
| _Roll_DEC | 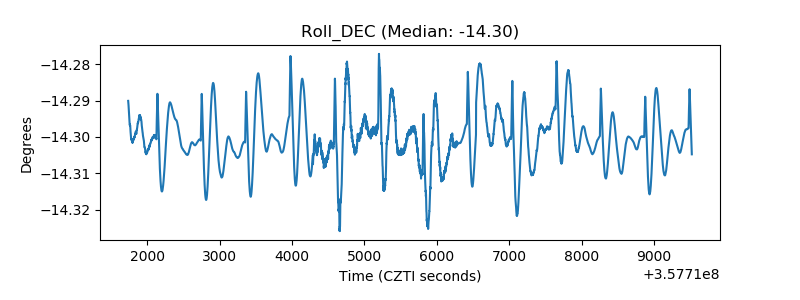 |
| _Roll_RA | 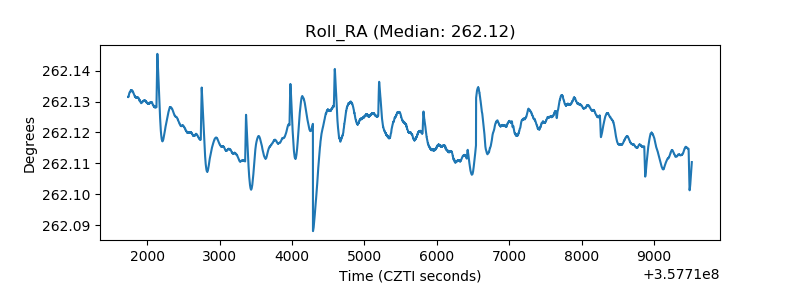 |
| Veto Counter | 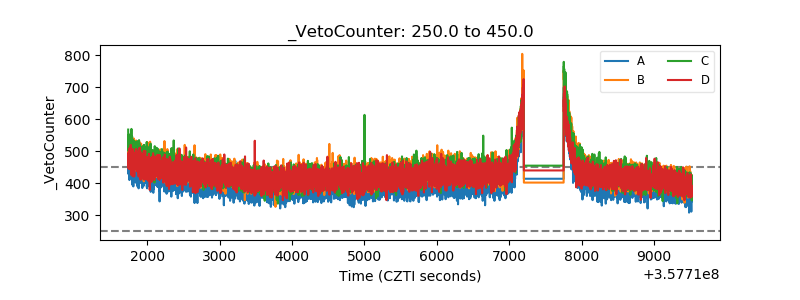 |