| Param | Original file | Final file |
|---|---|---|
| Filename | modeM0/AS1A10_007T01_9000004350_30257cztM0_level2.evt | modeM0/AS1A10_007T01_9000004350_30257cztM0_level2_quad_clean.evt |
| Size (bytes) | 938,315,520 | 75,787,200 |
| Size | 894.8 MB | 72.3 MB |
| Events in quadrant A | 3,578,208 | 527,413 |
| Events in quadrant B | 16,418,903 | 226,047 |
| Events in quadrant C | 3,622,836 | 522,194 |
| Events in quadrant D | 4,315,444 | 521,773 |
| Mode M9 | |||
|---|---|---|---|
| Quadrant | BADHDUFLAG | Total packets | Discarded packets |
| A | 0 | 1 | 0 |
| B | 0 | 1 | 0 |
| C | 0 | 1 | 0 |
| D | 0 | 1 | 0 |
| Mode SS | |||
|---|---|---|---|
| Quadrant | BADHDUFLAG | Total packets | Discarded packets |
| A | 0 | 142 | 0 |
| B | 0 | 142 | 0 |
| C | 0 | 142 | 0 |
| D | 0 | 142 | 0 |
| Mode M0 | |||
|---|---|---|---|
| Quadrant | BADHDUFLAG | Total packets | Discarded packets |
| A | 0 | 15092 | 1 |
| B | 0 | 53572 | 1 |
| C | 0 | 15107 | 1 |
| D | 0 | 17241 | 2 |
| Quadrant | Total seconds | Saturated seconds | Saturation percentage |
|---|---|---|---|
| A | 7119 | 242 | 3.399354% |
| B | 7120 | 6703 | 94.143258% |
| C | 7120 | 371 | 5.210674% |
| D | 7119 | 221 | 3.104369% |
Noise dominated data is calculated using 1-second bins in cleaned event files. If a bin has >2000 counts, and if more than 50% of those come from <1% of pixels, then it is considered to be noise-dominated and hence unusable.
| Quadrant | # 1 sec bins | Bins with >0 counts | Bins with >2000 counts | High rate bins dominated by noise | Noise dominated (total time) | Noise dominated (detector-on time) | Marked lightcurve |
|---|---|---|---|---|---|---|---|
| A | 7164 | 7120 | 2 | 2 | 0.03% | 0.03% | 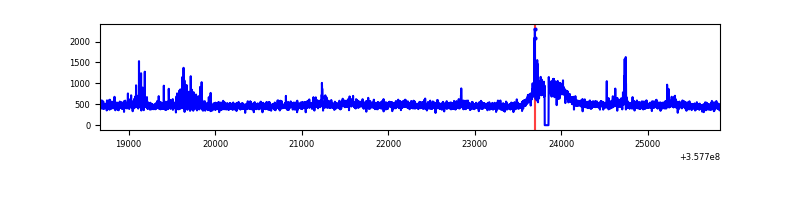 |
| B | 7164 | 7119 | 5765 | 5765 | 80.47% | 80.98% | 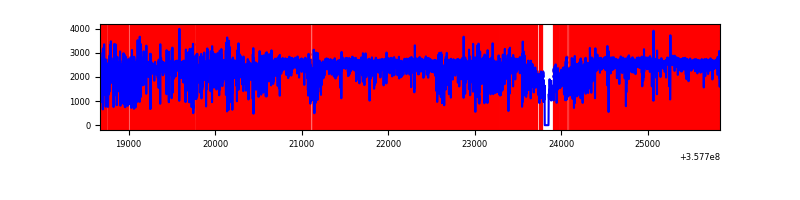 |
| C | 7165 | 7121 | 0 | 0 | 0.00% | 0.00% | 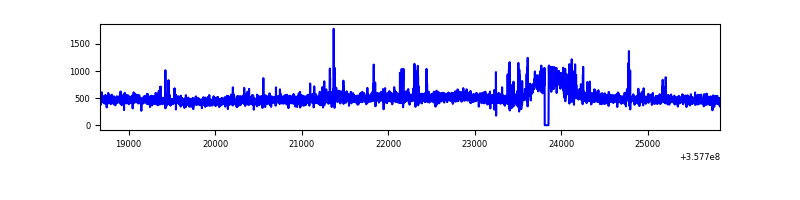 |
| D | 7164 | 7120 | 64 | 64 | 0.89% | 0.90% | 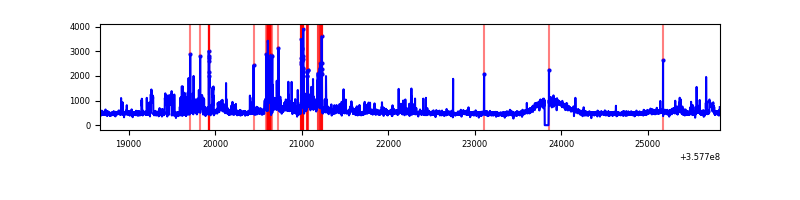 |
Top three noisy pixels from each quadrant. If the there are fewer than three noisy pixels in the level2.evt file, extra rows are filled as -1
| Pixel properties | Quadrant properties | ||||||
|---|---|---|---|---|---|---|---|
| Quadrant | DetID | PixID | Counts | Sigma | Mean | Median | Sigma |
| A | 14 | 239 | 152608 | 844.64 | 886 | 866 | 179.7 |
| A | 13 | 254 | 12900 | 66.98 | 886 | 866 | 179.7 |
| A | 3 | 137 | 9412 | 47.57 | 886 | 866 | 179.7 |
| B | 6 | 36 | 13910840 | 178414.11 | 390 | 379 | 78.0 |
| B | 6 | 159 | 958675 | 12291.0 | 390 | 379 | 78.0 |
| B | 12 | 111 | 9277 | 114.12 | 390 | 379 | 78.0 |
| C | 14 | 238 | 181367 | 899.77 | 850 | 855 | 200.6 |
| C | 14 | 254 | 65546 | 322.46 | 850 | 855 | 200.6 |
| C | 2 | 114 | 16737 | 79.16 | 850 | 855 | 200.6 |
| D | 1 | 52 | 407432 | 1963.31 | 868 | 849 | 207.1 |
| D | 8 | 195 | 314660 | 1515.34 | 868 | 849 | 207.1 |
| D | 13 | 249 | 174165 | 836.91 | 868 | 849 | 207.1 |
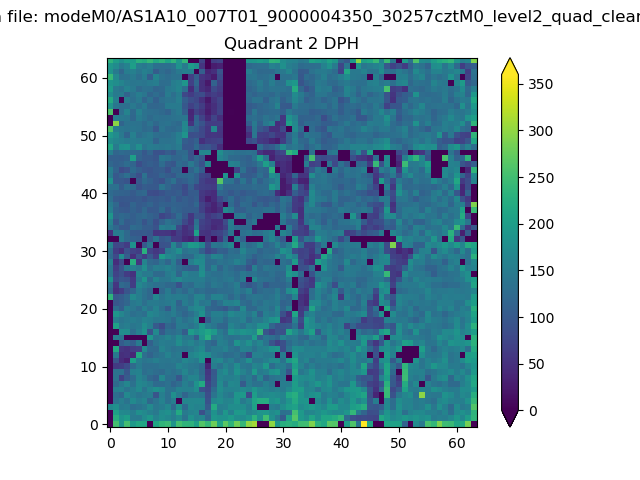
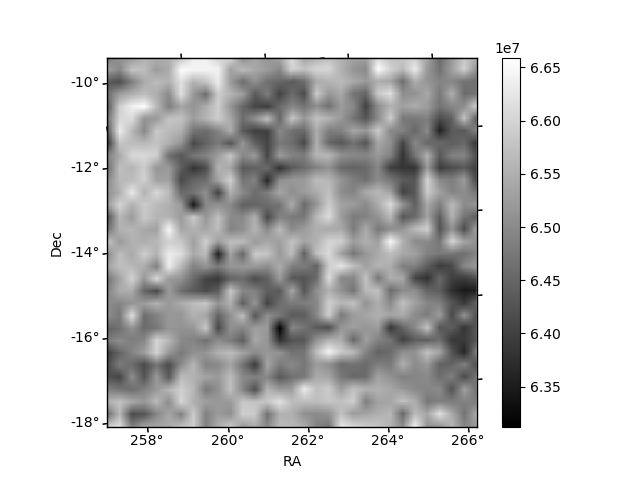
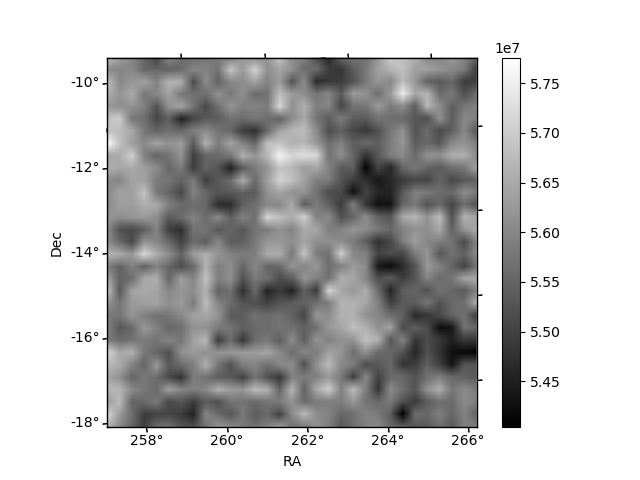
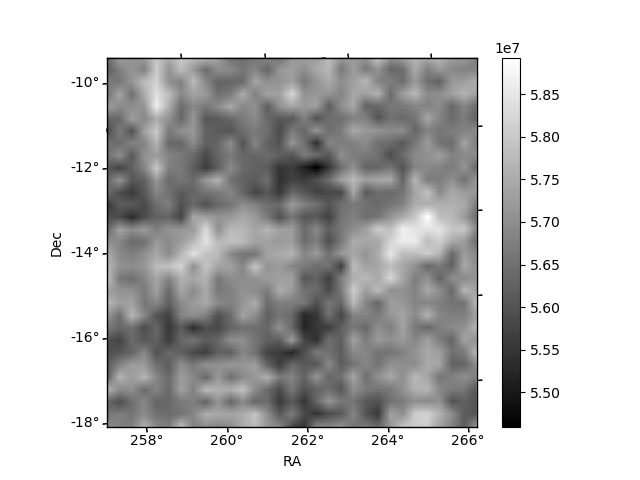
Histogram calculated using DETX and DETY for each event in the final _common_clean file
| Quadrant A | 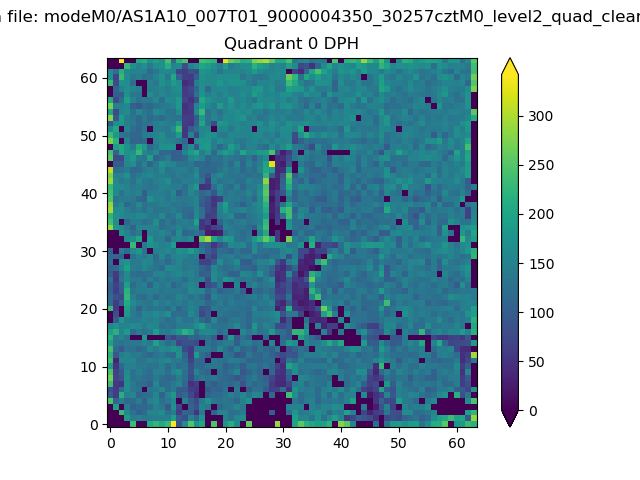 |
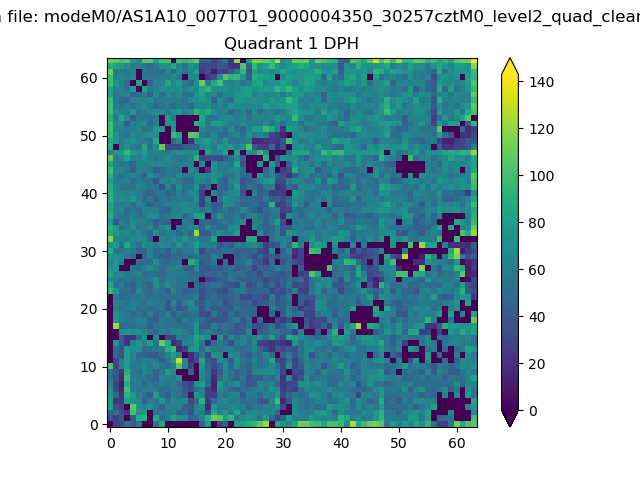 |
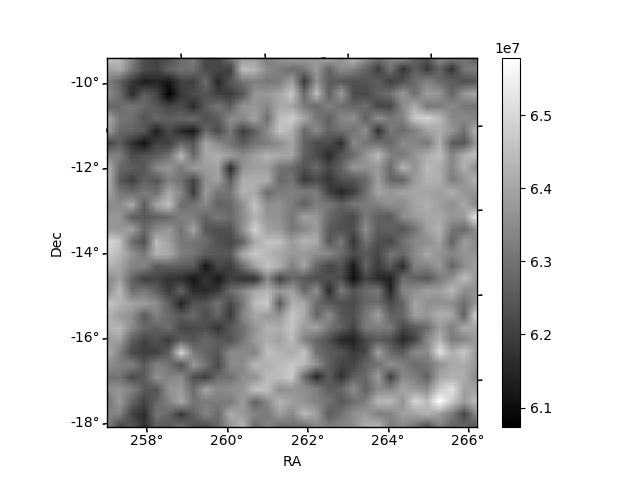
Quadrant B |
|---|---|---|---|
| Quadrant D | 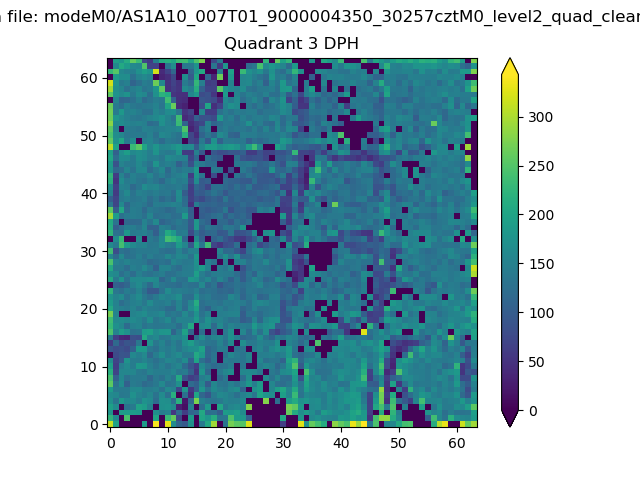 |
 |
Quadrant C |
| Plot type | Count rate plots | Images |
|---|---|---|
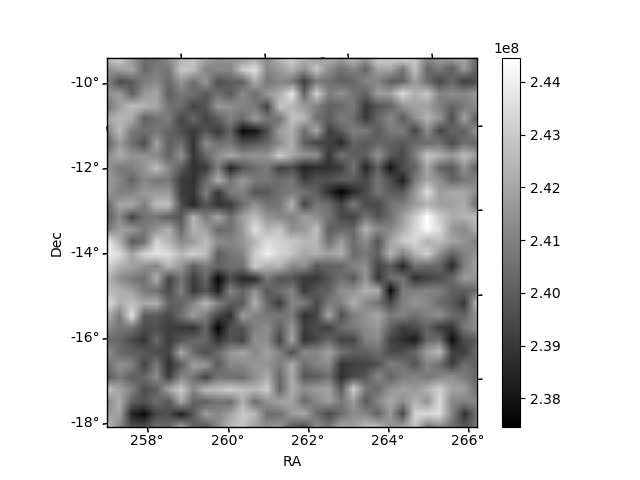
| Comparison with Poisson distribution Blue bars denote a histogram of data divided into 1 sec bins. Red curve is a Poisson curve with rate = median count rate of data. |
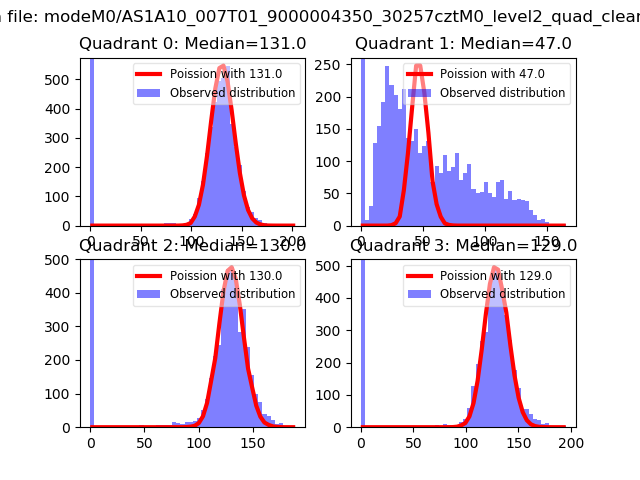 |
 |
| Quadrant-wise count rates Data is divided into 100 sec bins |
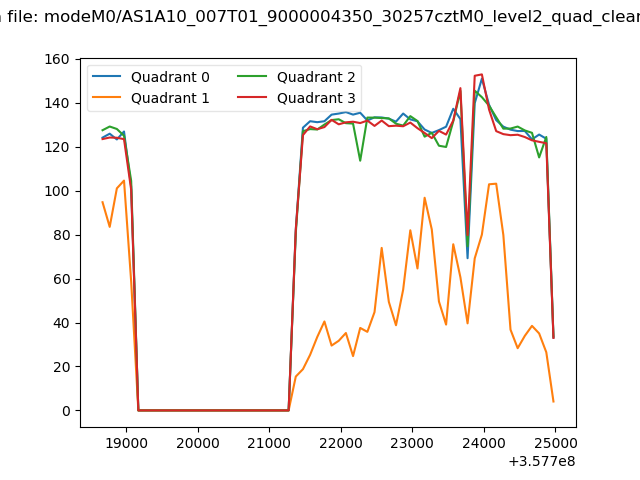 |
|
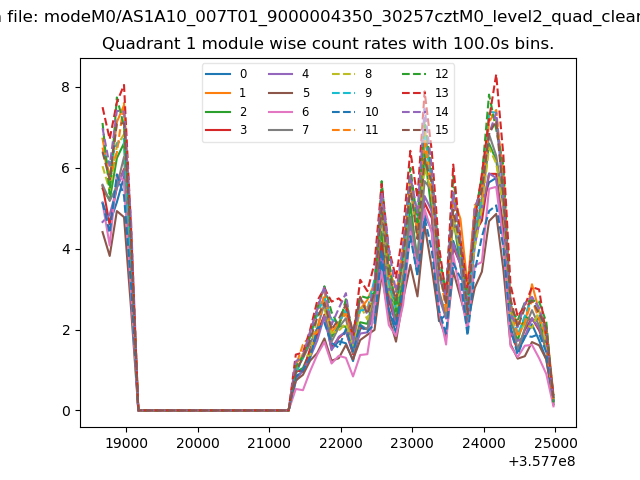
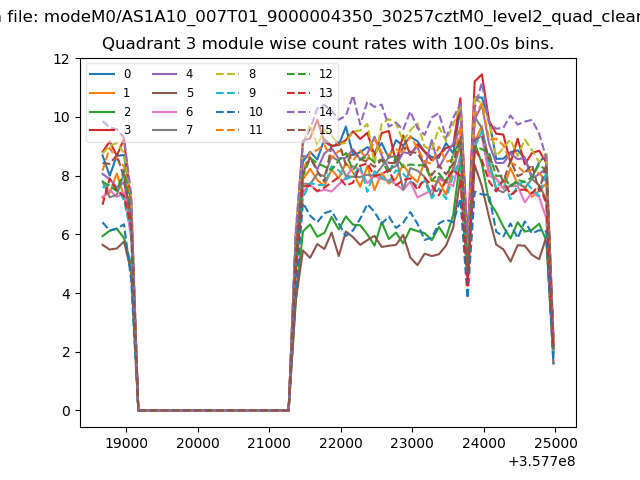
| Module-wise count rates for Quadrant A Data is divided into 100 sec bins |
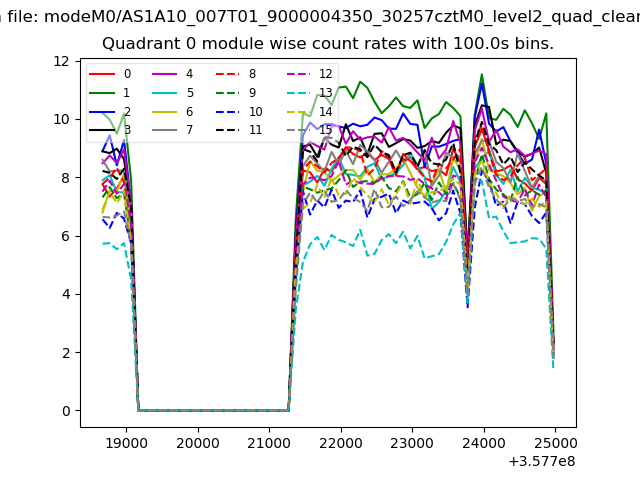 |
 |
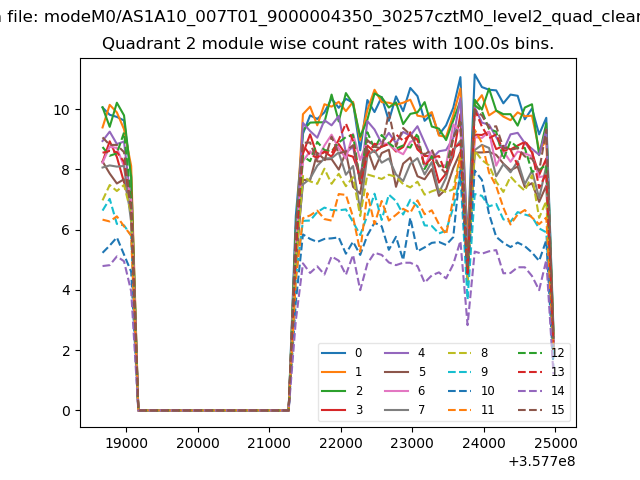
| Module-wise count rates for Quadrant B Data is divided into 100 sec bins |
 |
 |
| Module-wise count rates for Quadrant C Data is divided into 100 sec bins |
 |
 |
| Module-wise count rates for Quadrant D Data is divided into 100 sec bins |
 |
 |
| Parameter | Plot |
|---|---|
| CZT HV Monitor | 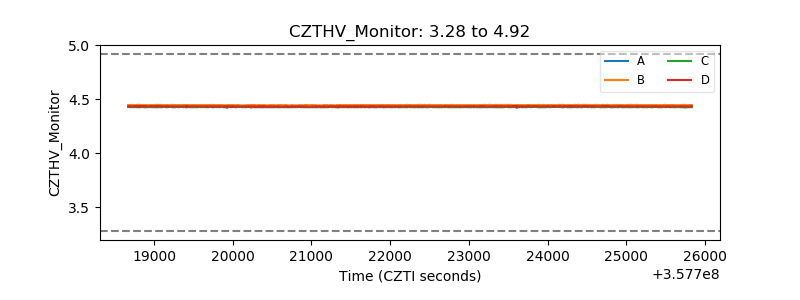 |
| D_VDD | 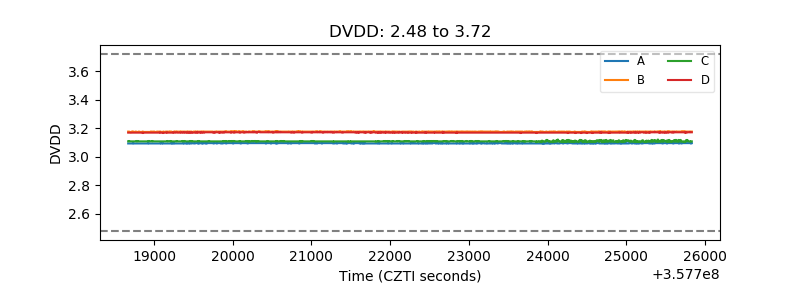 |
| Temperature 1 | 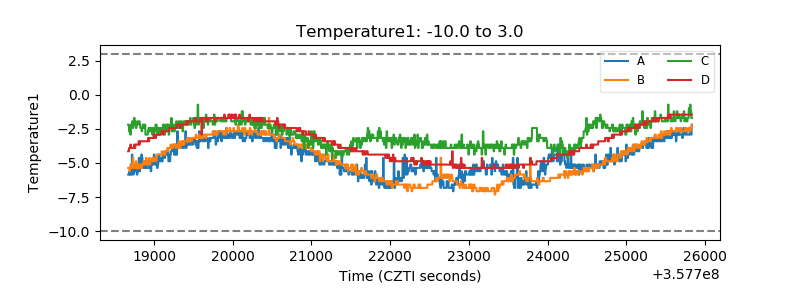 |
| Veto HV Monitor | 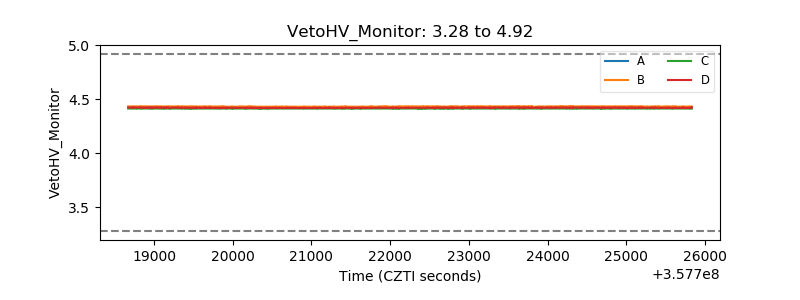 |
| Veto LLD | 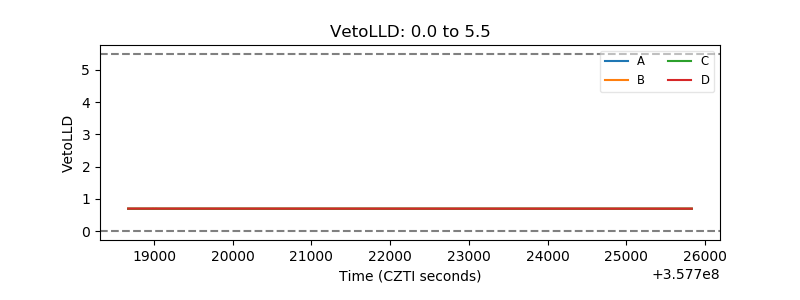 |
| Alpha Counter | 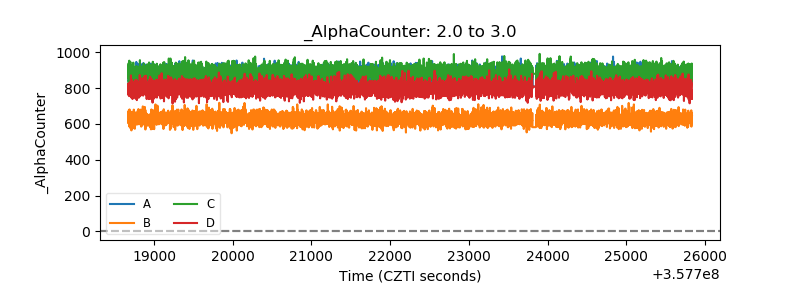 |
| _CPM_Rate |  |
| CZT Counter | 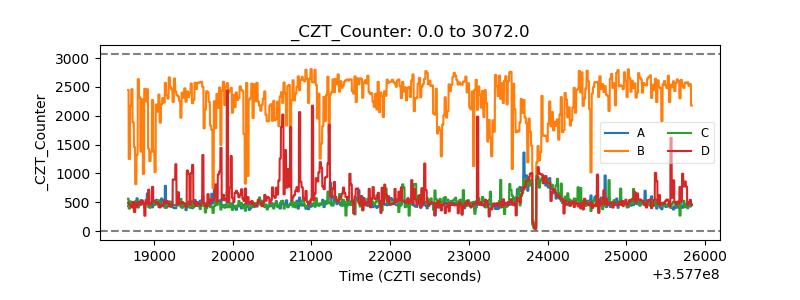 |
| +2.5 Volts monitor |  |
| +5 Volts monitor |  |
| _ROLL_ROT |  |
| _Roll_DEC | 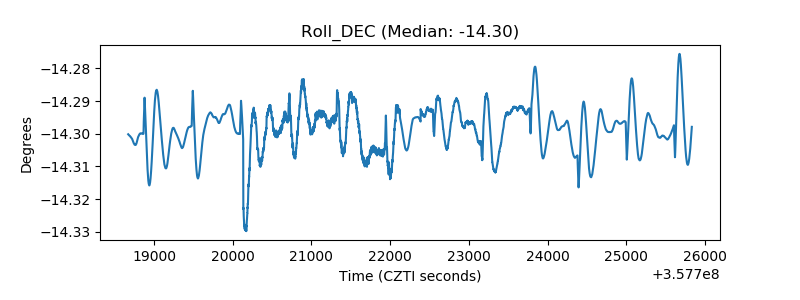 |
| _Roll_RA | 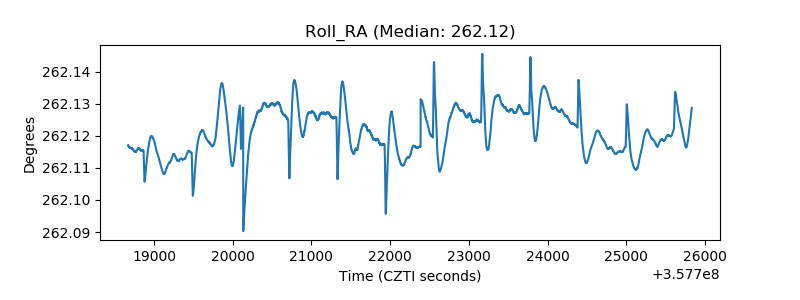 |
| Veto Counter | 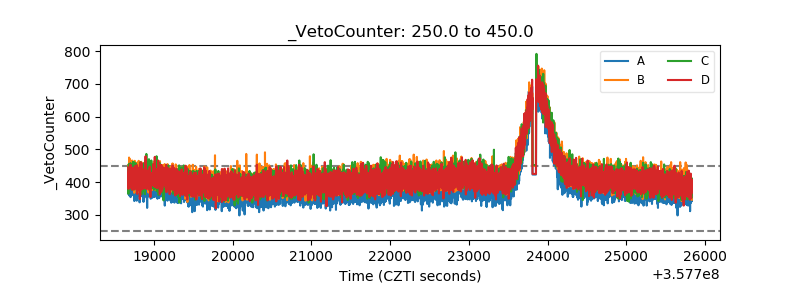 |