| Param | Original file | Final file |
|---|---|---|
| Filename | modeM0/AS1A10_007T01_9000004350_30258cztM0_level2.evt | modeM0/AS1A10_007T01_9000004350_30258cztM0_level2_quad_clean.evt |
| Size (bytes) | 1,064,920,320 | 80,971,200 |
| Size | 1015.6 MB | 77.2 MB |
| Events in quadrant A | 4,969,124 | 531,421 |
| Events in quadrant B | 18,217,319 | 275,143 |
| Events in quadrant C | 4,007,273 | 553,561 |
| Events in quadrant D | 4,530,656 | 547,454 |
| Mode M9 | |||
|---|---|---|---|
| Quadrant | BADHDUFLAG | Total packets | Discarded packets |
| A | 0 | 2 | 0 |
| B | 0 | 2 | 0 |
| C | 0 | 2 | 0 |
| D | 0 | 2 | 0 |
| Mode SS | |||
|---|---|---|---|
| Quadrant | BADHDUFLAG | Total packets | Discarded packets |
| A | 0 | 158 | 0 |
| B | 0 | 158 | 0 |
| C | 0 | 158 | 0 |
| D | 0 | 158 | 0 |
| Mode M0 | |||
|---|---|---|---|
| Quadrant | BADHDUFLAG | Total packets | Discarded packets |
| A | 0 | 19758 | 1 |
| B | 0 | 59335 | 1 |
| C | 0 | 16712 | 1 |
| D | 0 | 18211 | 3 |
| Quadrant | Total seconds | Saturated seconds | Saturation percentage |
|---|---|---|---|
| A | 7802 | 521 | 6.677775% |
| B | 7802 | 7301 | 93.578570% |
| C | 7802 | 244 | 3.127403% |
| D | 7801 | 189 | 2.422766% |
Noise dominated data is calculated using 1-second bins in cleaned event files. If a bin has >2000 counts, and if more than 50% of those come from <1% of pixels, then it is considered to be noise-dominated and hence unusable.
| Quadrant | # 1 sec bins | Bins with >0 counts | Bins with >2000 counts | High rate bins dominated by noise | Noise dominated (total time) | Noise dominated (detector-on time) | Marked lightcurve |
|---|---|---|---|---|---|---|---|
| A | 7937 | 7803 | 307 | 307 | 3.87% | 3.93% | 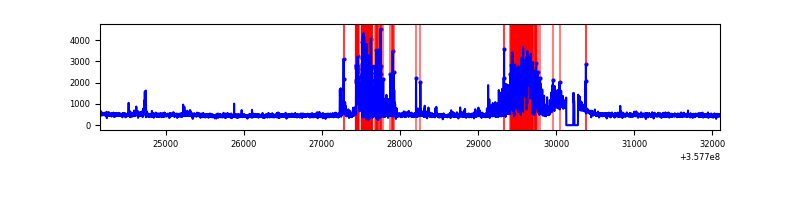 |
| B | 7936 | 7801 | 6412 | 6412 | 80.80% | 82.19% | 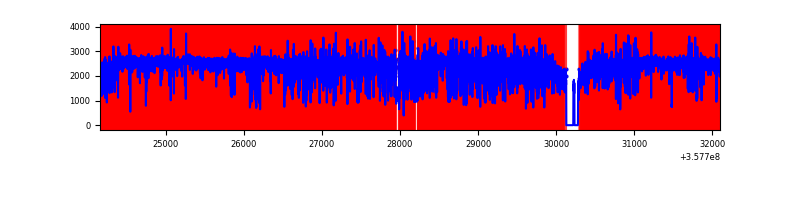 |
| C | 7937 | 7804 | 0 | 0 | 0.00% | 0.00% | 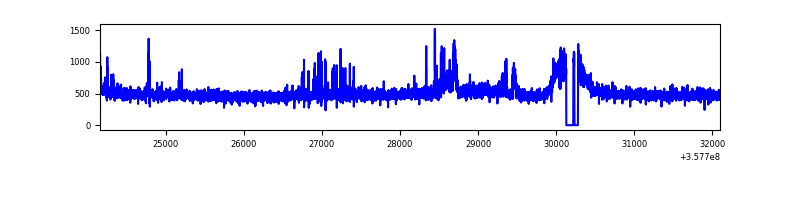 |
| D | 7936 | 7803 | 66 | 66 | 0.83% | 0.85% | 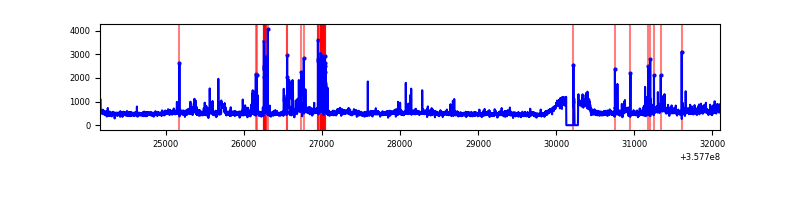 |
Top three noisy pixels from each quadrant. If the there are fewer than three noisy pixels in the level2.evt file, extra rows are filled as -1
| Pixel properties | Quadrant properties | ||||||
|---|---|---|---|---|---|---|---|
| Quadrant | DetID | PixID | Counts | Sigma | Mean | Median | Sigma |
| A | 14 | 239 | 1309415 | 6856.0 | 945 | 924 | 190.9 |
| A | 13 | 254 | 13880 | 67.88 | 945 | 924 | 190.9 |
| A | 8 | 192 | 12250 | 59.34 | 945 | 924 | 190.9 |
| B | 6 | 36 | 15429804 | 179140.84 | 435 | 424 | 86.1 |
| B | 6 | 159 | 1054163 | 12234.3 | 435 | 424 | 86.1 |
| B | 12 | 111 | 10041 | 111.65 | 435 | 424 | 86.1 |
| C | 14 | 238 | 176327 | 803.42 | 927 | 933 | 218.3 |
| C | 15 | 208 | 127164 | 578.22 | 927 | 933 | 218.3 |
| C | 14 | 254 | 43166 | 193.45 | 927 | 933 | 218.3 |
| D | 8 | 195 | 390309 | 1750.55 | 937 | 918 | 222.4 |
| D | 13 | 249 | 263340 | 1179.75 | 937 | 918 | 222.4 |
| D | 1 | 52 | 129839 | 579.58 | 937 | 918 | 222.4 |
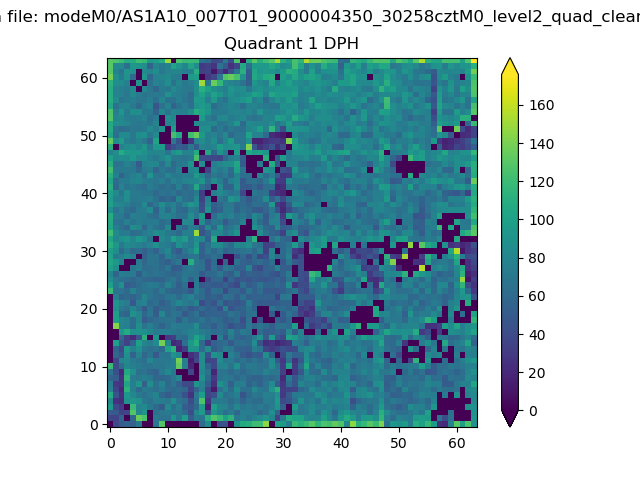
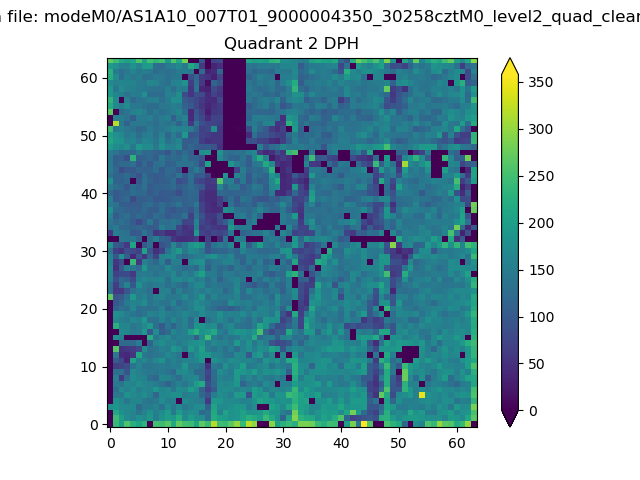
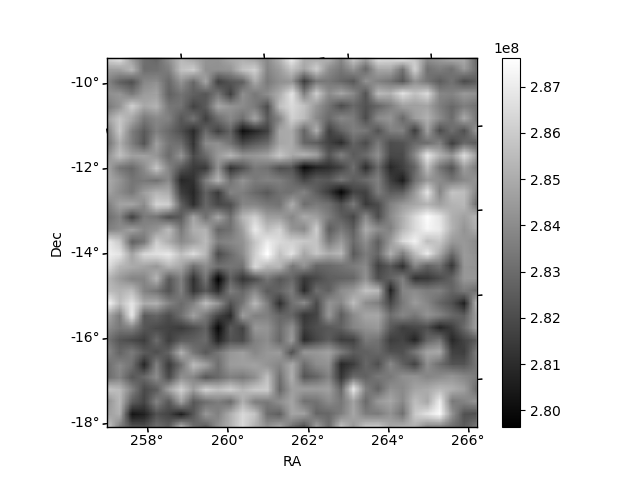
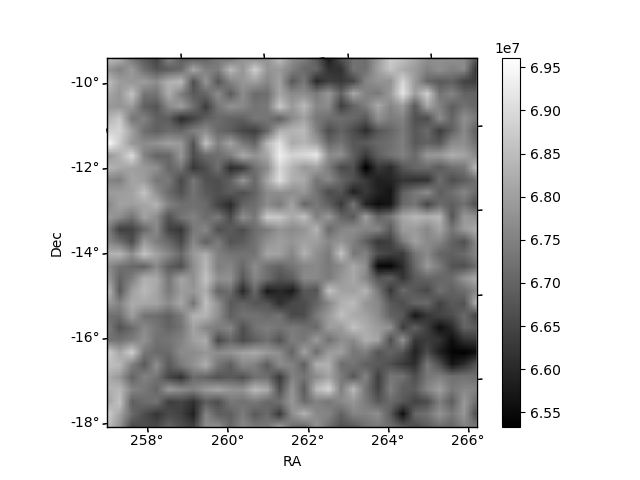
Histogram calculated using DETX and DETY for each event in the final _common_clean file
| Quadrant A |  |
 |
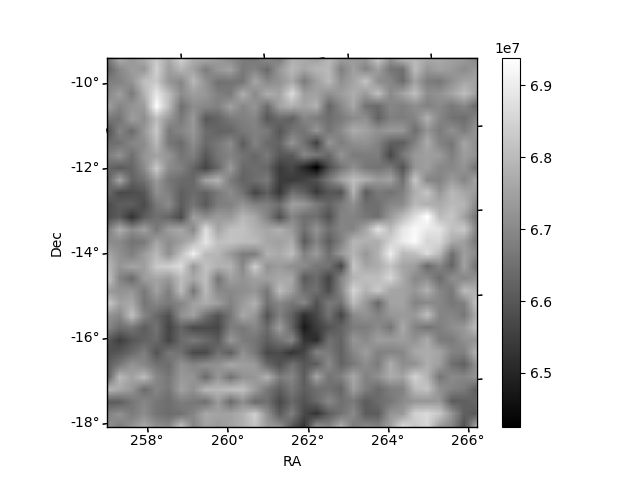
Quadrant B |
|---|---|---|---|
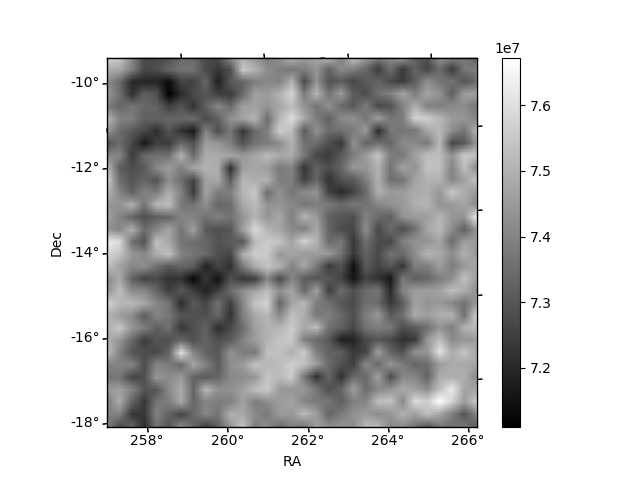
| Quadrant D | 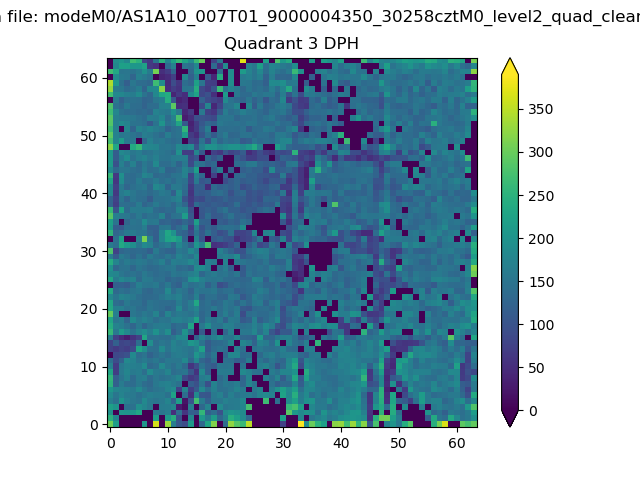 |
 |
Quadrant C |
| Plot type | Count rate plots | Images |
|---|---|---|
| Comparison with Poisson distribution Blue bars denote a histogram of data divided into 1 sec bins. Red curve is a Poisson curve with rate = median count rate of data. |
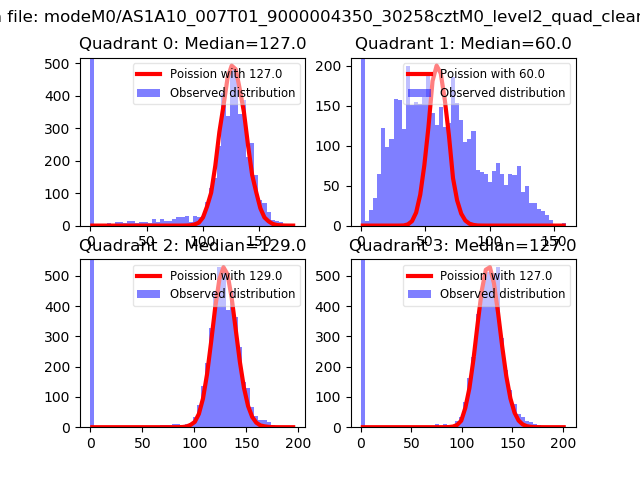 |
 |
| Quadrant-wise count rates Data is divided into 100 sec bins |
 |
|
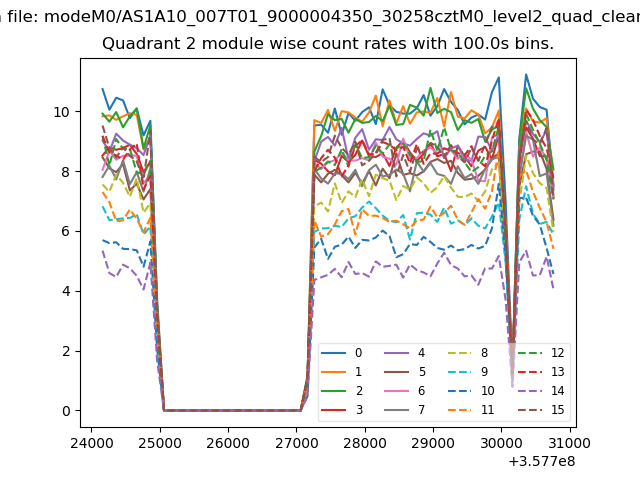
| Module-wise count rates for Quadrant A Data is divided into 100 sec bins |
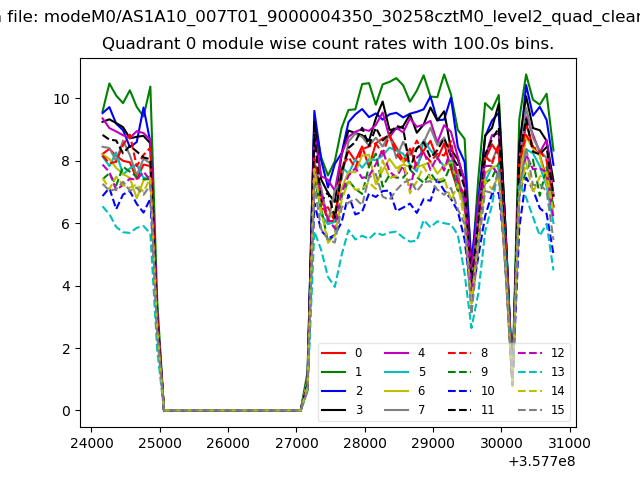 |
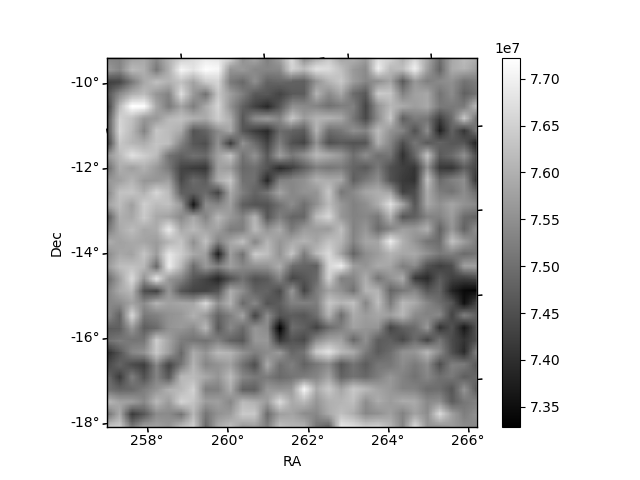 |
| Module-wise count rates for Quadrant B Data is divided into 100 sec bins |
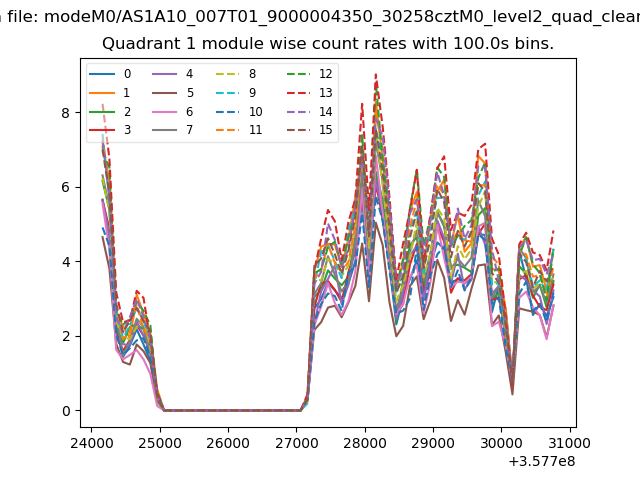 |
 |
| Module-wise count rates for Quadrant C Data is divided into 100 sec bins |
 |
 |
| Module-wise count rates for Quadrant D Data is divided into 100 sec bins |
 |
 |
| Parameter | Plot |
|---|---|
| CZT HV Monitor | 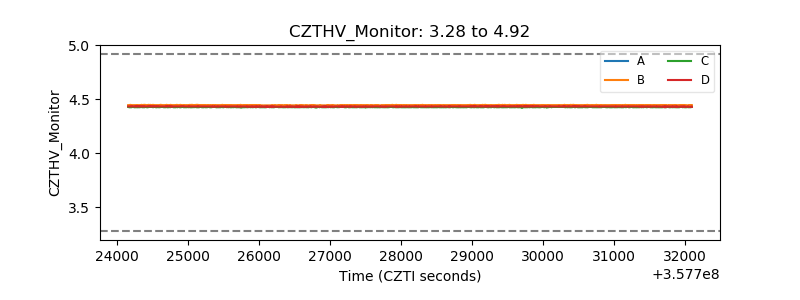 |
| D_VDD | 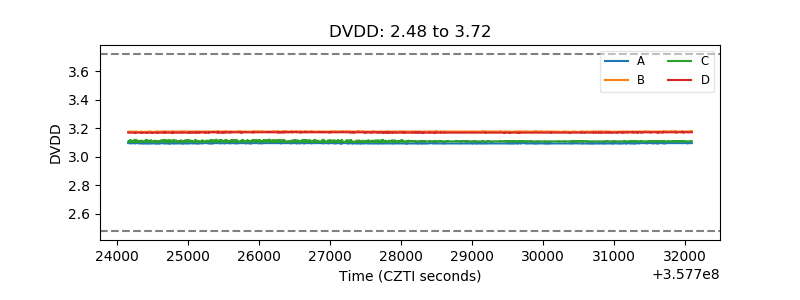 |
| Temperature 1 | 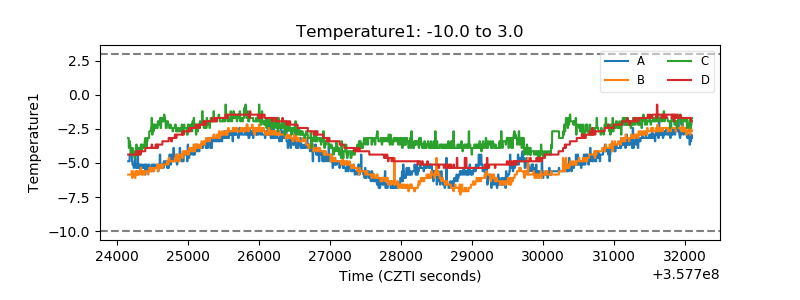 |
| Veto HV Monitor | 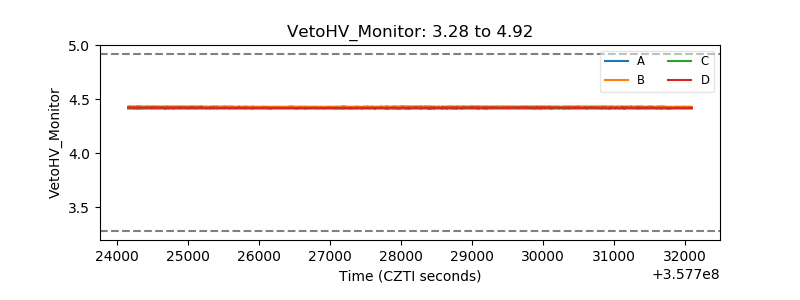 |
| Veto LLD | 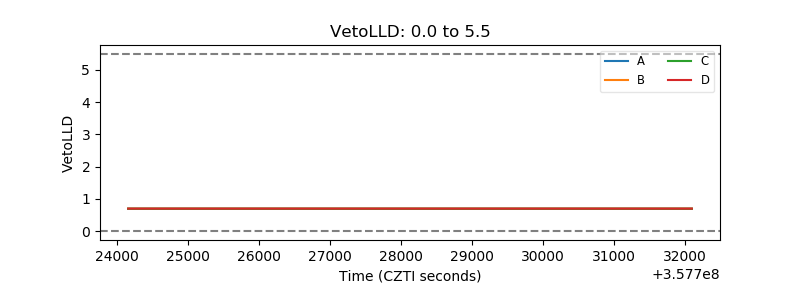 |
| Alpha Counter |  |
| _CPM_Rate | 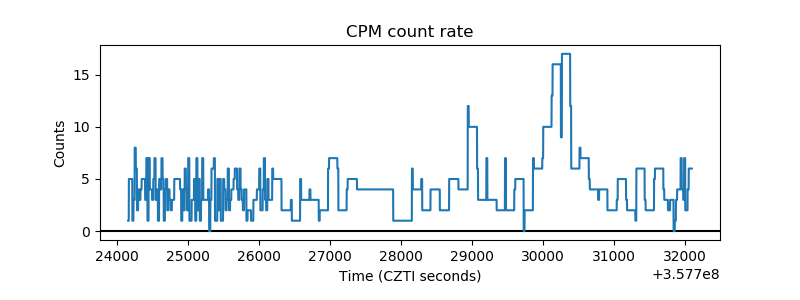 |
| CZT Counter | 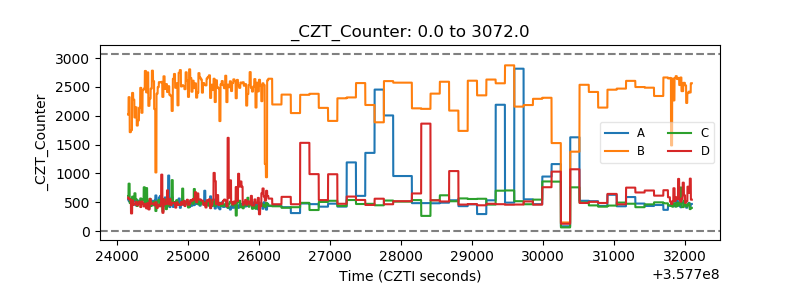 |
| +2.5 Volts monitor | 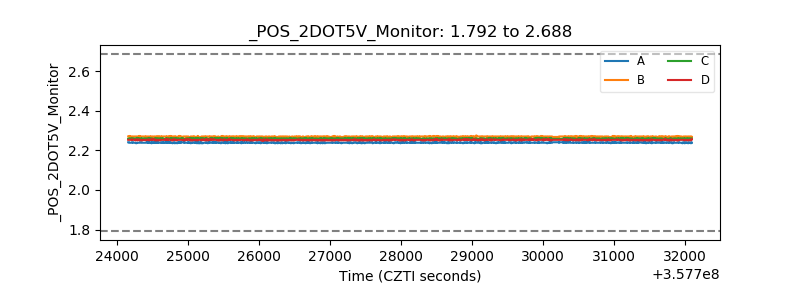 |
| +5 Volts monitor |  |
| _ROLL_ROT | 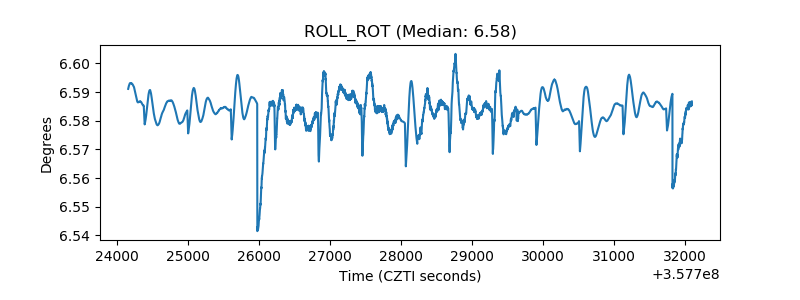 |
| _Roll_DEC |  |
| _Roll_RA | 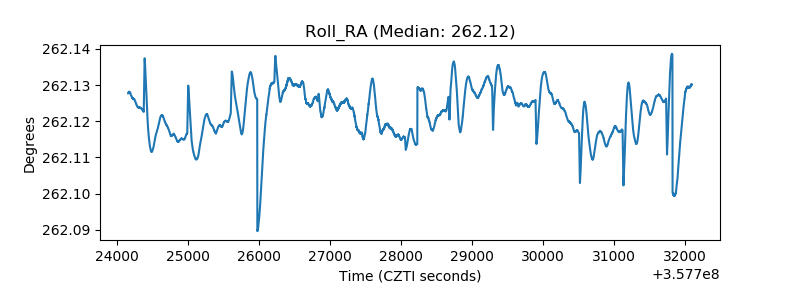 |
| Veto Counter | 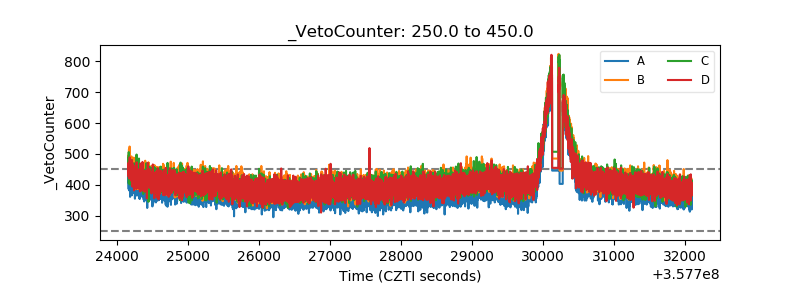 |