| Param | Original file | Final file |
|---|---|---|
| Filename | modeM0/AS1A10_007T01_9000004350_30261cztM0_level2.evt | modeM0/AS1A10_007T01_9000004350_30261cztM0_level2_quad_clean.evt |
| Size (bytes) | 2,244,401,280 | 209,401,920 |
| Size | 2.1 GB | 199.7 MB |
| Events in quadrant A | 9,481,209 | 1,376,660 |
| Events in quadrant B | 37,797,346 | 958,100 |
| Events in quadrant C | 9,378,036 | 1,366,064 |
| Events in quadrant D | 10,058,021 | 1,352,022 |
| Mode M9 | |||
|---|---|---|---|
| Quadrant | BADHDUFLAG | Total packets | Discarded packets |
| A | 0 | 18 | 0 |
| B | 0 | 18 | 0 |
| C | 0 | 18 | 0 |
| D | 0 | 18 | 0 |
| Mode SS | |||
|---|---|---|---|
| Quadrant | BADHDUFLAG | Total packets | Discarded packets |
| A | 0 | 380 | 0 |
| B | 0 | 380 | 0 |
| C | 0 | 380 | 0 |
| D | 0 | 380 | 0 |
| Mode M0 | |||
|---|---|---|---|
| Quadrant | BADHDUFLAG | Total packets | Discarded packets |
| A | 0 | 40161 | 6 |
| B | 0 | 124900 | 4 |
| C | 0 | 39299 | 4 |
| D | 0 | 41696 | 4 |
| Quadrant | Total seconds | Saturated seconds | Saturation percentage |
|---|---|---|---|
| A | 18656 | 246 | 1.318611% |
| B | 18657 | 13758 | 73.741759% |
| C | 18657 | 444 | 2.379804% |
| D | 18657 | 152 | 0.814708% |
Noise dominated data is calculated using 1-second bins in cleaned event files. If a bin has >2000 counts, and if more than 50% of those come from <1% of pixels, then it is considered to be noise-dominated and hence unusable.
| Quadrant | # 1 sec bins | Bins with >0 counts | Bins with >2000 counts | High rate bins dominated by noise | Noise dominated (total time) | Noise dominated (detector-on time) | Marked lightcurve |
|---|---|---|---|---|---|---|---|
| A | 20452 | 18657 | 41 | 41 | 0.20% | 0.22% | 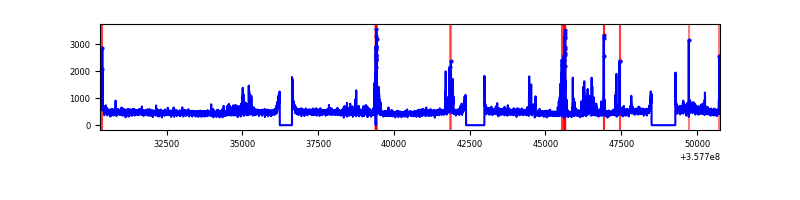 |
| B | 20452 | 18658 | 11684 | 11684 | 57.13% | 62.62% | 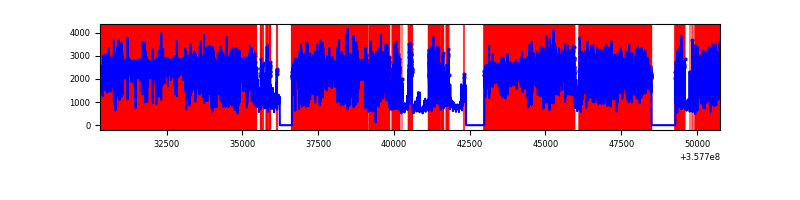 |
| C | 20453 | 18659 | 11 | 11 | 0.05% | 0.06% | 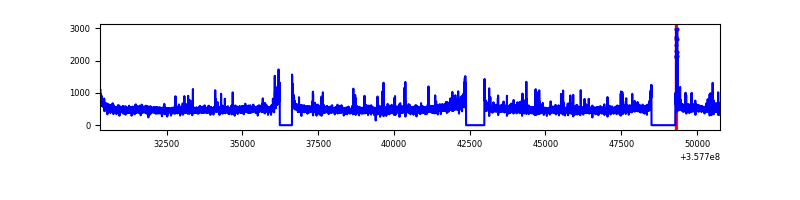 |
| D | 20453 | 18661 | 31 | 31 | 0.15% | 0.17% | 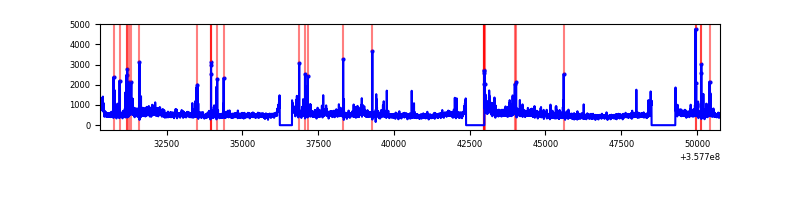 |
Top three noisy pixels from each quadrant. If the there are fewer than three noisy pixels in the level2.evt file, extra rows are filled as -1
| Pixel properties | Quadrant properties | ||||||
|---|---|---|---|---|---|---|---|
| Quadrant | DetID | PixID | Counts | Sigma | Mean | Median | Sigma |
| A | 14 | 239 | 671366 | 1470.93 | 2270 | 2215 | 454.9 |
| A | 8 | 192 | 40899 | 85.03 | 2270 | 2215 | 454.9 |
| A | 13 | 254 | 34924 | 71.9 | 2270 | 2215 | 454.9 |
| B | 6 | 36 | 27804364 | 102945.74 | 1402 | 1362 | 270.1 |
| B | 6 | 159 | 3440146 | 12732.73 | 1402 | 1362 | 270.1 |
| B | 4 | 80 | 959448 | 3547.49 | 1402 | 1362 | 270.1 |
| C | 14 | 238 | 414580 | 799.42 | 2193 | 2207 | 515.8 |
| C | 3 | 233 | 256967 | 493.88 | 2193 | 2207 | 515.8 |
| C | 14 | 254 | 94576 | 179.07 | 2193 | 2207 | 515.8 |
| D | 1 | 52 | 637110 | 1208.91 | 2215 | 2161 | 525.2 |
| D | 8 | 195 | 532319 | 1009.39 | 2215 | 2161 | 525.2 |
| D | 2 | 250 | 153365 | 287.88 | 2215 | 2161 | 525.2 |
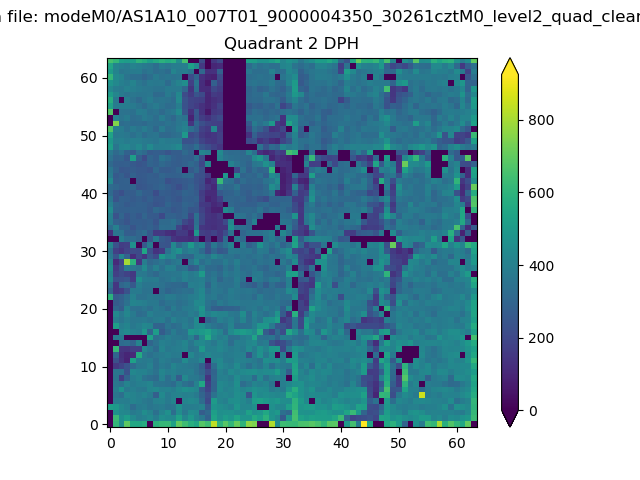
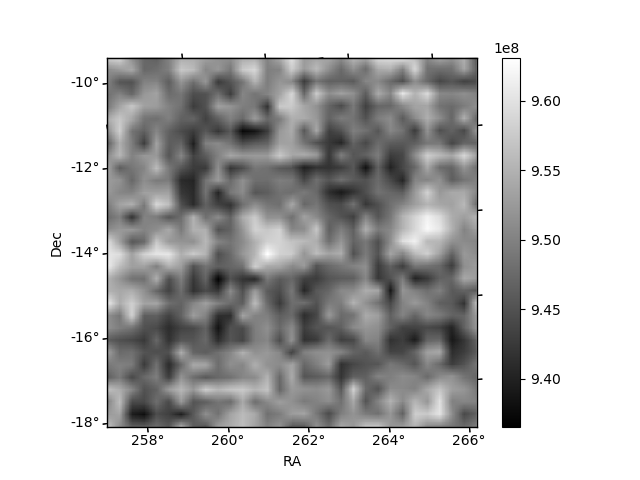
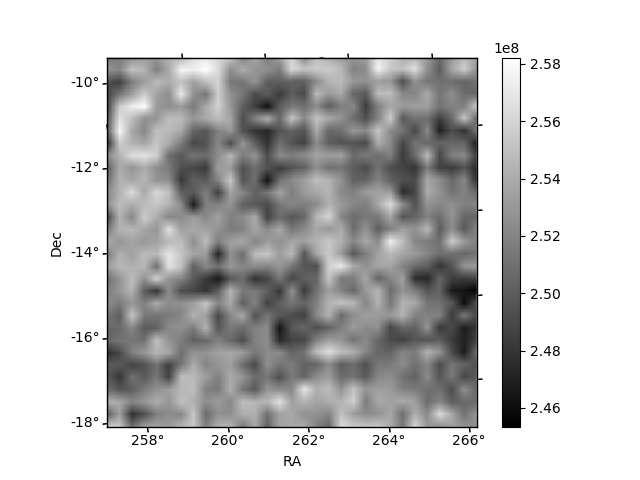
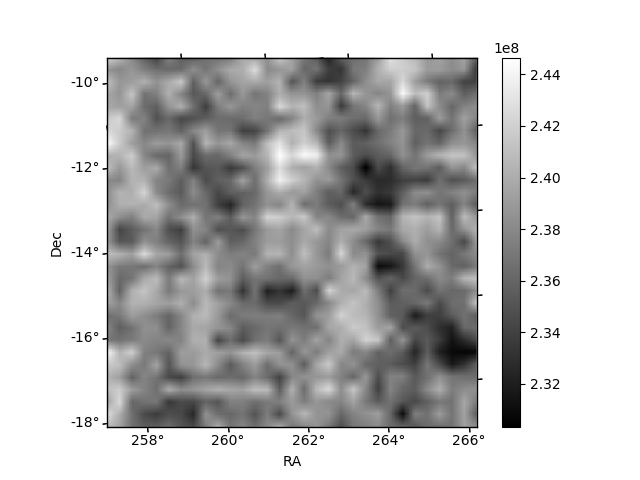
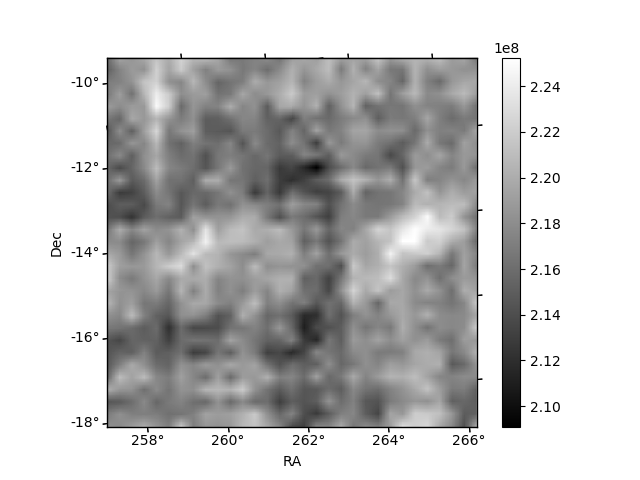
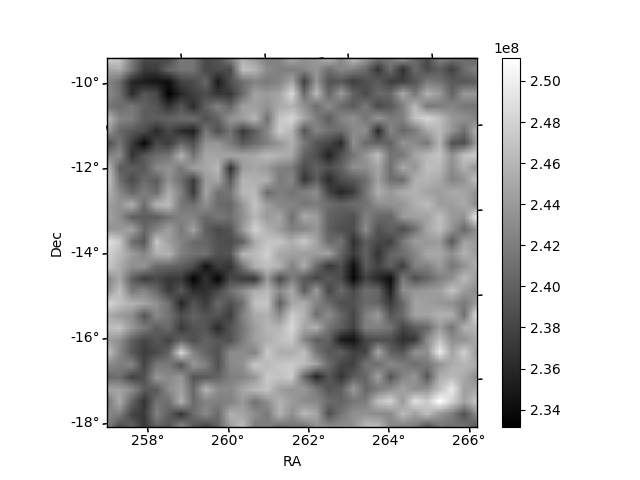
Histogram calculated using DETX and DETY for each event in the final _common_clean file
| Quadrant A | 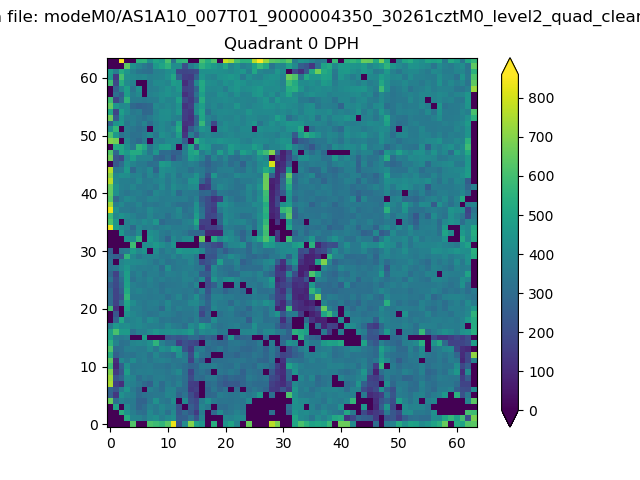 |
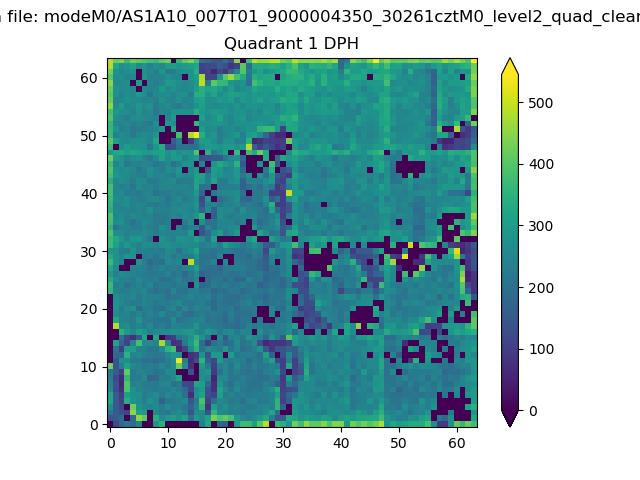 |
Quadrant B |
|---|---|---|---|
| Quadrant D | 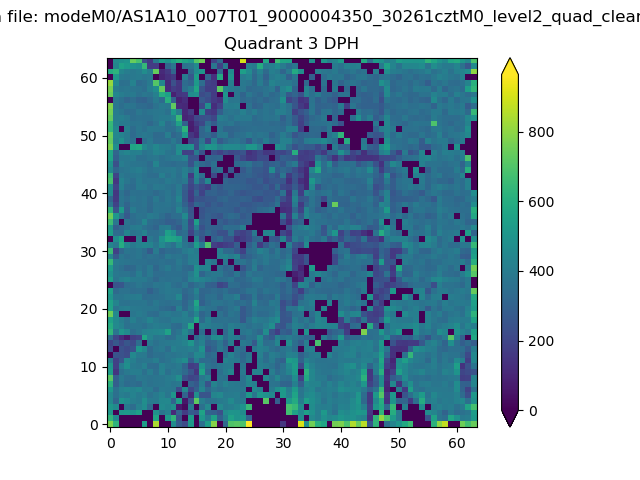 |
 |
Quadrant C |
| Plot type | Count rate plots | Images |
|---|---|---|
| Comparison with Poisson distribution Blue bars denote a histogram of data divided into 1 sec bins. Red curve is a Poisson curve with rate = median count rate of data. |
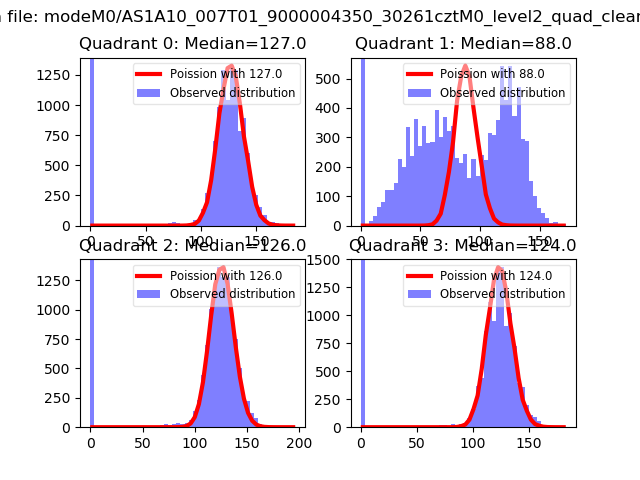 |
 |
| Quadrant-wise count rates Data is divided into 100 sec bins |
 |
|
| Module-wise count rates for Quadrant A Data is divided into 100 sec bins |
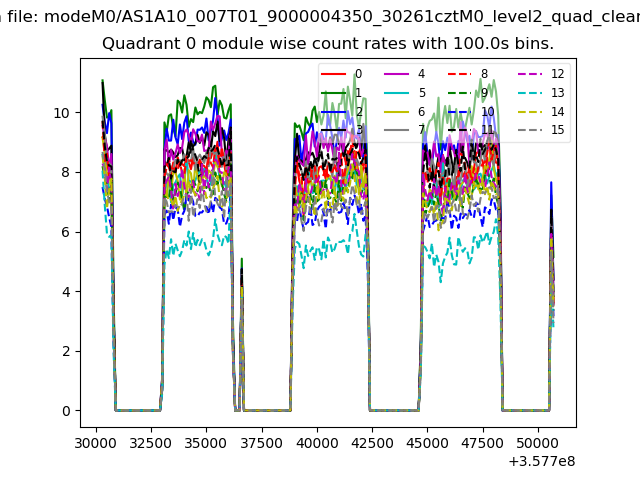 |
 |
| Module-wise count rates for Quadrant B Data is divided into 100 sec bins |
 |
 |
| Module-wise count rates for Quadrant C Data is divided into 100 sec bins |
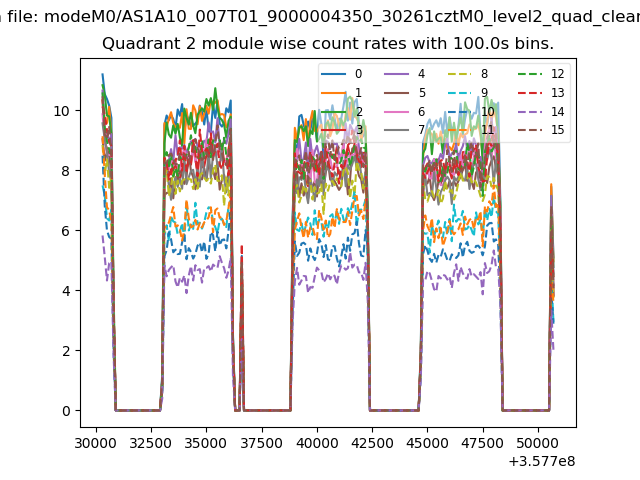 |
 |
| Module-wise count rates for Quadrant D Data is divided into 100 sec bins |
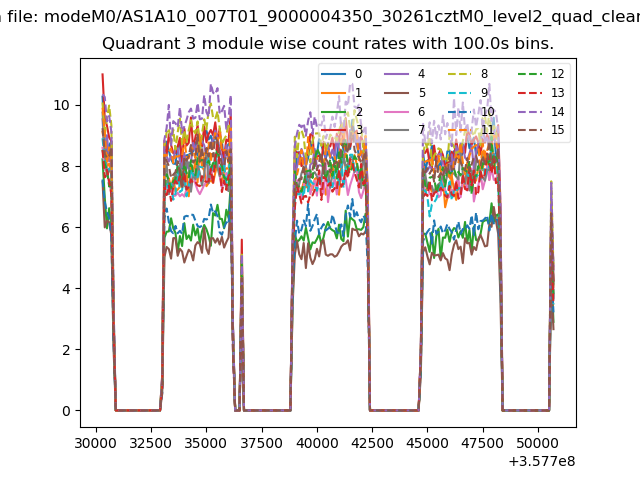 |
 |
| Parameter | Plot |
|---|---|
| CZT HV Monitor | 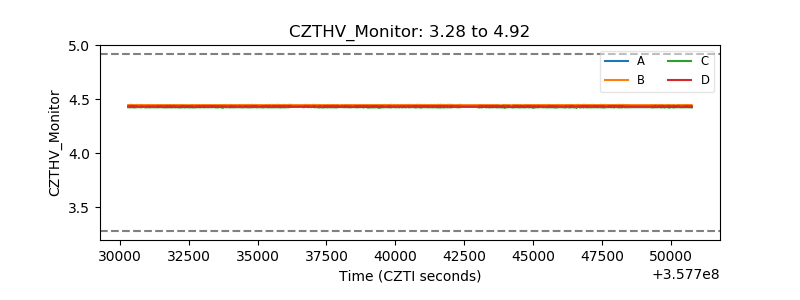 |
| D_VDD | 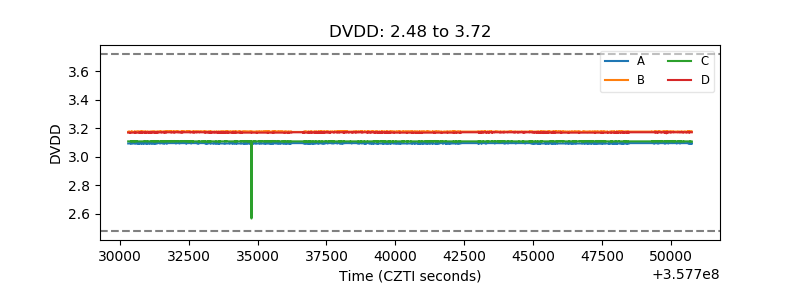 |
| Temperature 1 | 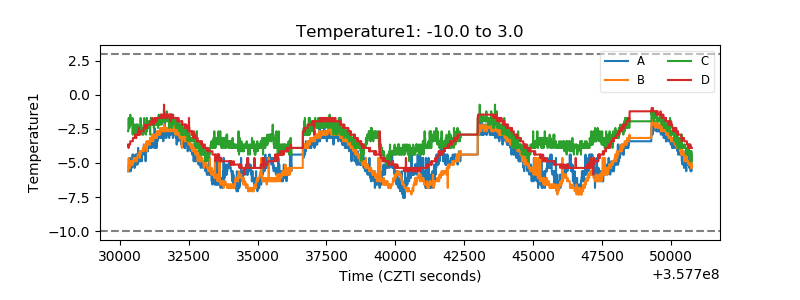 |
| Veto HV Monitor | 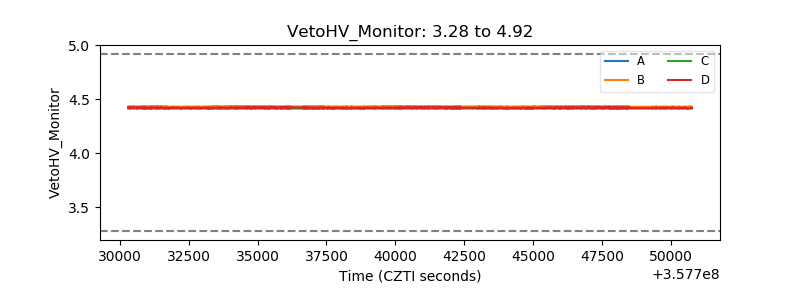 |
| Veto LLD | 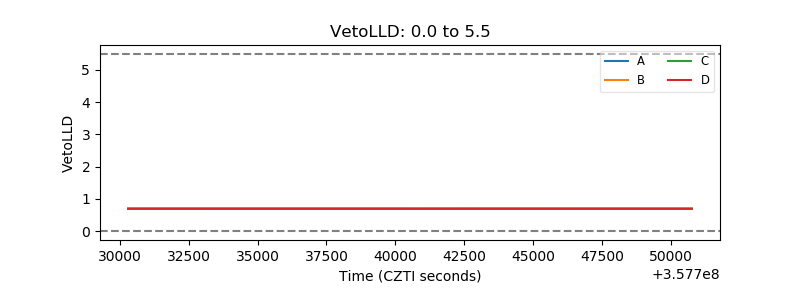 |
| Alpha Counter | 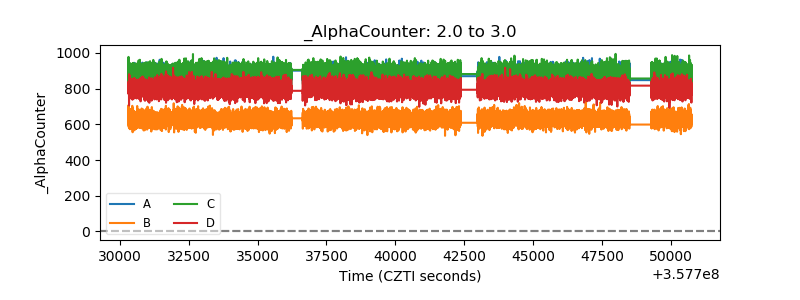 |
| _CPM_Rate |  |
| CZT Counter | 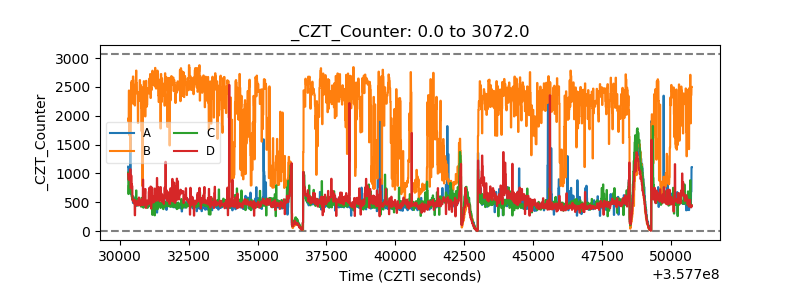 |
| +2.5 Volts monitor |  |
| +5 Volts monitor |  |
| _ROLL_ROT | 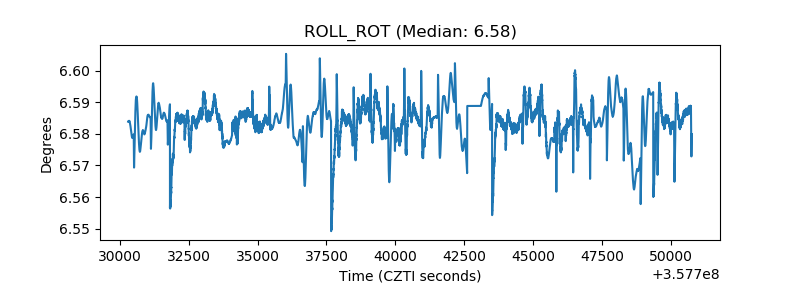 |
| _Roll_DEC | 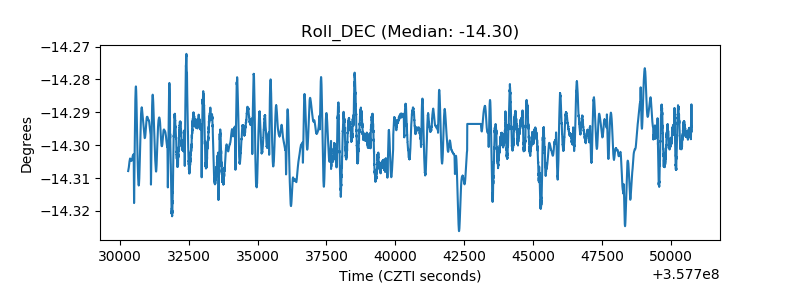 |
| _Roll_RA | 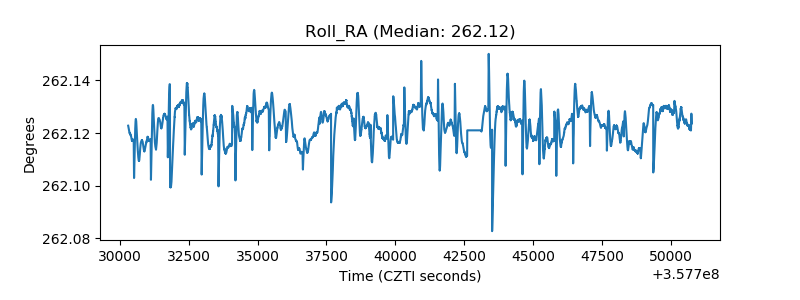 |
| Veto Counter | 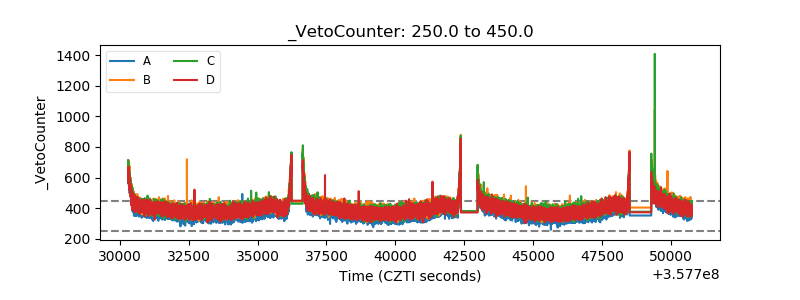 |