| Param | Original file | Final file |
|---|---|---|
| Filename | modeM0/AS1A10_007T01_9000004350_30265cztM0_level2.evt | modeM0/AS1A10_007T01_9000004350_30265cztM0_level2_quad_clean.evt |
| Size (bytes) | 729,118,080 | 104,423,040 |
| Size | 695.3 MB | 99.6 MB |
| Events in quadrant A | 3,800,755 | 710,767 |
| Events in quadrant B | 10,781,277 | 597,860 |
| Events in quadrant C | 3,521,029 | 716,122 |
| Events in quadrant D | 3,547,930 | 692,689 |
| Mode M9 | |||
|---|---|---|---|
| Quadrant | BADHDUFLAG | Total packets | Discarded packets |
| A | 0 | 14 | 0 |
| B | 0 | 15 | 0 |
| C | 0 | 15 | 0 |
| D | 0 | 15 | 0 |
| Mode SS | |||
|---|---|---|---|
| Quadrant | BADHDUFLAG | Total packets | Discarded packets |
| A | 0 | 130 | 0 |
| B | 0 | 130 | 0 |
| C | 0 | 130 | 0 |
| D | 0 | 130 | 0 |
| Mode M0 | |||
|---|---|---|---|
| Quadrant | BADHDUFLAG | Total packets | Discarded packets |
| A | 0 | 15473 | 3 |
| B | 0 | 36457 | 2 |
| C | 0 | 14448 | 2 |
| D | 0 | 14830 | 2 |
| Quadrant | Total seconds | Saturated seconds | Saturation percentage |
|---|---|---|---|
| A | 6362 | 63 | 0.990255% |
| B | 6362 | 2952 | 46.400503% |
| C | 6362 | 133 | 2.090538% |
| D | 6362 | 43 | 0.675888% |
Noise dominated data is calculated using 1-second bins in cleaned event files. If a bin has >2000 counts, and if more than 50% of those come from <1% of pixels, then it is considered to be noise-dominated and hence unusable.
| Quadrant | # 1 sec bins | Bins with >0 counts | Bins with >2000 counts | High rate bins dominated by noise | Noise dominated (total time) | Noise dominated (detector-on time) | Marked lightcurve |
|---|---|---|---|---|---|---|---|
| A | 7582 | 6363 | 28 | 28 | 0.37% | 0.44% | 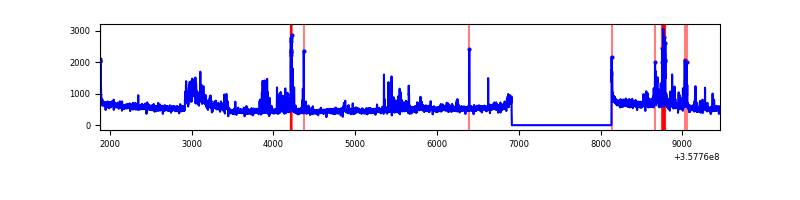 |
| B | 7582 | 6363 | 2028 | 2028 | 26.75% | 31.87% | 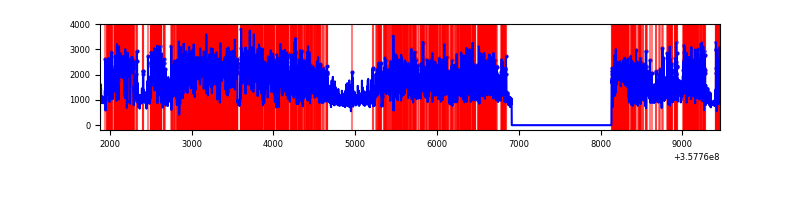 |
| C | 7582 | 6363 | 0 | 0 | 0.00% | 0.00% | 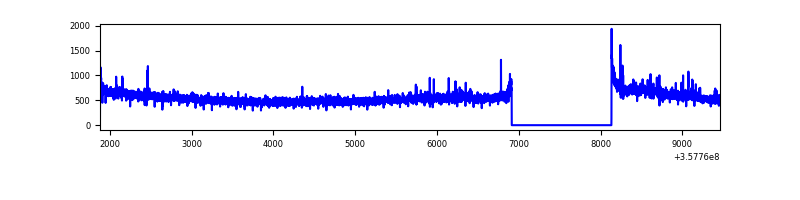 |
| D | 7582 | 6363 | 21 | 21 | 0.28% | 0.33% | 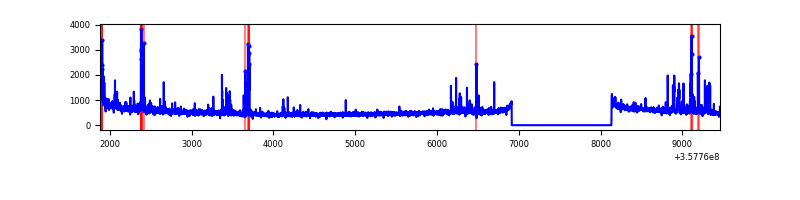 |
Top three noisy pixels from each quadrant. If the there are fewer than three noisy pixels in the level2.evt file, extra rows are filled as -1
| Pixel properties | Quadrant properties | ||||||
|---|---|---|---|---|---|---|---|
| Quadrant | DetID | PixID | Counts | Sigma | Mean | Median | Sigma |
| A | 14 | 239 | 553277 | 3322.38 | 834 | 818 | 166.3 |
| A | 8 | 192 | 26192 | 152.59 | 834 | 818 | 166.3 |
| A | 13 | 254 | 12580 | 70.73 | 834 | 818 | 166.3 |
| B | 6 | 36 | 6225519 | 46202.59 | 711 | 693 | 134.7 |
| B | 6 | 159 | 1583400 | 11747.34 | 711 | 693 | 134.7 |
| B | 0 | 229 | 99084 | 730.29 | 711 | 693 | 134.7 |
| C | 14 | 238 | 145794 | 753.16 | 821 | 828 | 192.5 |
| C | 3 | 233 | 141751 | 732.16 | 821 | 828 | 192.5 |
| C | 14 | 254 | 21230 | 106.0 | 821 | 828 | 192.5 |
| D | 2 | 250 | 144138 | 685.1 | 813 | 797 | 209.2 |
| D | 1 | 52 | 137200 | 651.94 | 813 | 797 | 209.2 |
| D | 5 | 222 | 49417 | 232.38 | 813 | 797 | 209.2 |
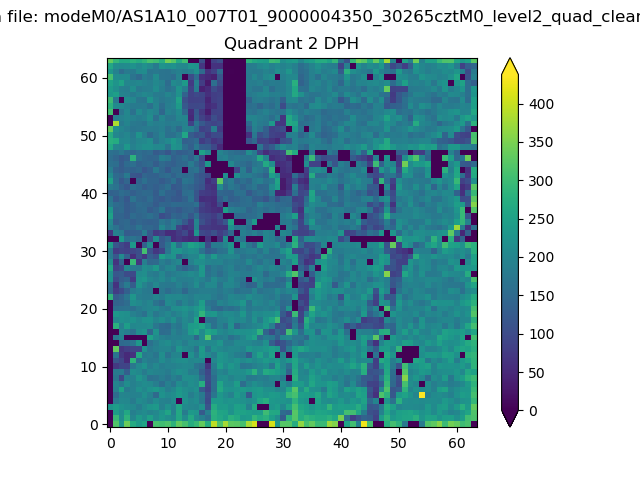
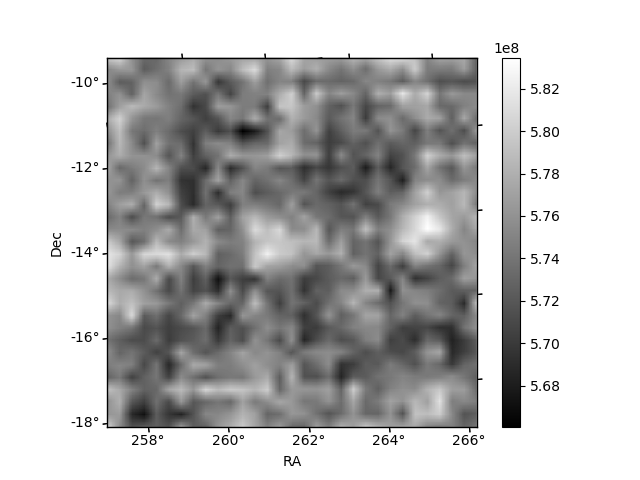
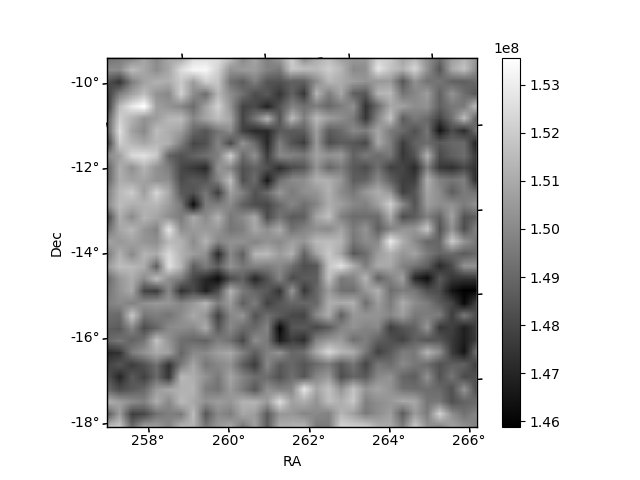
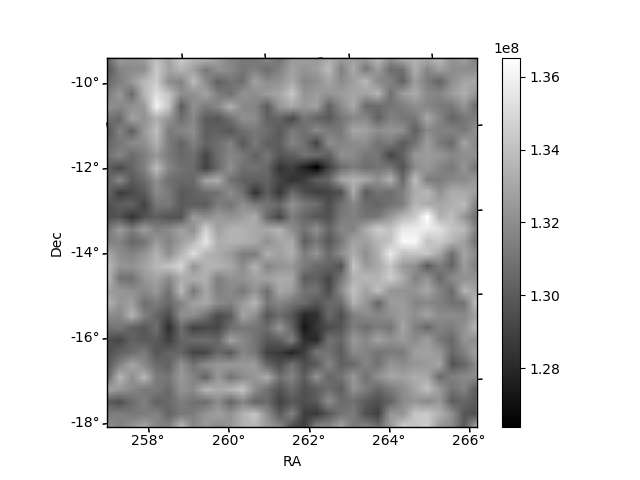
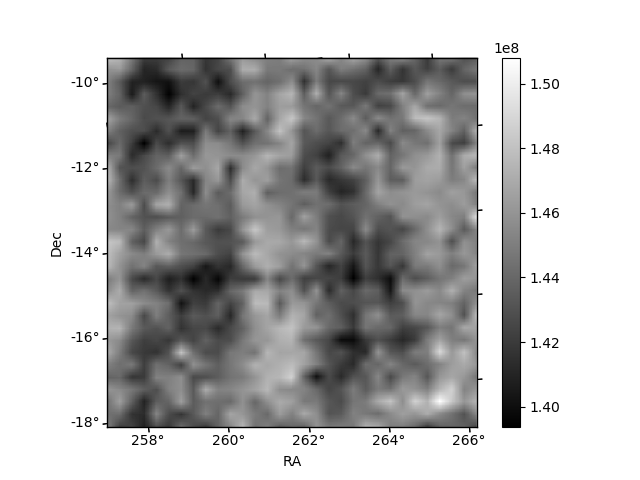
Histogram calculated using DETX and DETY for each event in the final _common_clean file
| Quadrant A | 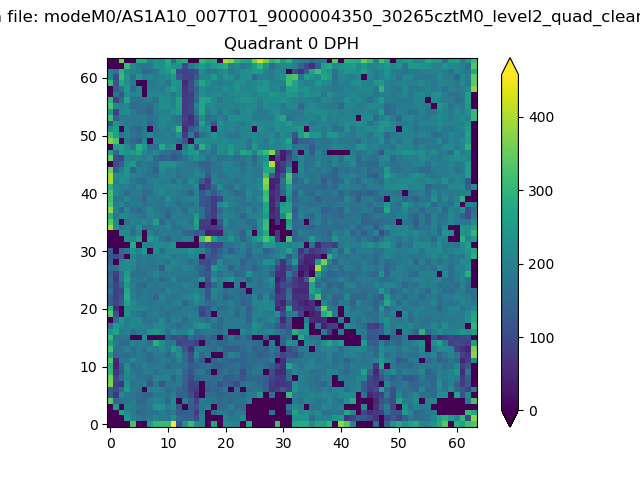 |
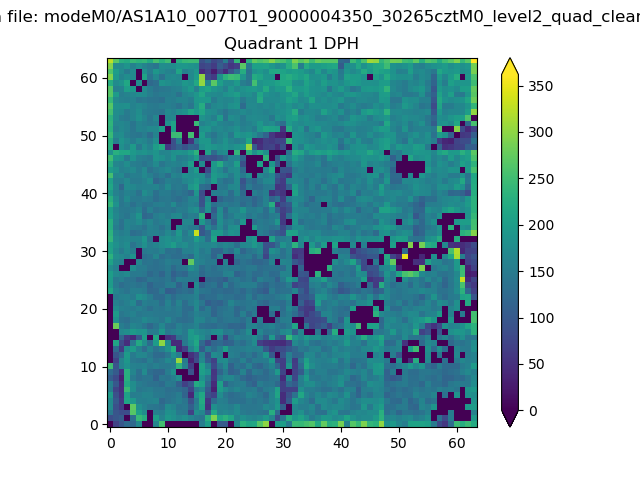 |
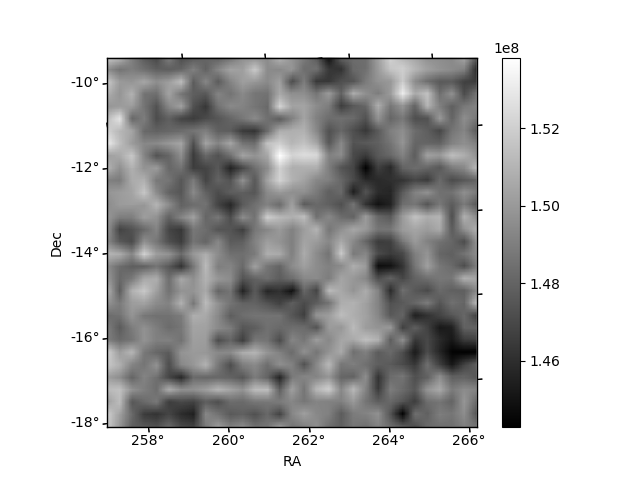
Quadrant B |
|---|---|---|---|
| Quadrant D | 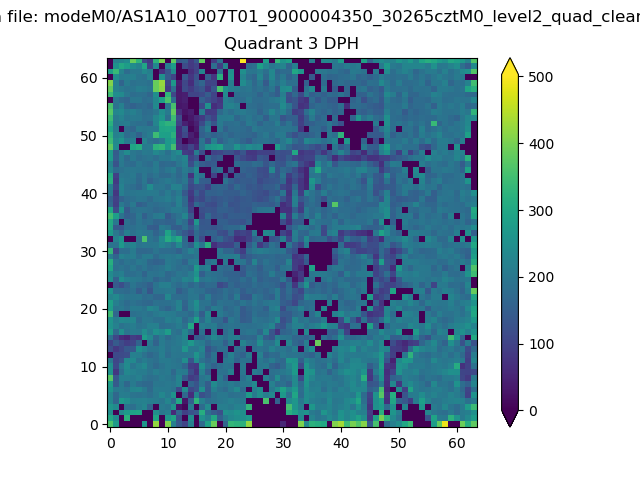 |
 |
Quadrant C |
| Plot type | Count rate plots | Images |
|---|---|---|
| Comparison with Poisson distribution Blue bars denote a histogram of data divided into 1 sec bins. Red curve is a Poisson curve with rate = median count rate of data. |
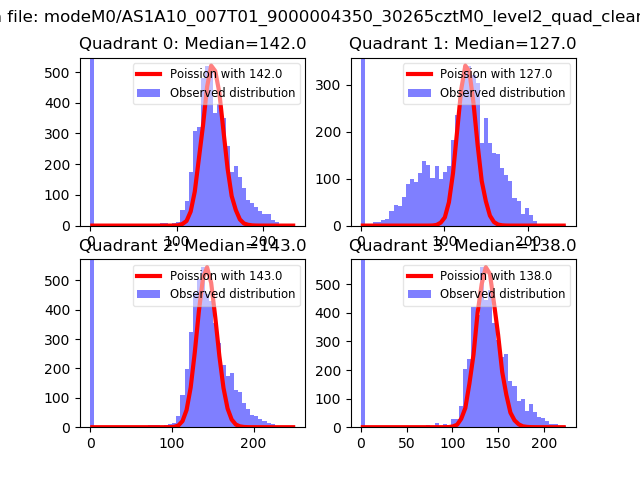 |
 |
| Quadrant-wise count rates Data is divided into 100 sec bins |
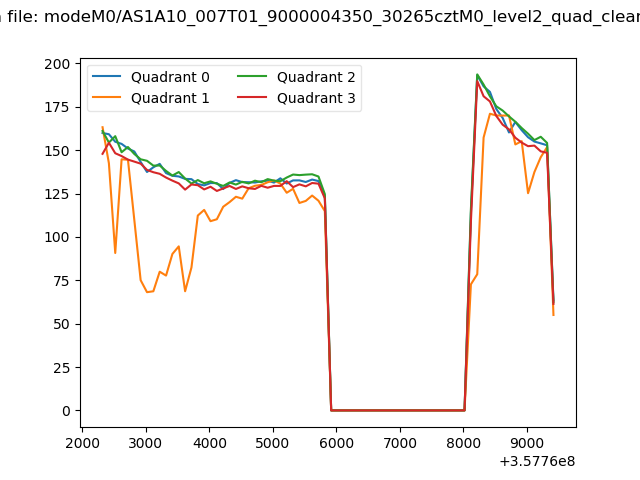 |
|
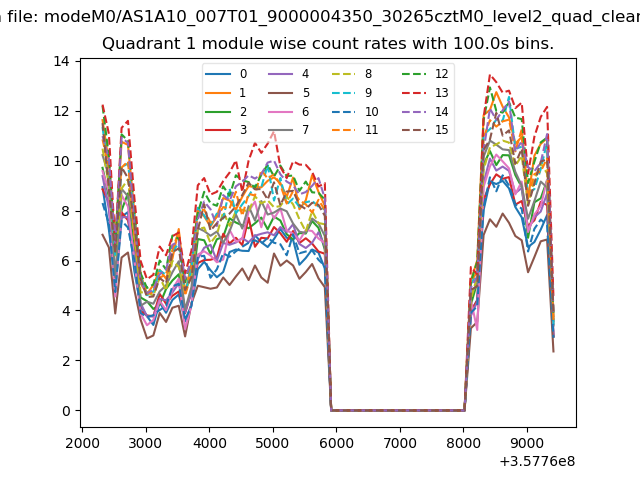
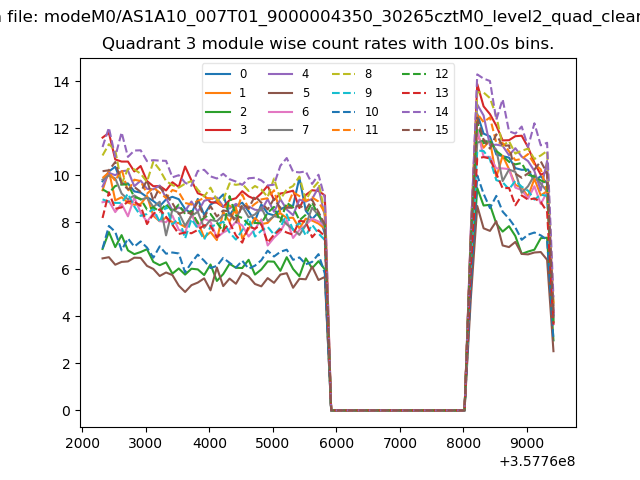
| Module-wise count rates for Quadrant A Data is divided into 100 sec bins |
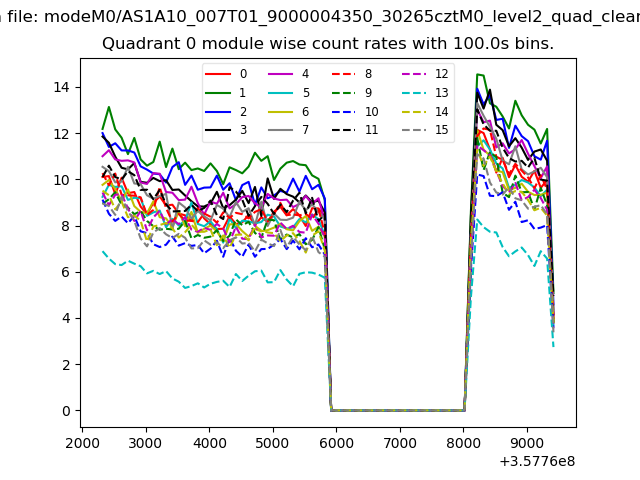 |
 |
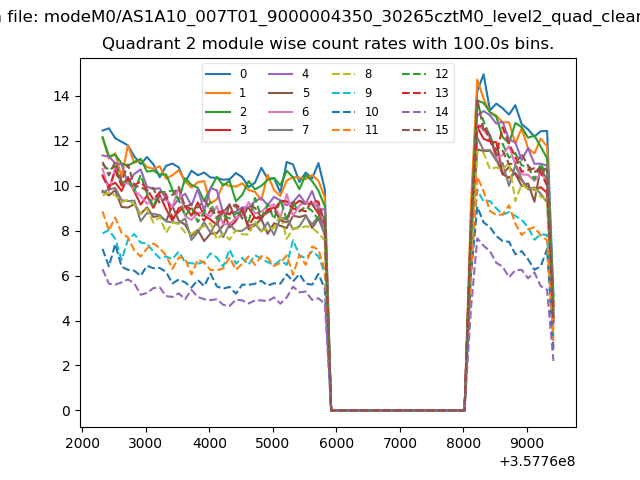
| Module-wise count rates for Quadrant B Data is divided into 100 sec bins |
 |
 |
| Module-wise count rates for Quadrant C Data is divided into 100 sec bins |
 |
 |
| Module-wise count rates for Quadrant D Data is divided into 100 sec bins |
 |
 |
| Parameter | Plot |
|---|---|
| CZT HV Monitor | 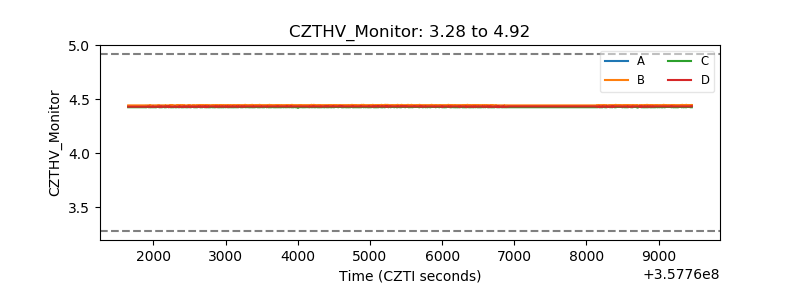 |
| D_VDD | 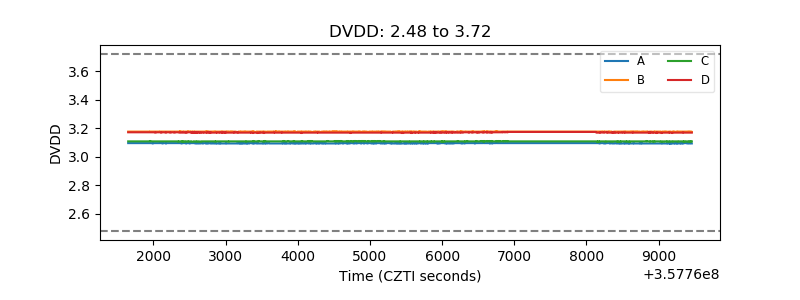 |
| Temperature 1 | 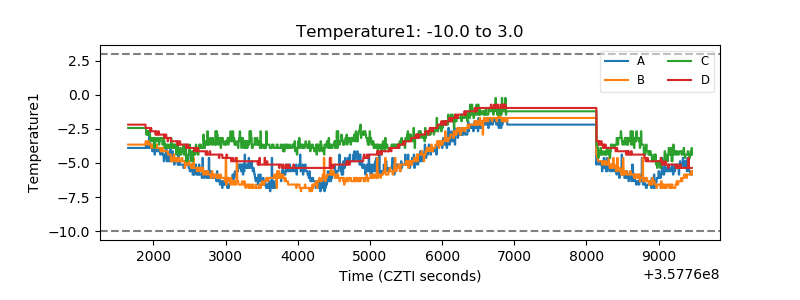 |
| Veto HV Monitor |  |
| Veto LLD | 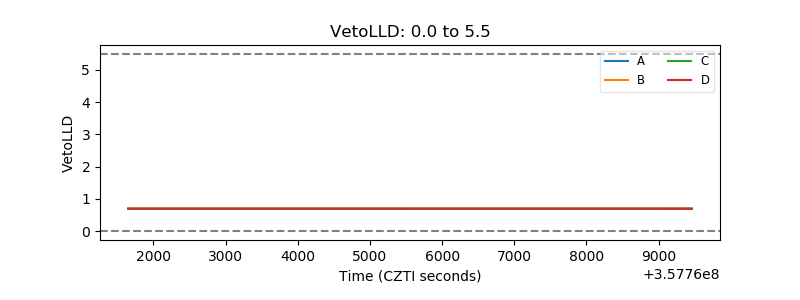 |
| Alpha Counter | 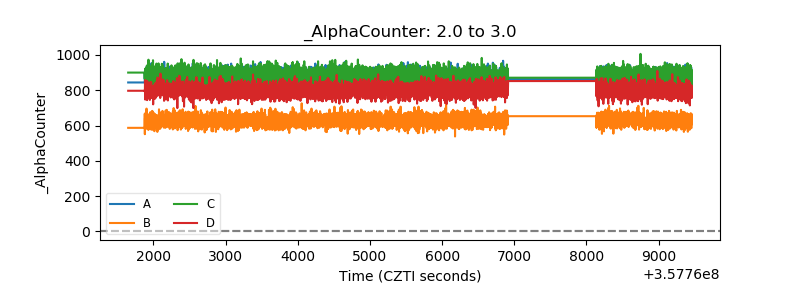 |
| _CPM_Rate | 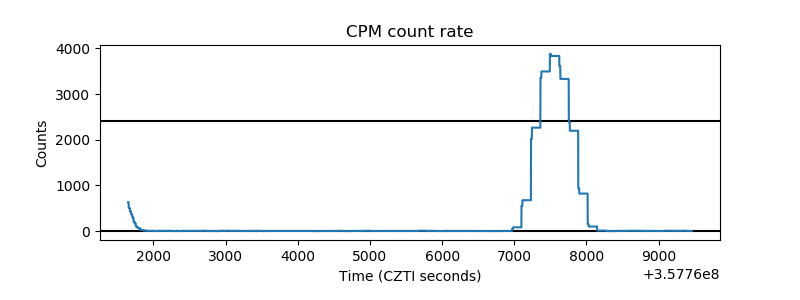 |
| CZT Counter | 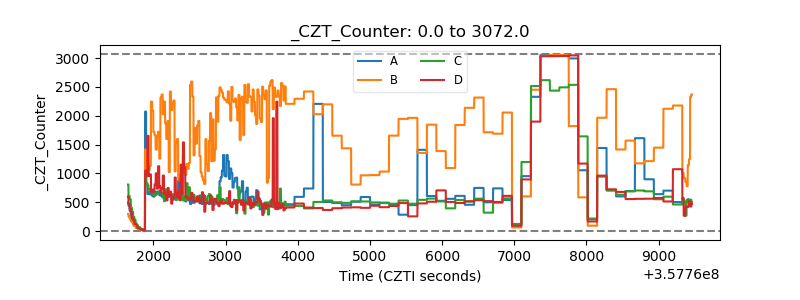 |
| +2.5 Volts monitor |  |
| +5 Volts monitor |  |
| _ROLL_ROT | 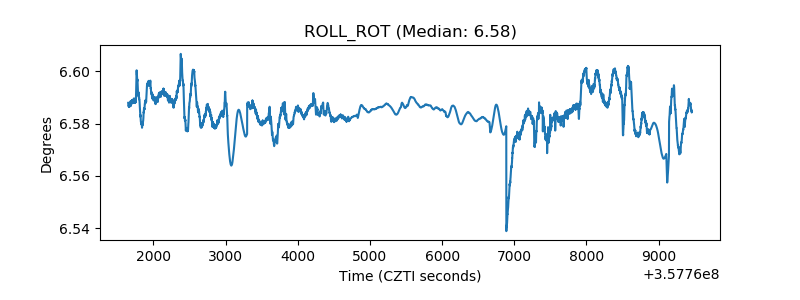 |
| _Roll_DEC | 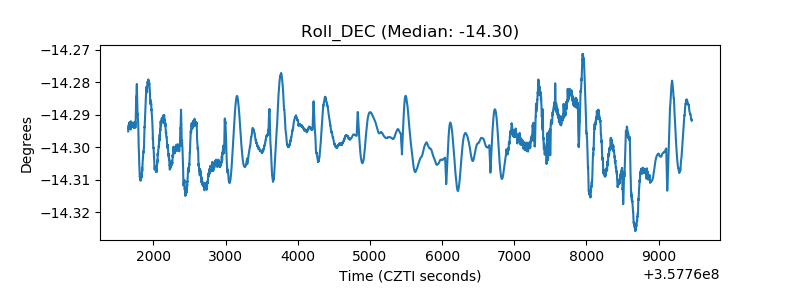 |
| _Roll_RA | 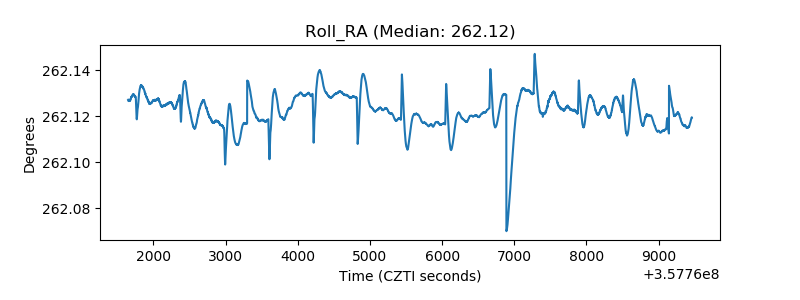 |
| Veto Counter | 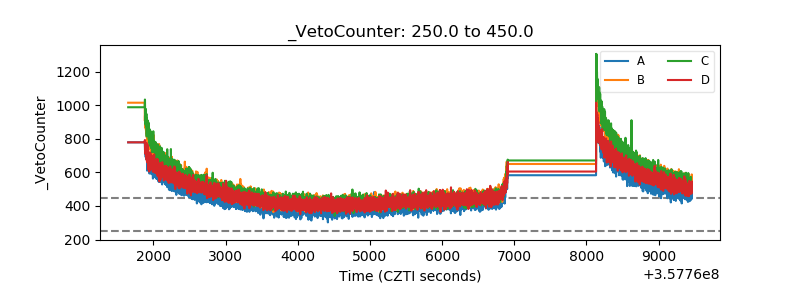 |