| Param | Original file | Final file |
|---|---|---|
| Filename | modeM0/AS1A10_007T01_9000004350_30266cztM0_level2.evt | modeM0/AS1A10_007T01_9000004350_30266cztM0_level2_quad_clean.evt |
| Size (bytes) | 774,066,240 | 107,576,640 |
| Size | 738.2 MB | 102.6 MB |
| Events in quadrant A | 3,745,386 | 757,874 |
| Events in quadrant B | 11,872,399 | 567,418 |
| Events in quadrant C | 3,846,877 | 759,102 |
| Events in quadrant D | 3,559,405 | 740,100 |
| Mode M9 | |||
|---|---|---|---|
| Quadrant | BADHDUFLAG | Total packets | Discarded packets |
| A | 0 | 16 | 0 |
| B | 0 | 17 | 0 |
| C | 0 | 17 | 0 |
| D | 0 | 17 | 0 |
| Mode SS | |||
|---|---|---|---|
| Quadrant | BADHDUFLAG | Total packets | Discarded packets |
| A | 0 | 126 | 0 |
| B | 0 | 126 | 0 |
| C | 0 | 126 | 0 |
| D | 0 | 126 | 0 |
| Mode M0 | |||
|---|---|---|---|
| Quadrant | BADHDUFLAG | Total packets | Discarded packets |
| A | 0 | 15263 | 3 |
| B | 0 | 39574 | 2 |
| C | 0 | 15495 | 2 |
| D | 0 | 14727 | 2 |
| Quadrant | Total seconds | Saturated seconds | Saturation percentage |
|---|---|---|---|
| A | 6192 | 87 | 1.405039% |
| B | 6192 | 3981 | 64.292636% |
| C | 6192 | 341 | 5.507106% |
| D | 6192 | 25 | 0.403747% |
Noise dominated data is calculated using 1-second bins in cleaned event files. If a bin has >2000 counts, and if more than 50% of those come from <1% of pixels, then it is considered to be noise-dominated and hence unusable.
| Quadrant | # 1 sec bins | Bins with >0 counts | Bins with >2000 counts | High rate bins dominated by noise | Noise dominated (total time) | Noise dominated (detector-on time) | Marked lightcurve |
|---|---|---|---|---|---|---|---|
| A | 7497 | 6193 | 19 | 19 | 0.25% | 0.31% | 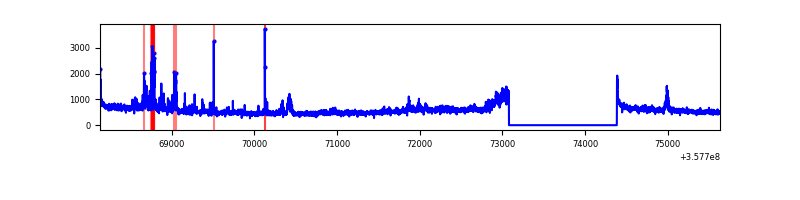 |
| B | 7497 | 6193 | 3089 | 3089 | 41.20% | 49.88% | 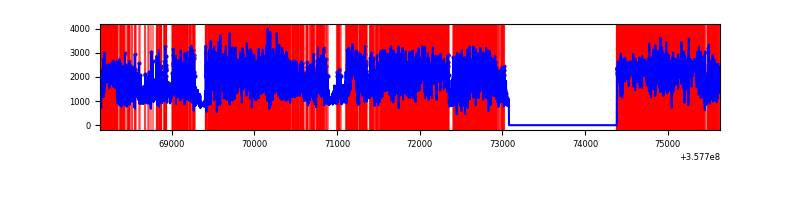 |
| C | 7497 | 6193 | 1 | 1 | 0.01% | 0.02% | 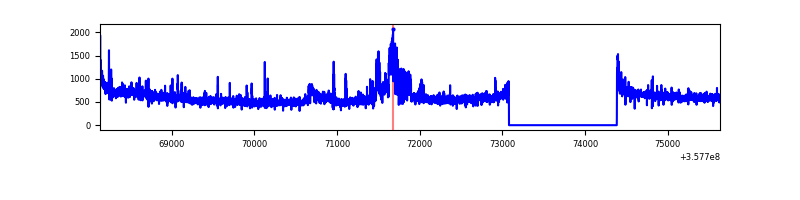 |
| D | 7497 | 6193 | 11 | 11 | 0.15% | 0.18% | 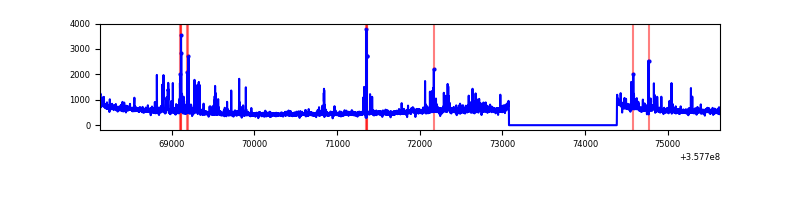 |
Top three noisy pixels from each quadrant. If the there are fewer than three noisy pixels in the level2.evt file, extra rows are filled as -1
| Pixel properties | Quadrant properties | ||||||
|---|---|---|---|---|---|---|---|
| Quadrant | DetID | PixID | Counts | Sigma | Mean | Median | Sigma |
| A | 14 | 239 | 488831 | 2935.18 | 836 | 821 | 166.3 |
| A | 8 | 192 | 23538 | 136.63 | 836 | 821 | 166.3 |
| A | 13 | 254 | 11248 | 62.71 | 836 | 821 | 166.3 |
| B | 6 | 36 | 7798713 | 65663.49 | 631 | 616 | 118.8 |
| B | 6 | 159 | 1430144 | 12037.27 | 631 | 616 | 118.8 |
| B | 0 | 229 | 101205 | 847.0 | 631 | 616 | 118.8 |
| C | 3 | 233 | 363821 | 1899.28 | 817 | 828 | 191.1 |
| C | 14 | 238 | 190715 | 993.54 | 817 | 828 | 191.1 |
| C | 14 | 254 | 86086 | 446.09 | 817 | 828 | 191.1 |
| D | 5 | 222 | 142921 | 711.5 | 820 | 806 | 199.7 |
| D | 2 | 250 | 127366 | 633.62 | 820 | 806 | 199.7 |
| D | 1 | 52 | 70458 | 348.71 | 820 | 806 | 199.7 |
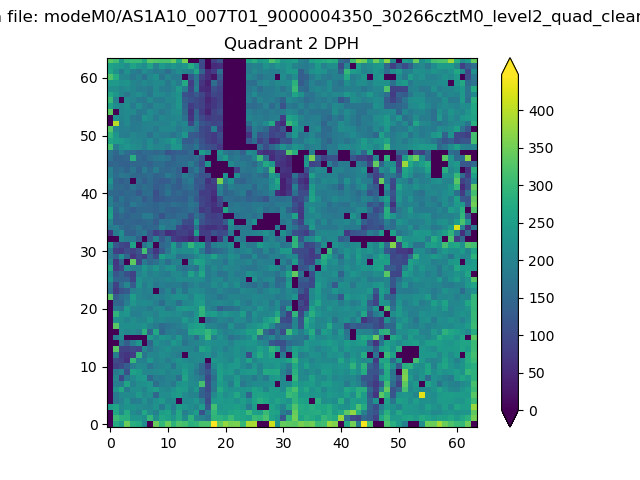
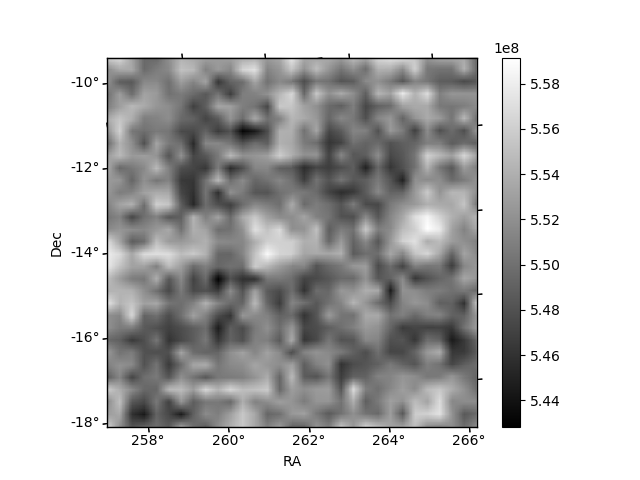
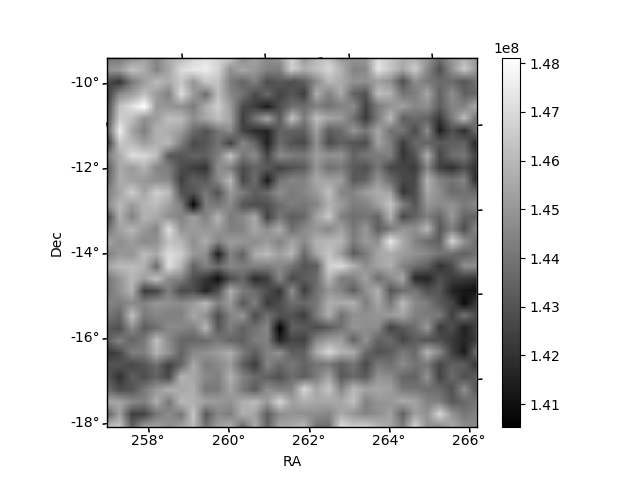
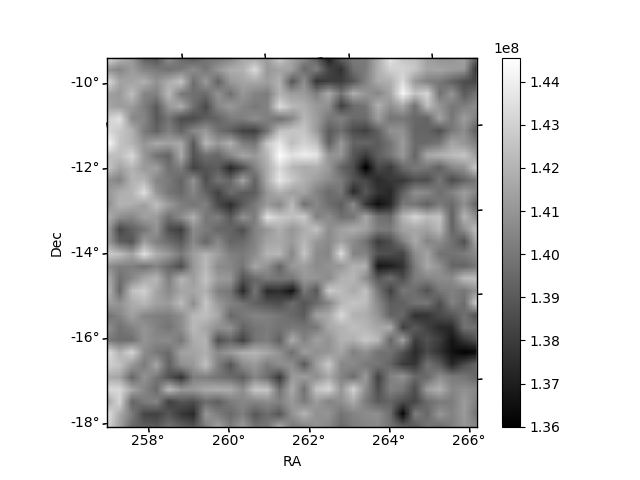
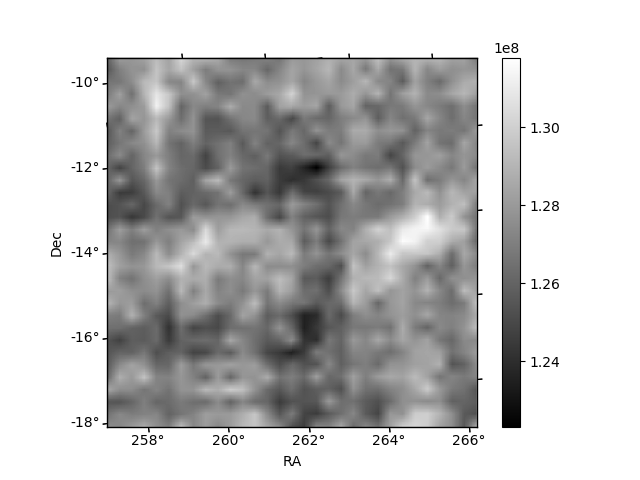
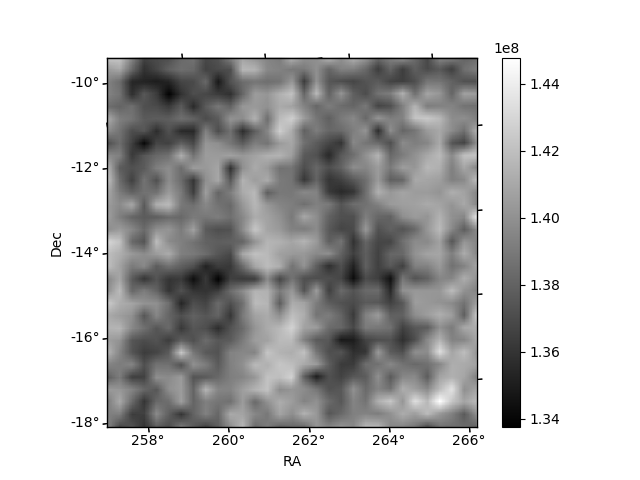
Histogram calculated using DETX and DETY for each event in the final _common_clean file
| Quadrant A | 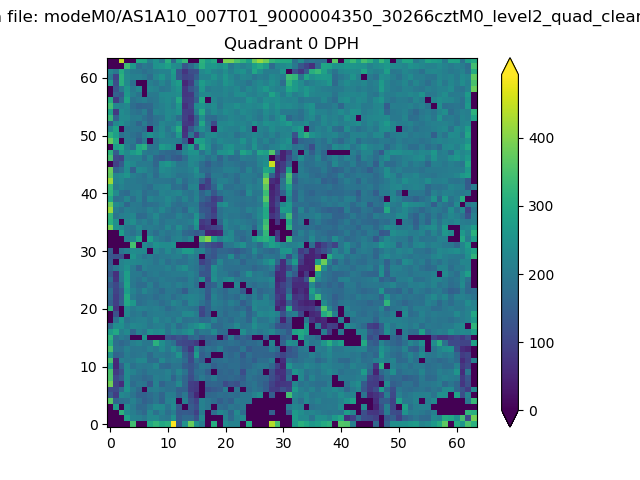 |
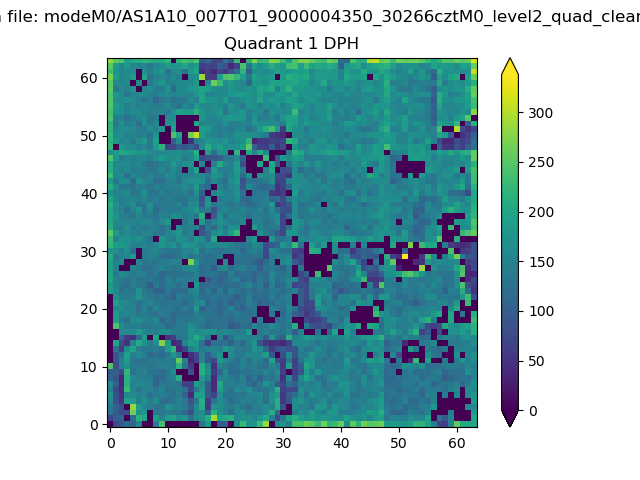 |
Quadrant B |
|---|---|---|---|
| Quadrant D | 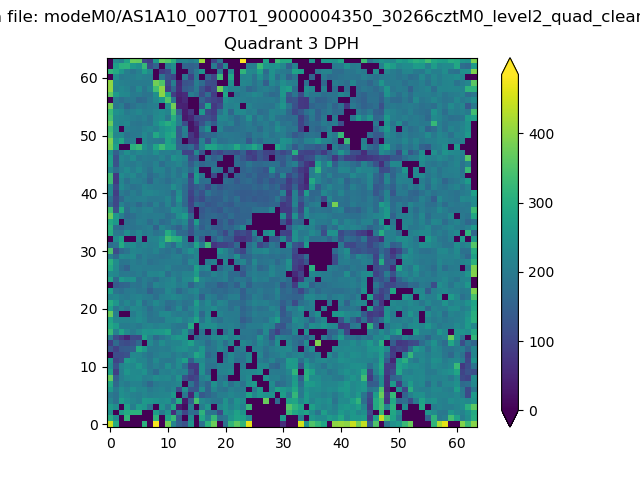 |
 |
Quadrant C |
| Plot type | Count rate plots | Images |
|---|---|---|
| Comparison with Poisson distribution Blue bars denote a histogram of data divided into 1 sec bins. Red curve is a Poisson curve with rate = median count rate of data. |
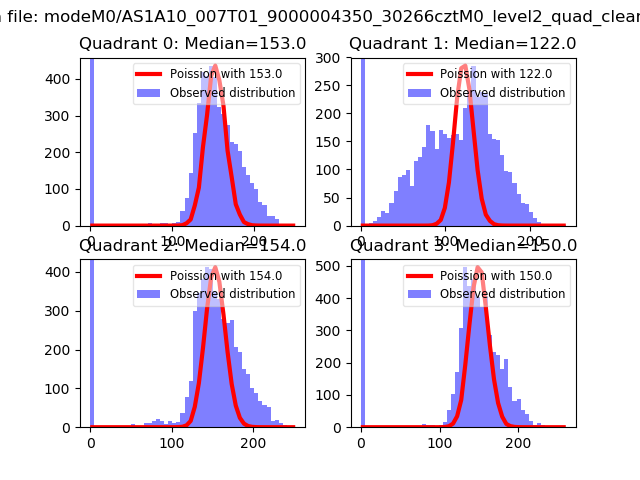 |
 |
| Quadrant-wise count rates Data is divided into 100 sec bins |
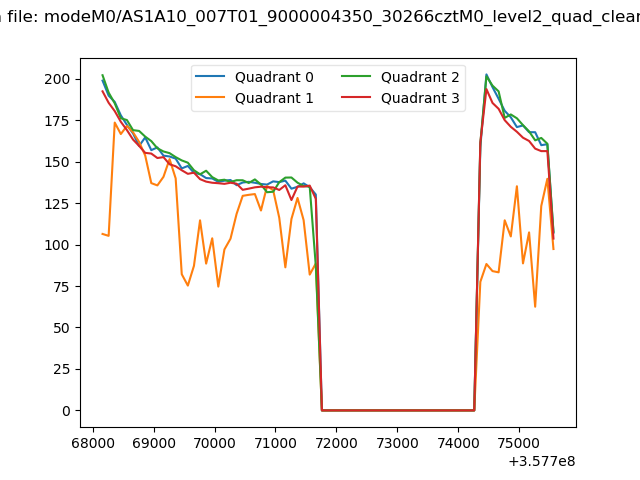 |
|
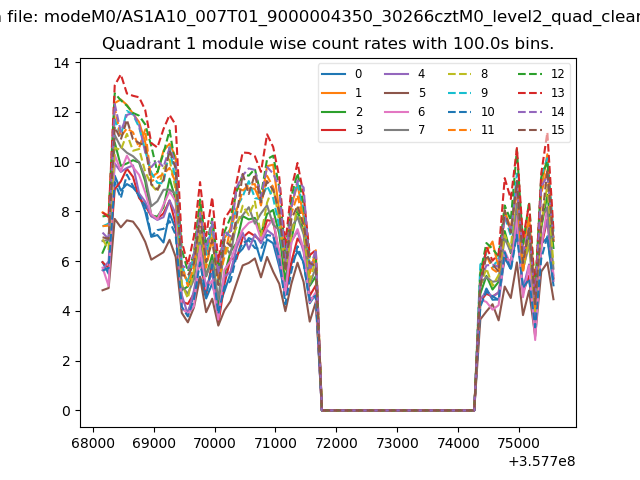
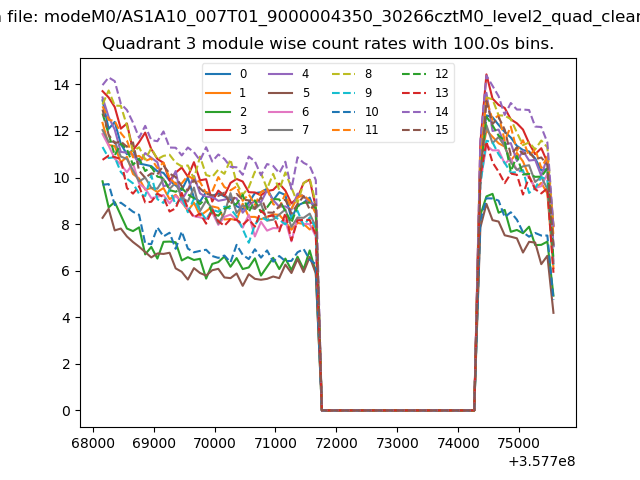
| Module-wise count rates for Quadrant A Data is divided into 100 sec bins |
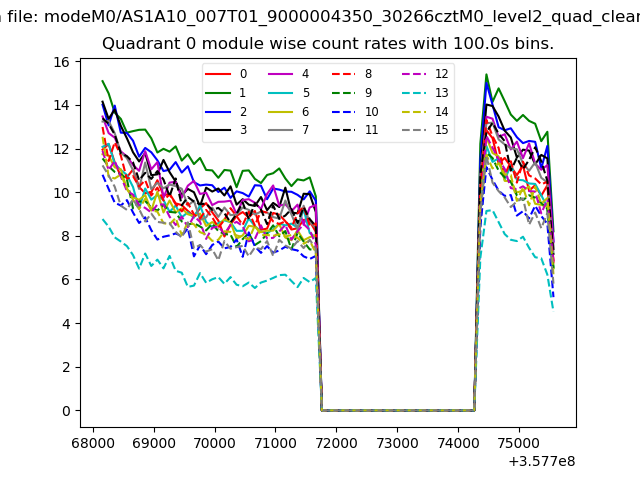 |
 |
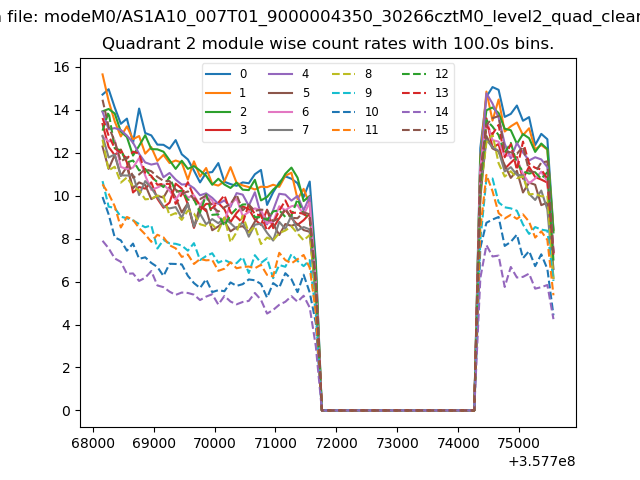
| Module-wise count rates for Quadrant B Data is divided into 100 sec bins |
 |
 |
| Module-wise count rates for Quadrant C Data is divided into 100 sec bins |
 |
 |
| Module-wise count rates for Quadrant D Data is divided into 100 sec bins |
 |
 |
| Parameter | Plot |
|---|---|
| CZT HV Monitor | 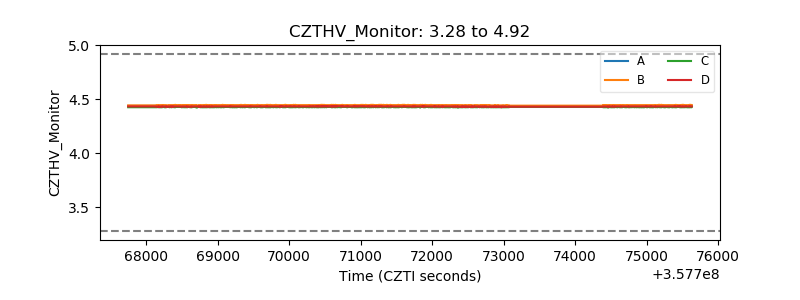 |
| D_VDD | 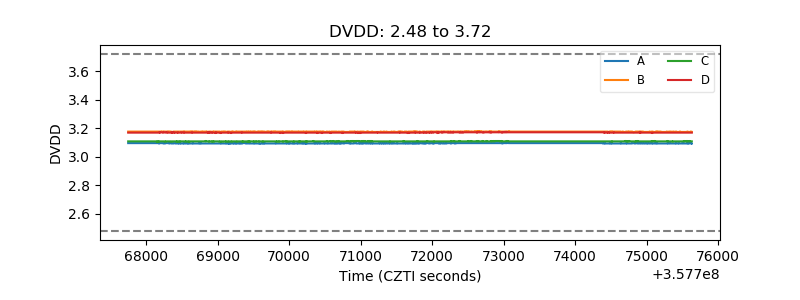 |
| Temperature 1 | 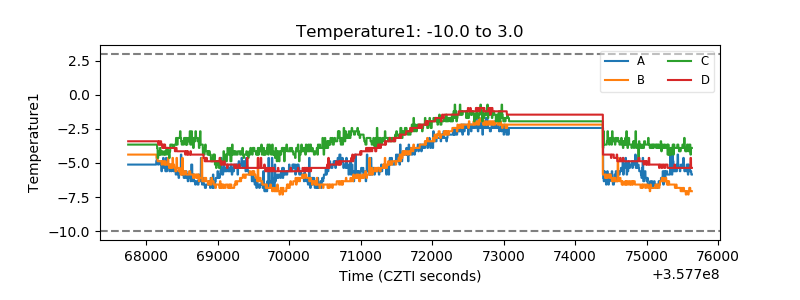 |
| Veto HV Monitor |  |
| Veto LLD | 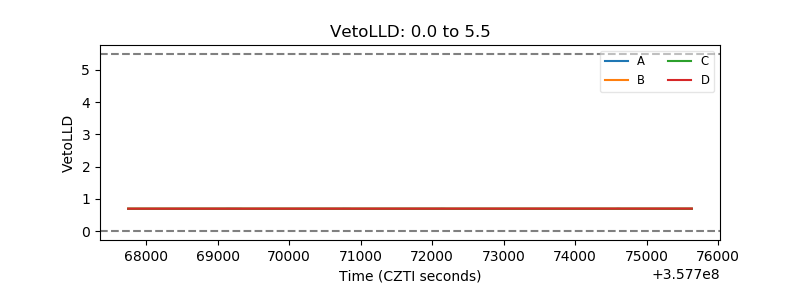 |
| Alpha Counter | 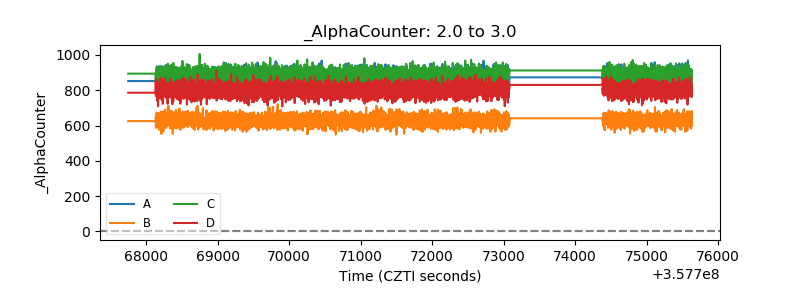 |
| _CPM_Rate | 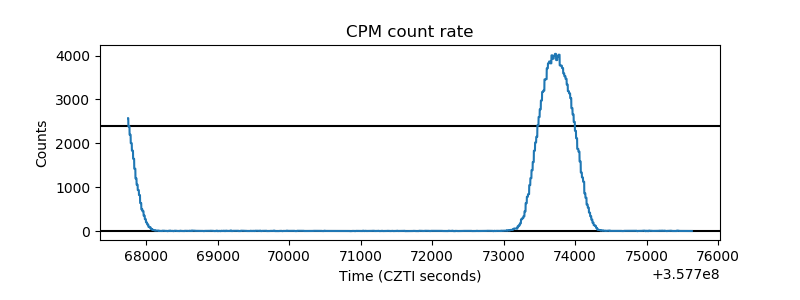 |
| CZT Counter | 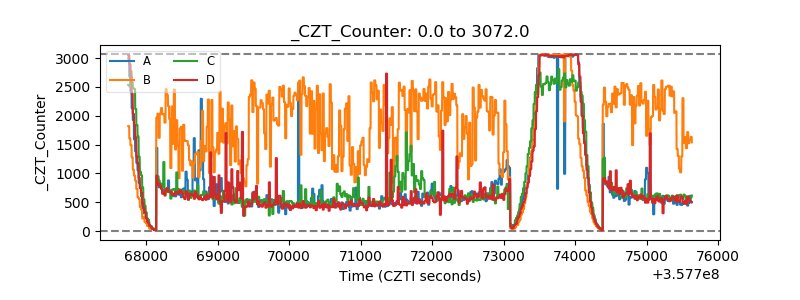 |
| +2.5 Volts monitor |  |
| +5 Volts monitor |  |
| _ROLL_ROT | 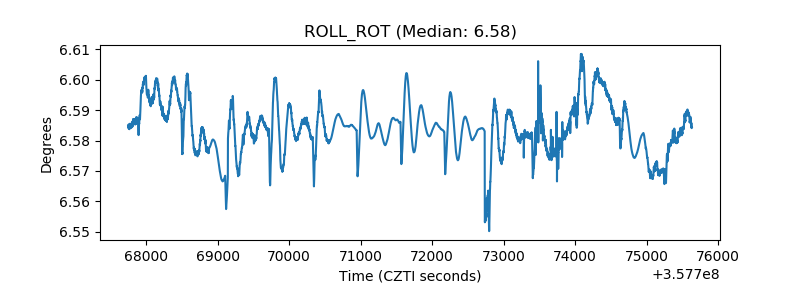 |
| _Roll_DEC | 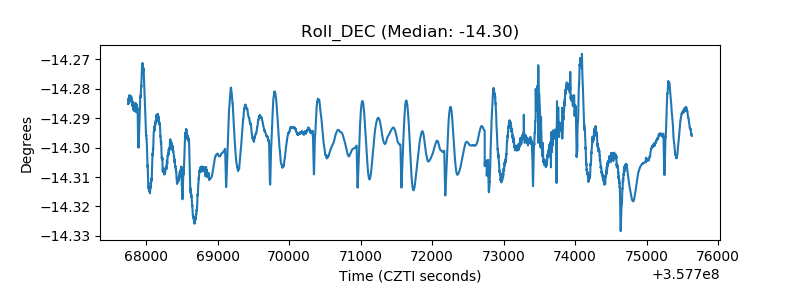 |
| _Roll_RA | 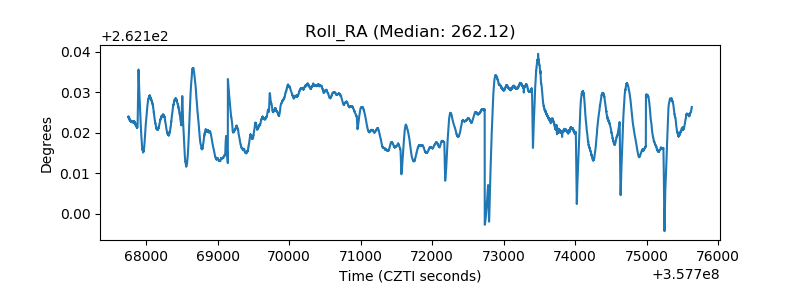 |
| Veto Counter | 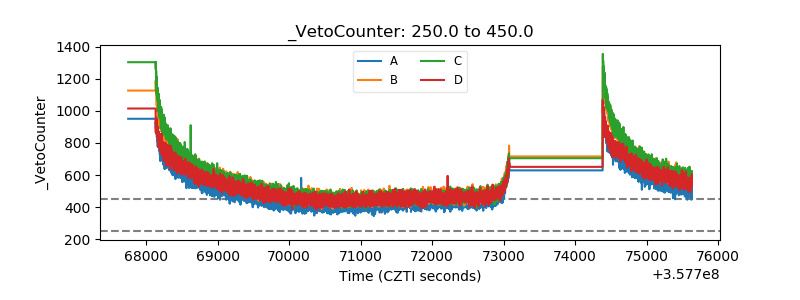 |