| Param | Original file | Final file |
|---|---|---|
| Filename | modeM0/AS1A10_007T01_9000004350_30267cztM0_level2.evt | modeM0/AS1A10_007T01_9000004350_30267cztM0_level2_quad_clean.evt |
| Size (bytes) | 781,390,080 | 101,966,400 |
| Size | 745.2 MB | 97.2 MB |
| Events in quadrant A | 3,502,275 | 725,230 |
| Events in quadrant B | 12,479,269 | 494,643 |
| Events in quadrant C | 3,687,743 | 729,787 |
| Events in quadrant D | 3,579,870 | 708,170 |
| Mode M9 | |||
|---|---|---|---|
| Quadrant | BADHDUFLAG | Total packets | Discarded packets |
| A | 0 | 25 | 0 |
| B | 0 | 26 | 0 |
| C | 0 | 26 | 0 |
| D | 0 | 26 | 0 |
| Mode SS | |||
|---|---|---|---|
| Quadrant | BADHDUFLAG | Total packets | Discarded packets |
| A | 0 | 124 | 0 |
| B | 0 | 124 | 0 |
| C | 0 | 124 | 0 |
| D | 0 | 124 | 0 |
| Mode M0 | |||
|---|---|---|---|
| Quadrant | BADHDUFLAG | Total packets | Discarded packets |
| A | 0 | 14205 | 2 |
| B | 0 | 41236 | 2 |
| C | 0 | 15027 | 2 |
| D | 0 | 14628 | 3 |
| Quadrant | Total seconds | Saturated seconds | Saturation percentage |
|---|---|---|---|
| A | 6143 | 67 | 1.090672% |
| B | 6143 | 4415 | 71.870422% |
| C | 6143 | 123 | 2.002279% |
| D | 6142 | 30 | 0.488440% |
Noise dominated data is calculated using 1-second bins in cleaned event files. If a bin has >2000 counts, and if more than 50% of those come from <1% of pixels, then it is considered to be noise-dominated and hence unusable.
| Quadrant | # 1 sec bins | Bins with >0 counts | Bins with >2000 counts | High rate bins dominated by noise | Noise dominated (total time) | Noise dominated (detector-on time) | Marked lightcurve |
|---|---|---|---|---|---|---|---|
| A | 7513 | 6144 | 14 | 14 | 0.19% | 0.23% | 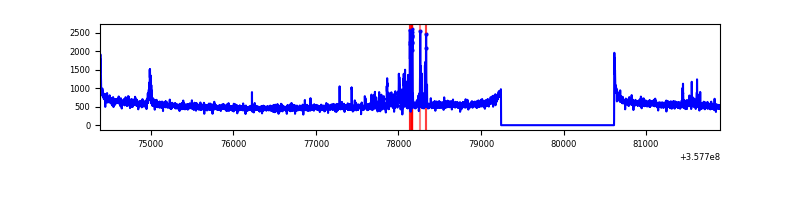 |
| B | 7512 | 6143 | 3553 | 3553 | 47.30% | 57.84% | 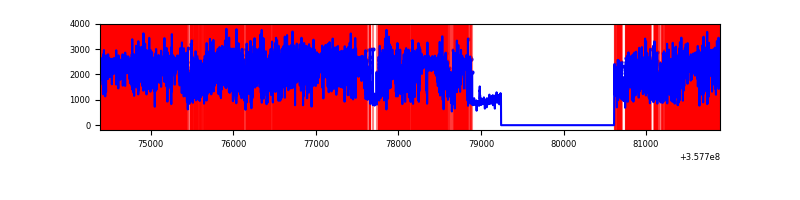 |
| C | 7513 | 6144 | 0 | 0 | 0.00% | 0.00% | 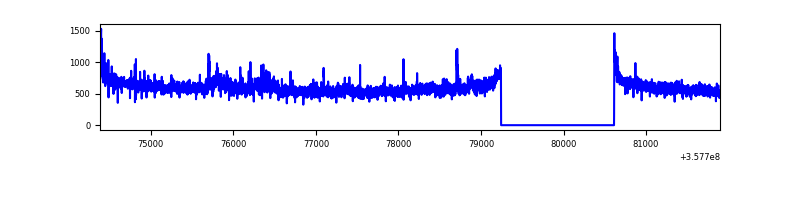 |
| D | 7512 | 6143 | 15 | 15 | 0.20% | 0.24% | 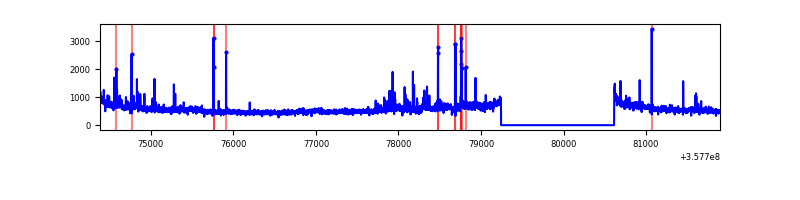 |
Top three noisy pixels from each quadrant. If the there are fewer than three noisy pixels in the level2.evt file, extra rows are filled as -1
| Pixel properties | Quadrant properties | ||||||
|---|---|---|---|---|---|---|---|
| Quadrant | DetID | PixID | Counts | Sigma | Mean | Median | Sigma |
| A | 14 | 239 | 240859 | 1452.01 | 838 | 825 | 165.3 |
| A | 8 | 192 | 24202 | 141.41 | 838 | 825 | 165.3 |
| A | 13 | 254 | 11508 | 64.62 | 838 | 825 | 165.3 |
| B | 6 | 36 | 8690954 | 75939.38 | 610 | 596 | 114.4 |
| B | 6 | 159 | 1329175 | 11609.59 | 610 | 596 | 114.4 |
| B | 0 | 229 | 32624 | 279.87 | 610 | 596 | 114.4 |
| C | 3 | 233 | 300403 | 1560.05 | 826 | 836 | 192.0 |
| C | 14 | 238 | 139278 | 720.96 | 826 | 836 | 192.0 |
| C | 2 | 114 | 14641 | 71.89 | 826 | 836 | 192.0 |
| D | 8 | 195 | 249543 | 1244.73 | 820 | 803 | 199.8 |
| D | 2 | 250 | 59403 | 293.24 | 820 | 803 | 199.8 |
| D | 5 | 222 | 55040 | 271.41 | 820 | 803 | 199.8 |
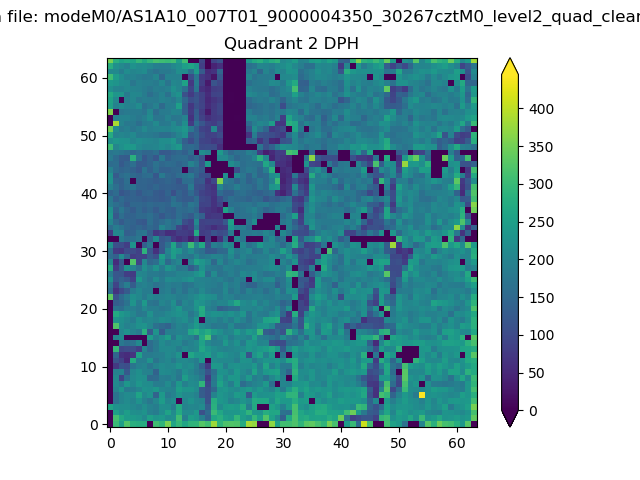
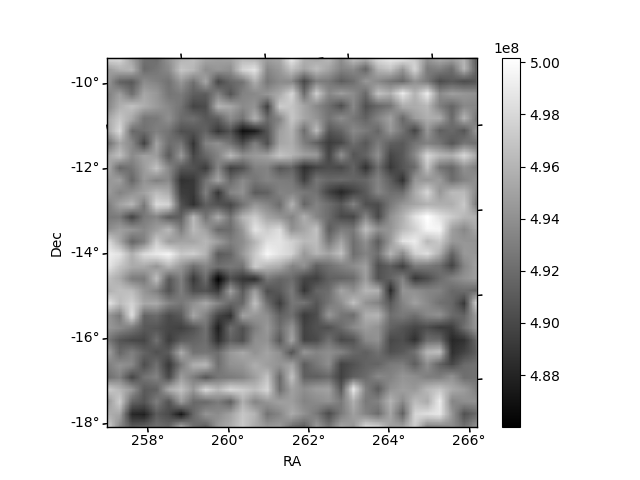
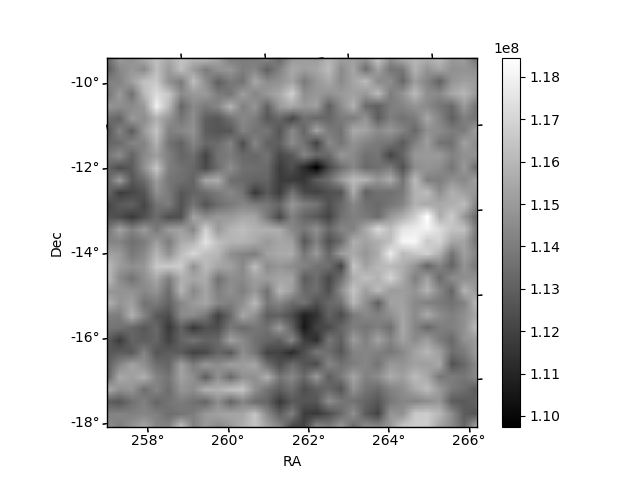
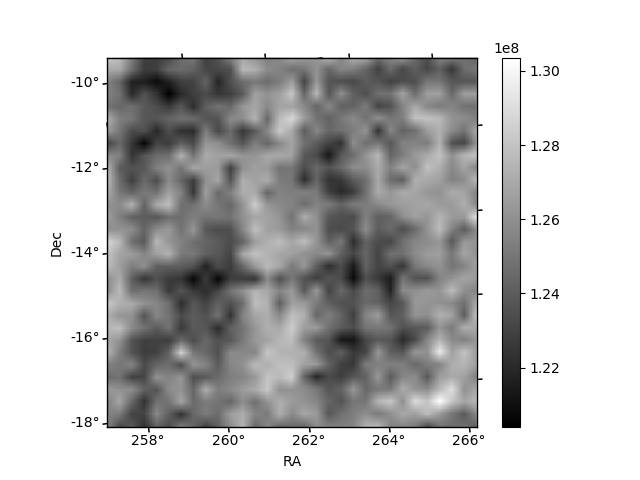
Histogram calculated using DETX and DETY for each event in the final _common_clean file
| Quadrant A | 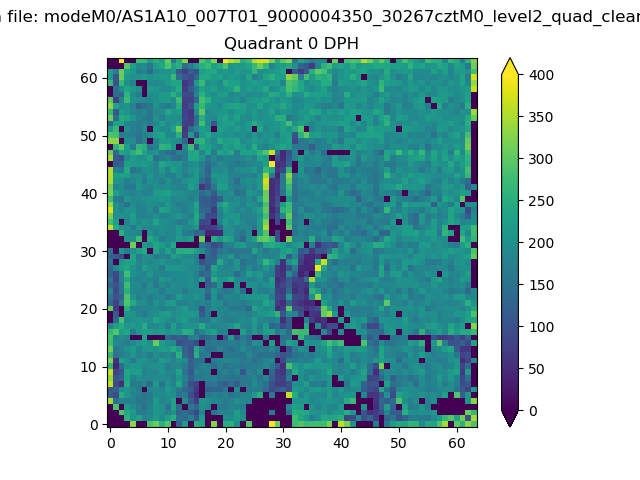 |
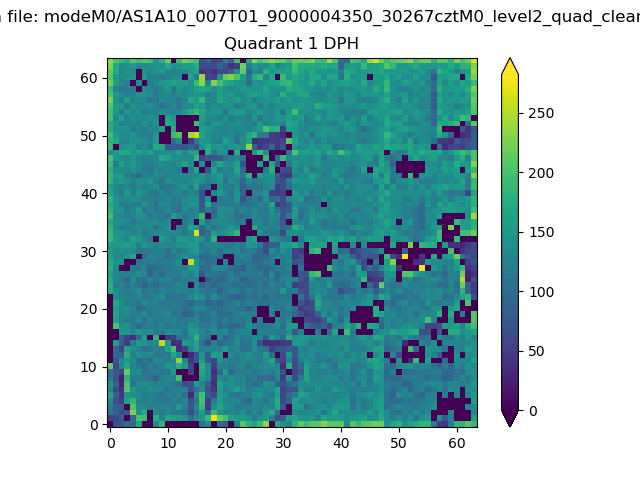 |
Quadrant B |
|---|---|---|---|
| Quadrant D | 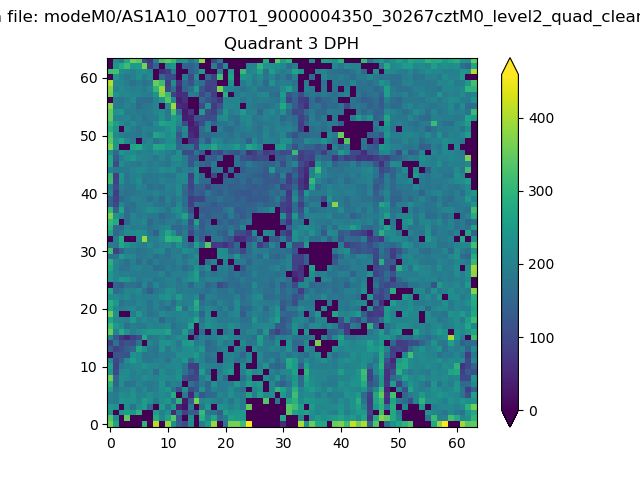 |
 |
Quadrant C |
| Plot type | Count rate plots | Images |
|---|---|---|
| Comparison with Poisson distribution Blue bars denote a histogram of data divided into 1 sec bins. Red curve is a Poisson curve with rate = median count rate of data. |
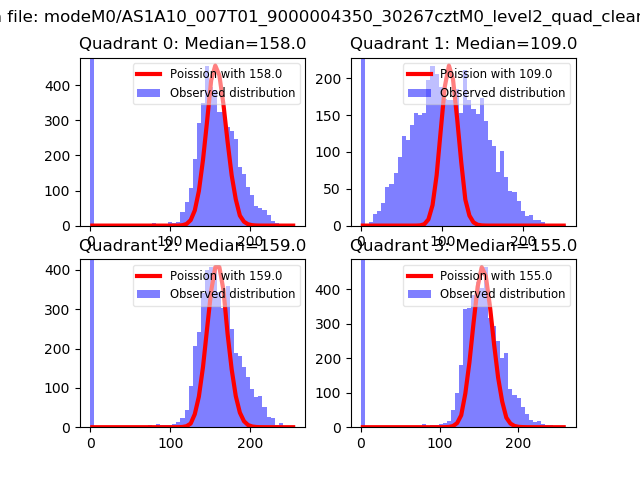 |
 |
| Quadrant-wise count rates Data is divided into 100 sec bins |
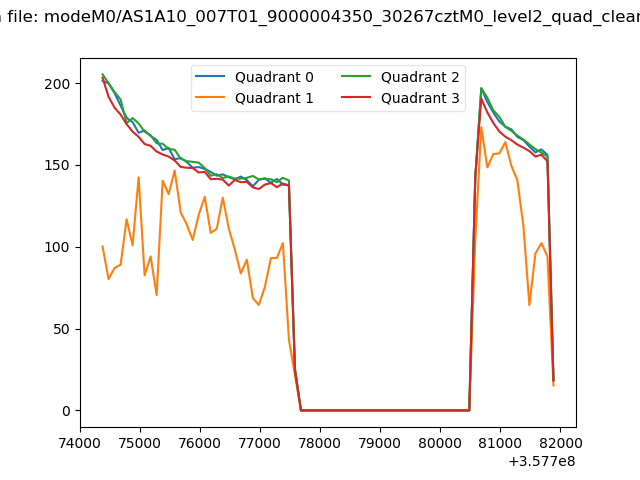 |
|
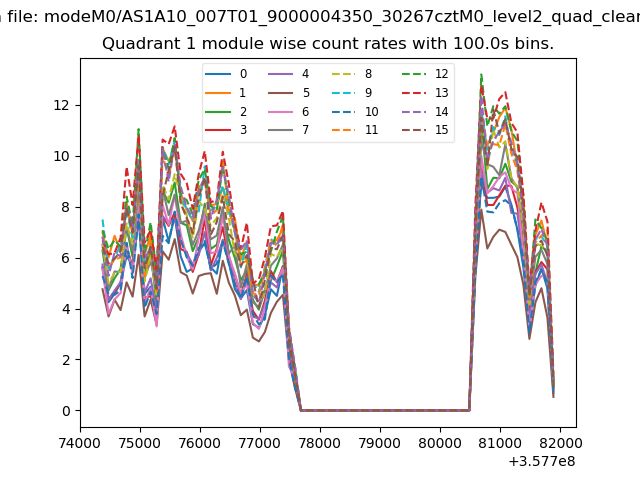
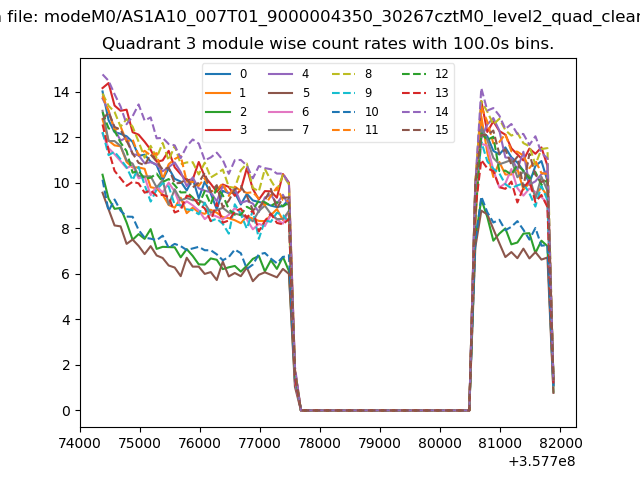
| Module-wise count rates for Quadrant A Data is divided into 100 sec bins |
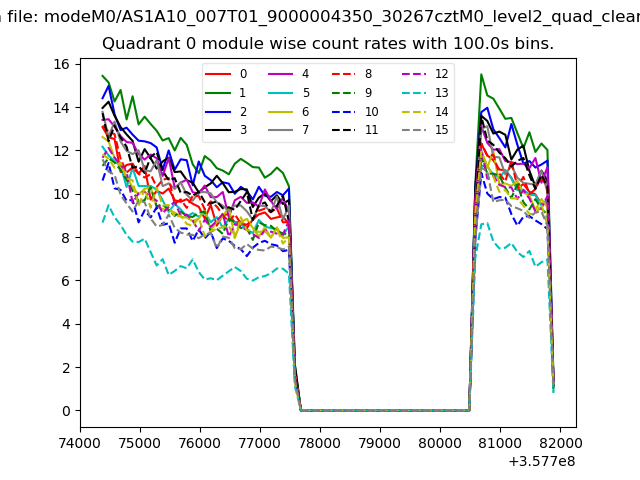 |
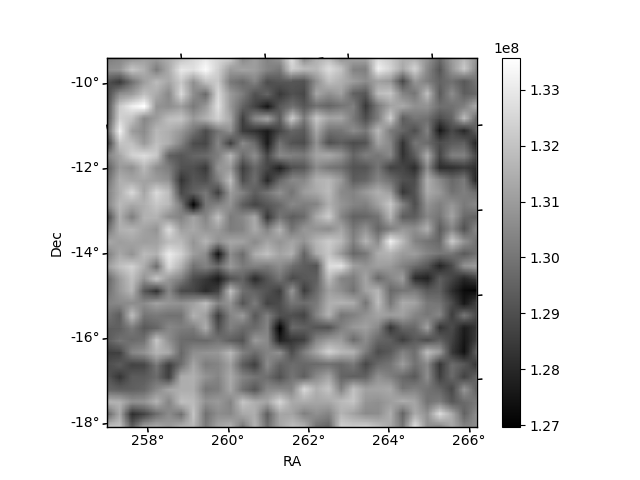 |
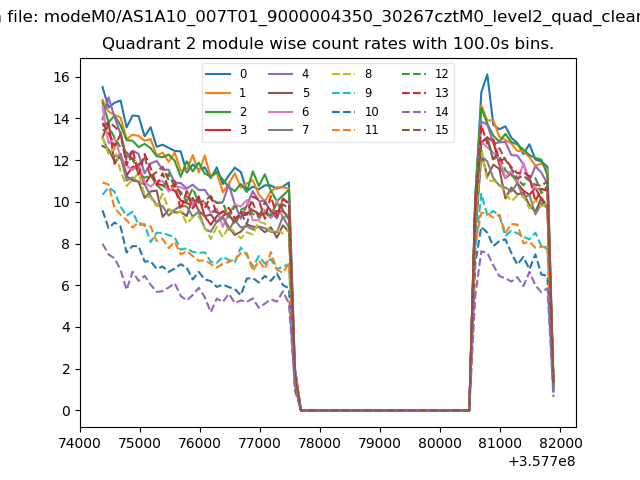
| Module-wise count rates for Quadrant B Data is divided into 100 sec bins |
 |
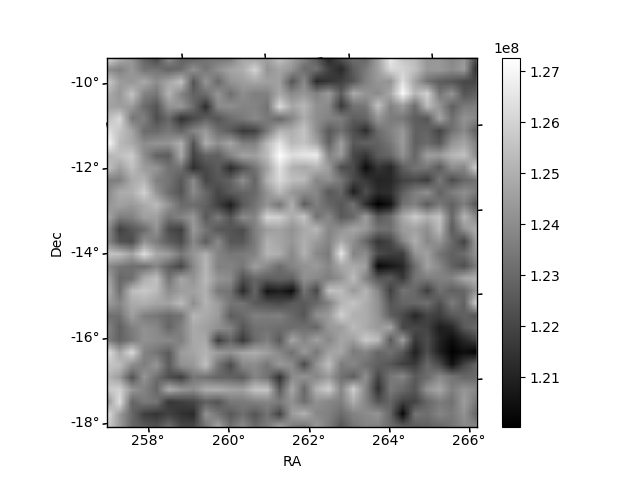 |
| Module-wise count rates for Quadrant C Data is divided into 100 sec bins |
 |
 |
| Module-wise count rates for Quadrant D Data is divided into 100 sec bins |
 |
 |
| Parameter | Plot |
|---|---|
| CZT HV Monitor | 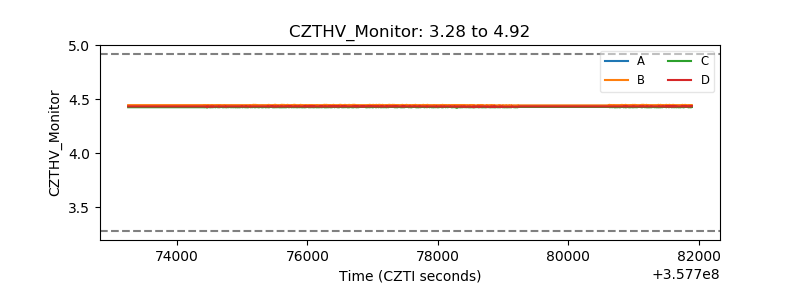 |
| D_VDD | 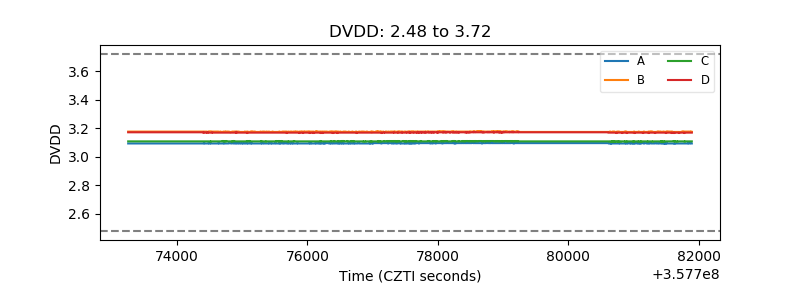 |
| Temperature 1 |  |
| Veto HV Monitor |  |
| Veto LLD | 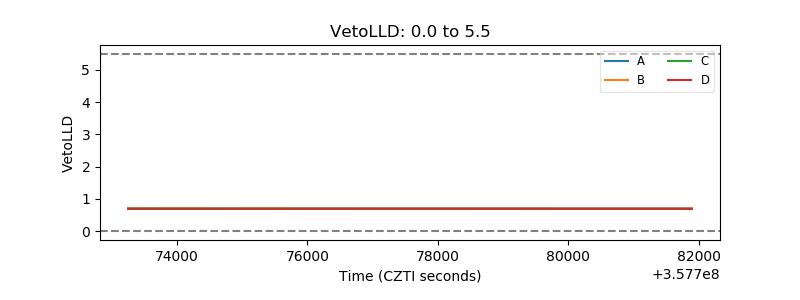 |
| Alpha Counter | 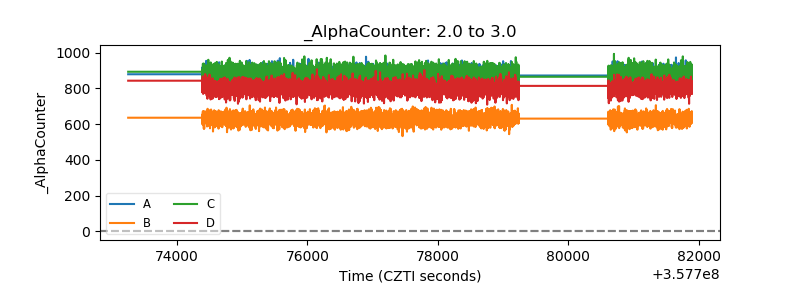 |
| _CPM_Rate | 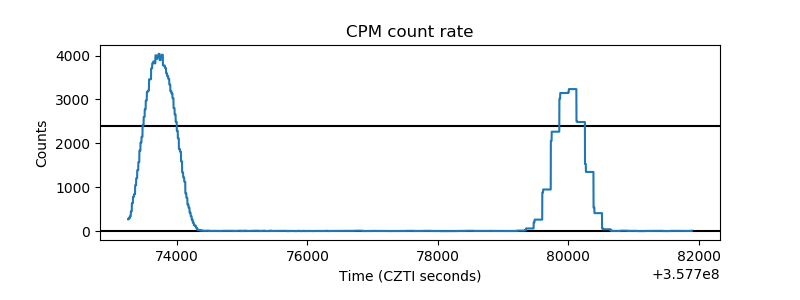 |
| CZT Counter | 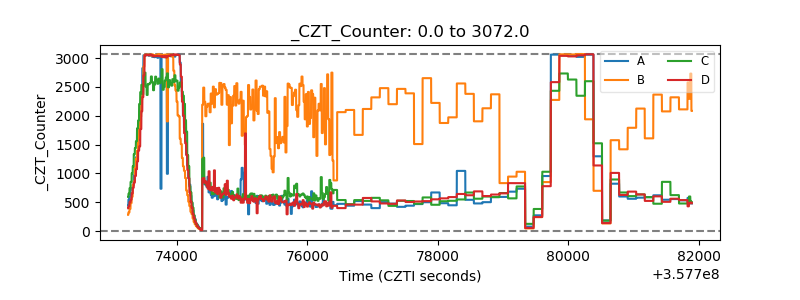 |
| +2.5 Volts monitor |  |
| +5 Volts monitor |  |
| _ROLL_ROT | 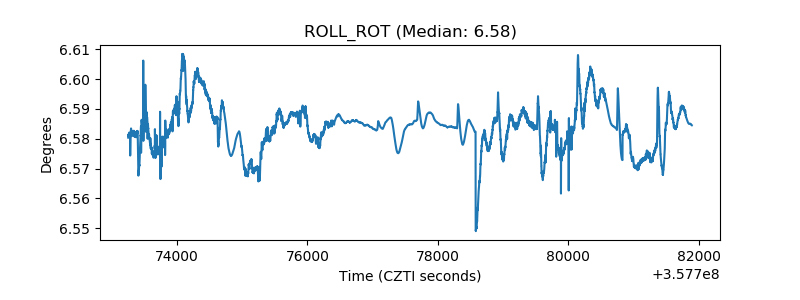 |
| _Roll_DEC | 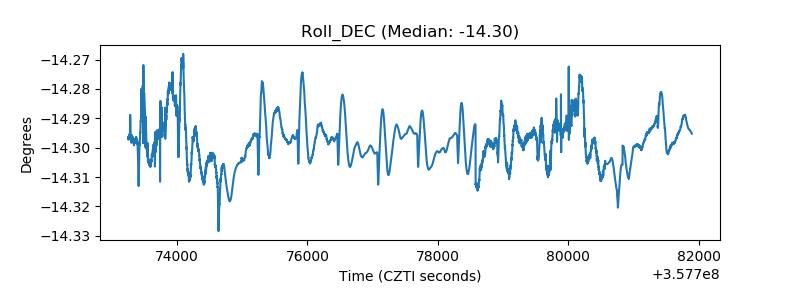 |
| _Roll_RA | 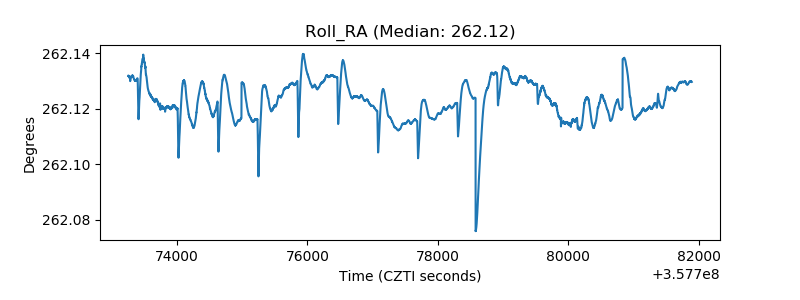 |
| Veto Counter | 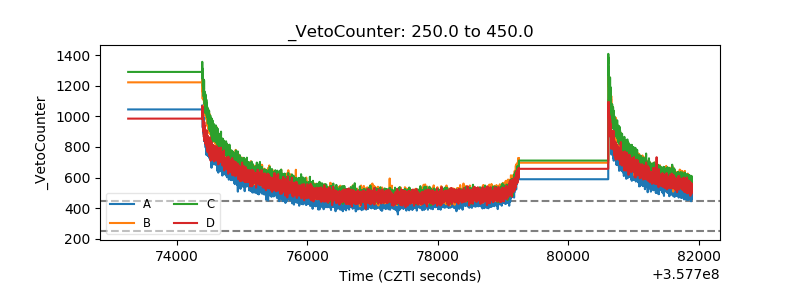 |