| Param | Original file | Final file |
|---|---|---|
| Filename | modeM0/AS1A10_007T01_9000004350_30268cztM0_level2.evt | modeM0/AS1A10_007T01_9000004350_30268cztM0_level2_quad_clean.evt |
| Size (bytes) | 863,591,040 | 102,499,200 |
| Size | 823.6 MB | 97.8 MB |
| Events in quadrant A | 4,372,973 | 709,789 |
| Events in quadrant B | 13,613,168 | 500,680 |
| Events in quadrant C | 3,677,635 | 720,910 |
| Events in quadrant D | 4,036,337 | 703,188 |
| Mode M9 | |||
|---|---|---|---|
| Quadrant | BADHDUFLAG | Total packets | Discarded packets |
| A | 0 | 17 | 0 |
| B | 0 | 18 | 0 |
| C | 0 | 18 | 0 |
| D | 0 | 18 | 0 |
| Mode SS | |||
|---|---|---|---|
| Quadrant | BADHDUFLAG | Total packets | Discarded packets |
| A | 0 | 134 | 0 |
| B | 0 | 134 | 0 |
| C | 0 | 134 | 0 |
| D | 0 | 134 | 0 |
| Mode M0 | |||
|---|---|---|---|
| Quadrant | BADHDUFLAG | Total packets | Discarded packets |
| A | 0 | 17225 | 1 |
| B | 0 | 45037 | 5 |
| C | 0 | 14852 | 1 |
| D | 0 | 16159 | 1 |
| Quadrant | Total seconds | Saturated seconds | Saturation percentage |
|---|---|---|---|
| A | 6715 | 217 | 3.231571% |
| B | 6714 | 4933 | 73.473339% |
| C | 6714 | 147 | 2.189455% |
| D | 6714 | 136 | 2.025618% |
Noise dominated data is calculated using 1-second bins in cleaned event files. If a bin has >2000 counts, and if more than 50% of those come from <1% of pixels, then it is considered to be noise-dominated and hence unusable.
| Quadrant | # 1 sec bins | Bins with >0 counts | Bins with >2000 counts | High rate bins dominated by noise | Noise dominated (total time) | Noise dominated (detector-on time) | Marked lightcurve |
|---|---|---|---|---|---|---|---|
| A | 8015 | 6716 | 111 | 111 | 1.38% | 1.65% | 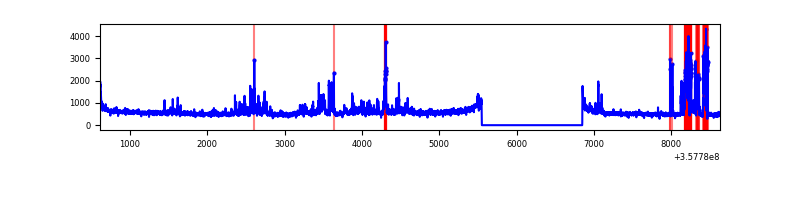 |
| B | 8014 | 6714 | 3805 | 3805 | 47.48% | 56.67% | 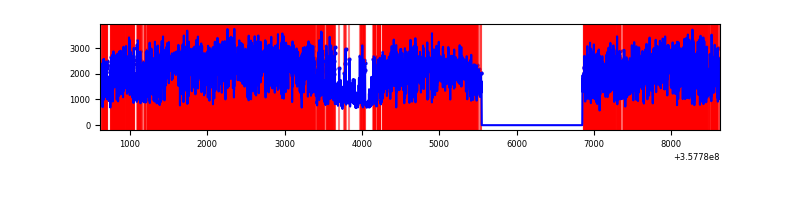 |
| C | 8014 | 6714 | 0 | 0 | 0.00% | 0.00% | 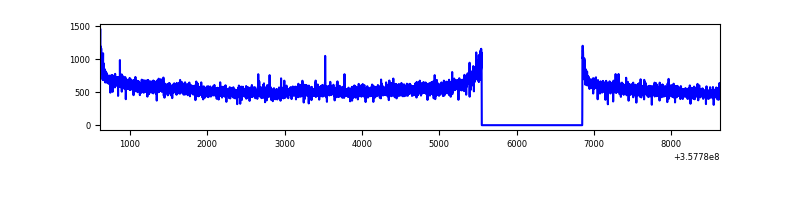 |
| D | 8014 | 6715 | 83 | 83 | 1.04% | 1.24% | 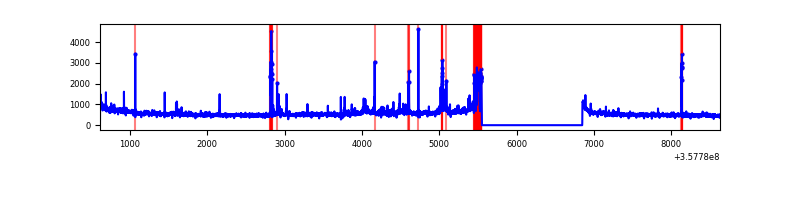 |
Top three noisy pixels from each quadrant. If the there are fewer than three noisy pixels in the level2.evt file, extra rows are filled as -1
| Pixel properties | Quadrant properties | ||||||
|---|---|---|---|---|---|---|---|
| Quadrant | DetID | PixID | Counts | Sigma | Mean | Median | Sigma |
| A | 14 | 239 | 890234 | 5000.6 | 896 | 883 | 177.8 |
| A | 8 | 192 | 22657 | 122.43 | 896 | 883 | 177.8 |
| A | 13 | 254 | 12598 | 65.87 | 896 | 883 | 177.8 |
| B | 6 | 36 | 9618803 | 77344.79 | 655 | 639 | 124.4 |
| B | 6 | 159 | 1415501 | 11377.66 | 655 | 639 | 124.4 |
| B | 12 | 111 | 14306 | 109.9 | 655 | 639 | 124.4 |
| C | 14 | 238 | 147282 | 714.78 | 884 | 893 | 204.8 |
| C | 3 | 233 | 67728 | 326.34 | 884 | 893 | 204.8 |
| C | 2 | 114 | 15894 | 73.25 | 884 | 893 | 204.8 |
| D | 5 | 222 | 365879 | 1709.63 | 875 | 856 | 213.5 |
| D | 8 | 195 | 285032 | 1330.97 | 875 | 856 | 213.5 |
| D | 2 | 250 | 33076 | 150.9 | 875 | 856 | 213.5 |
Histogram calculated using DETX and DETY for each event in the final _common_clean file
| Quadrant A | 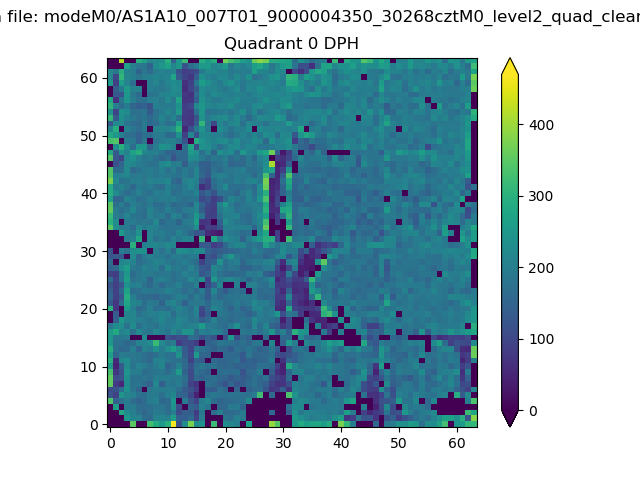 |
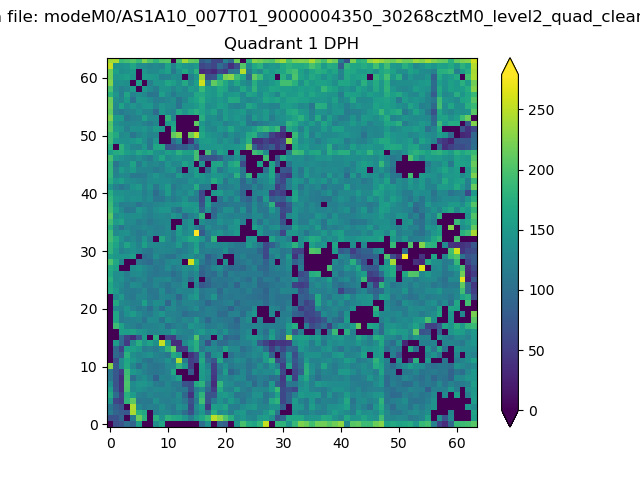 |
Quadrant B |
|---|---|---|---|
| Quadrant D | 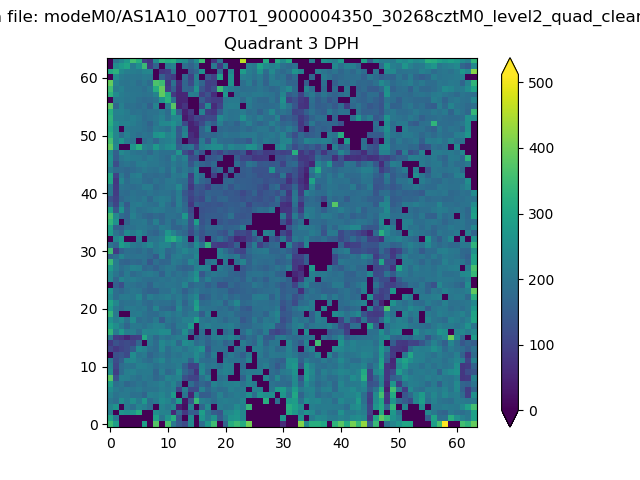 |
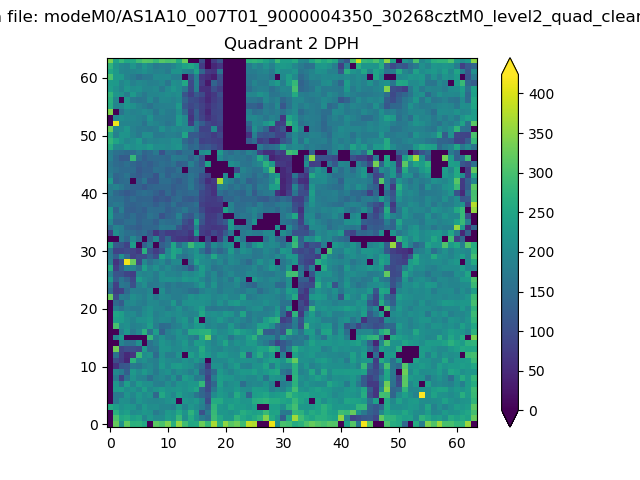 |
Quadrant C |
| Plot type | Count rate plots | Images |
|---|---|---|
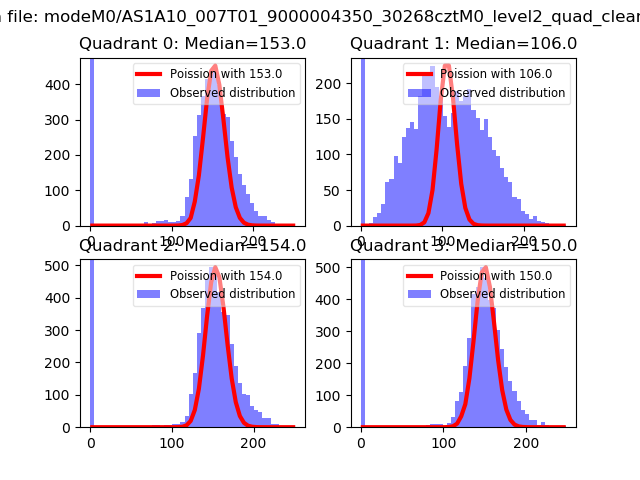
| Comparison with Poisson distribution Blue bars denote a histogram of data divided into 1 sec bins. Red curve is a Poisson curve with rate = median count rate of data. |
 |
 |
| Quadrant-wise count rates Data is divided into 100 sec bins |
 |
|
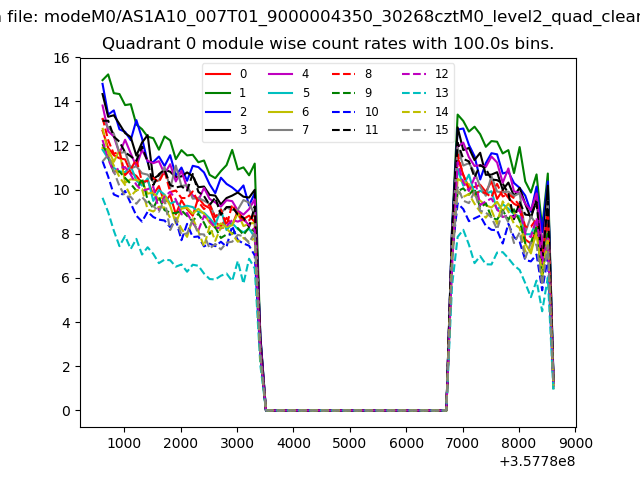
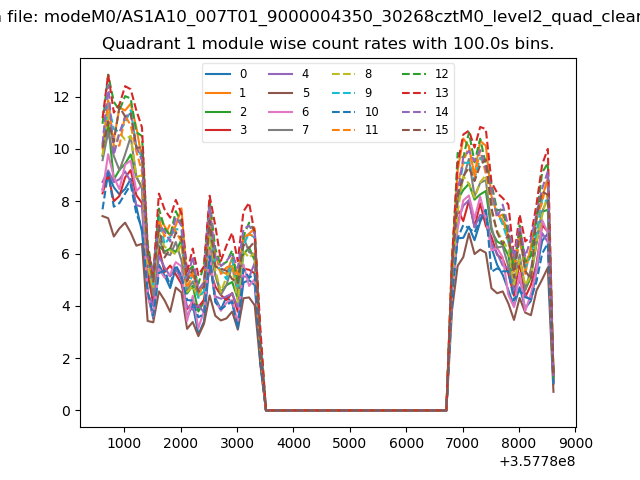
| Module-wise count rates for Quadrant A Data is divided into 100 sec bins |
 |
 |
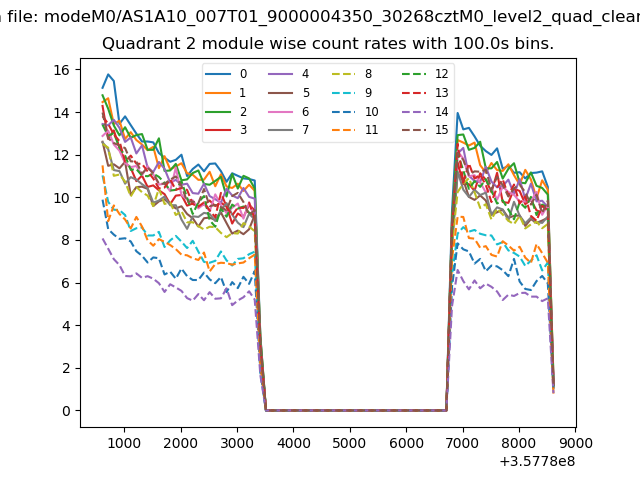
| Module-wise count rates for Quadrant B Data is divided into 100 sec bins |
 |
 |
| Module-wise count rates for Quadrant C Data is divided into 100 sec bins |
 |
 |
| Module-wise count rates for Quadrant D Data is divided into 100 sec bins |
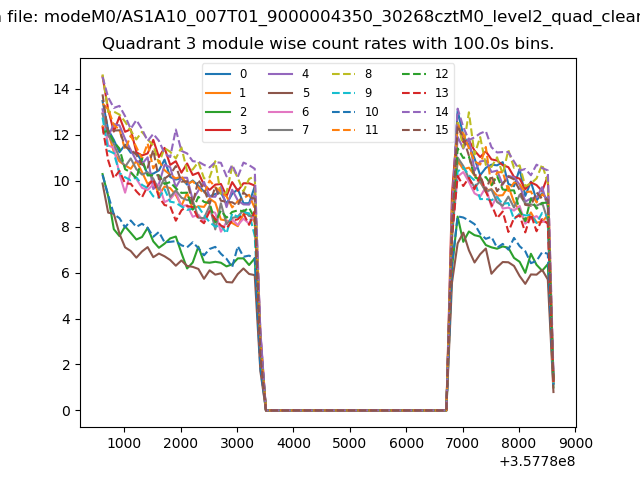 |
 |
| Parameter | Plot |
|---|---|
| CZT HV Monitor | 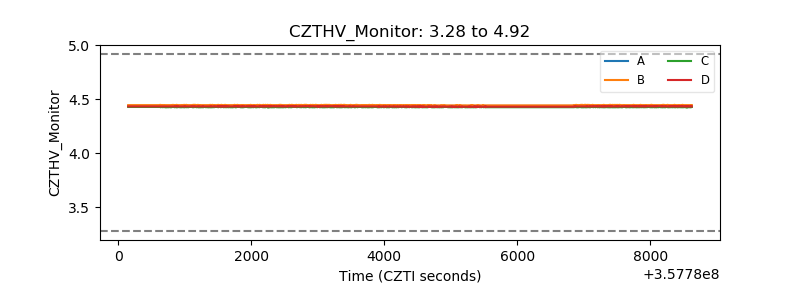 |
| D_VDD | 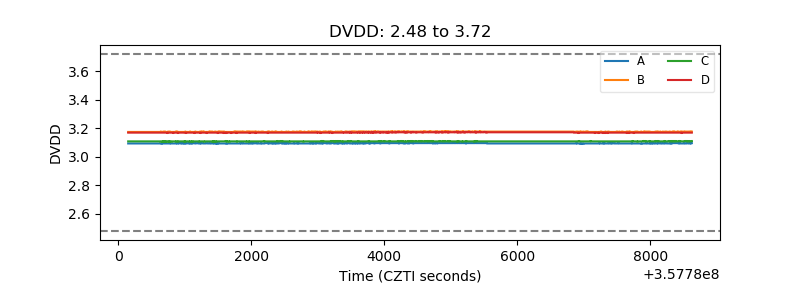 |
| Temperature 1 | 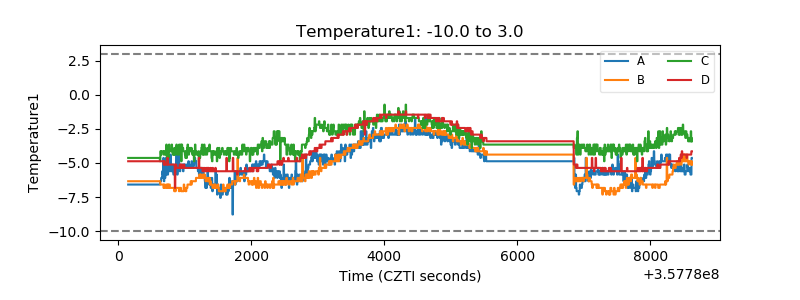 |
| Veto HV Monitor | 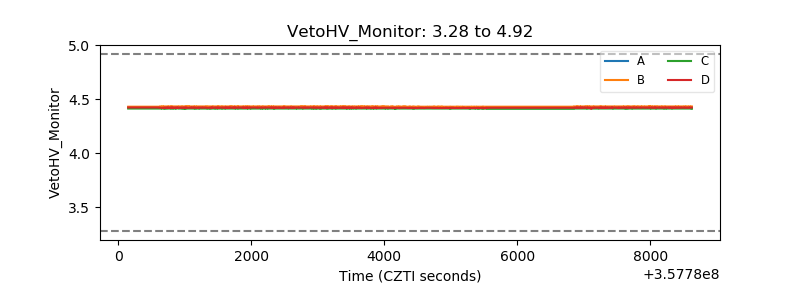 |
| Veto LLD | 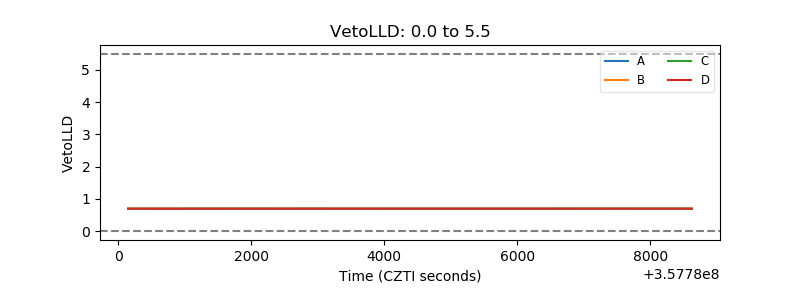 |
| Alpha Counter | 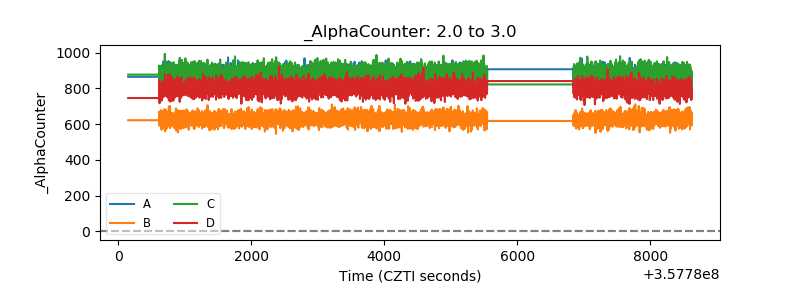 |
| _CPM_Rate | 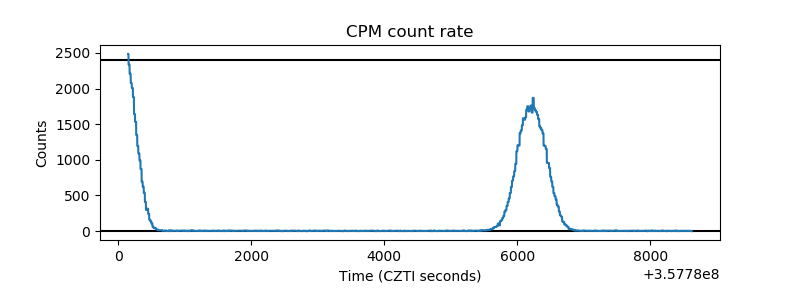 |
| CZT Counter | 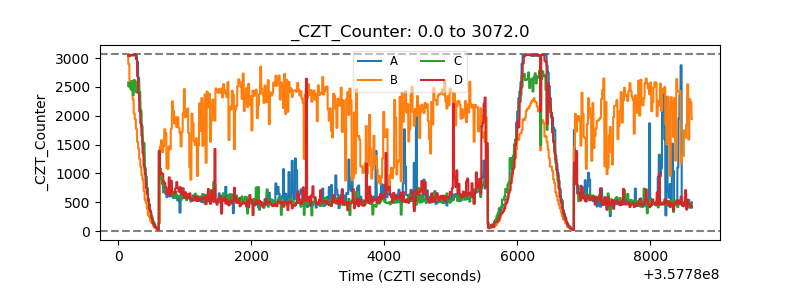 |
| +2.5 Volts monitor | 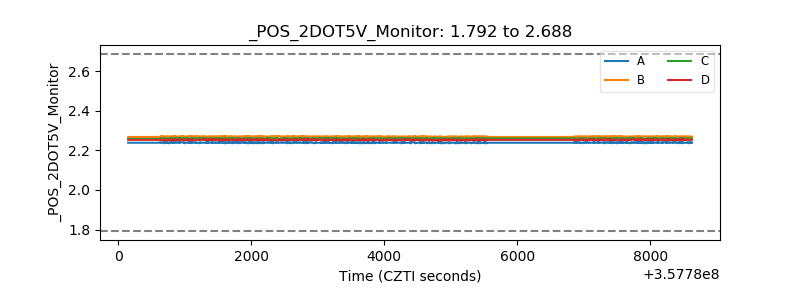 |
| +5 Volts monitor |  |
| _ROLL_ROT | 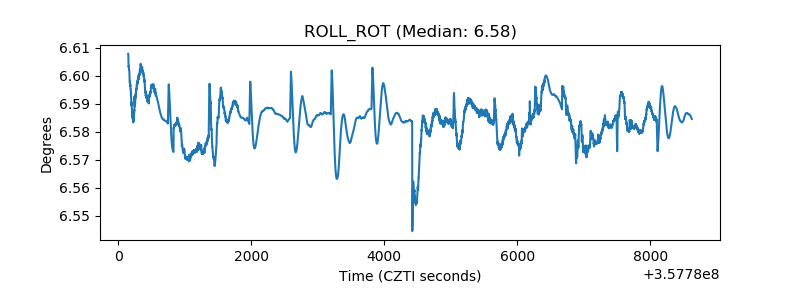 |
| _Roll_DEC | 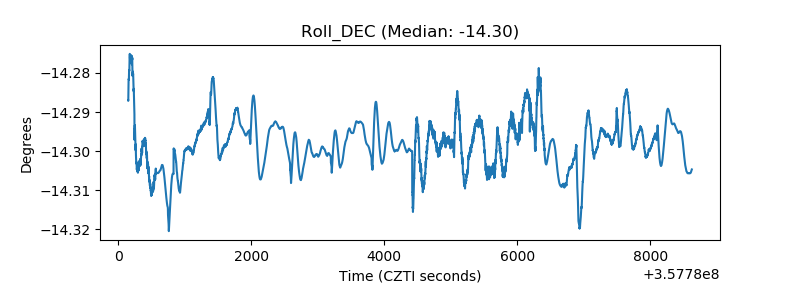 |
| _Roll_RA | 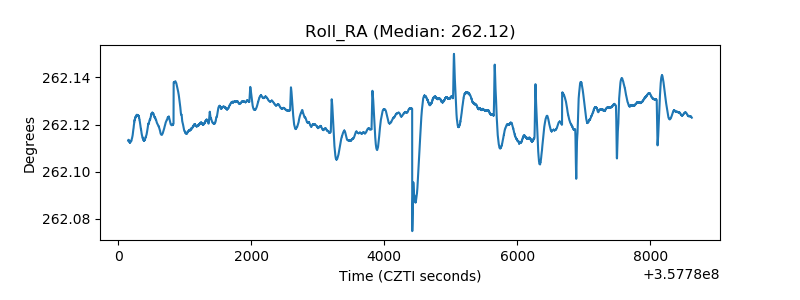 |
| Veto Counter | 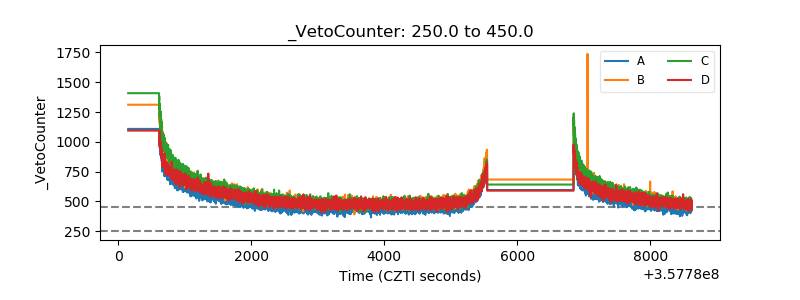 |