| Param | Original file | Final file |
|---|---|---|
| Filename | modeM0/AS1A10_007T01_9000004350_30269cztM0_level2.evt | modeM0/AS1A10_007T01_9000004350_30269cztM0_level2_quad_clean.evt |
| Size (bytes) | 842,713,920 | 99,745,920 |
| Size | 803.7 MB | 95.1 MB |
| Events in quadrant A | 5,308,293 | 667,964 |
| Events in quadrant B | 12,236,687 | 518,416 |
| Events in quadrant C | 3,718,872 | 676,746 |
| Events in quadrant D | 3,790,148 | 673,610 |
| Mode M9 | |||
|---|---|---|---|
| Quadrant | BADHDUFLAG | Total packets | Discarded packets |
| A | 0 | 13 | 0 |
| B | 0 | 14 | 0 |
| C | 0 | 14 | 0 |
| D | 0 | 14 | 0 |
| Mode SS | |||
|---|---|---|---|
| Quadrant | BADHDUFLAG | Total packets | Discarded packets |
| A | 0 | 140 | 0 |
| B | 0 | 140 | 0 |
| C | 0 | 140 | 0 |
| D | 0 | 140 | 0 |
| Mode M0 | |||
|---|---|---|---|
| Quadrant | BADHDUFLAG | Total packets | Discarded packets |
| A | 0 | 20176 | 1 |
| B | 0 | 41154 | 1 |
| C | 0 | 15103 | 1 |
| D | 0 | 15576 | 3 |
| Quadrant | Total seconds | Saturated seconds | Saturation percentage |
|---|---|---|---|
| A | 6927 | 599 | 8.647322% |
| B | 6927 | 3477 | 50.194890% |
| C | 6927 | 253 | 3.652375% |
| D | 6926 | 103 | 1.487150% |
Noise dominated data is calculated using 1-second bins in cleaned event files. If a bin has >2000 counts, and if more than 50% of those come from <1% of pixels, then it is considered to be noise-dominated and hence unusable.
| Quadrant | # 1 sec bins | Bins with >0 counts | Bins with >2000 counts | High rate bins dominated by noise | Noise dominated (total time) | Noise dominated (detector-on time) | Marked lightcurve |
|---|---|---|---|---|---|---|---|
| A | 8027 | 6929 | 389 | 389 | 4.85% | 5.61% | 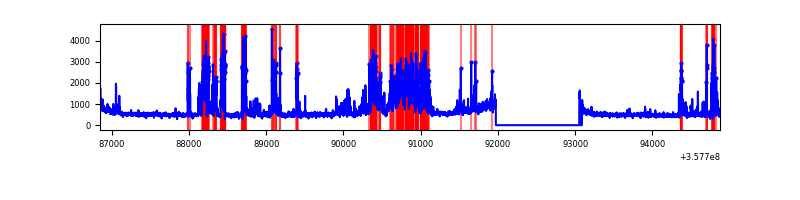 |
| B | 8027 | 6927 | 2552 | 2552 | 31.79% | 36.84% | 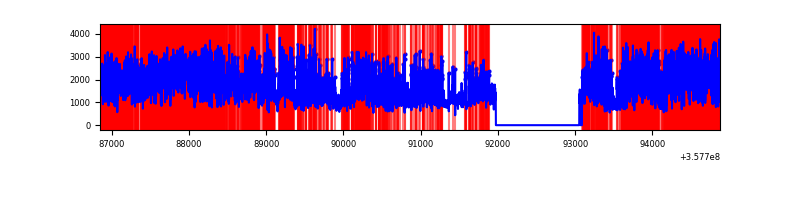 |
| C | 8027 | 6929 | 0 | 0 | 0.00% | 0.00% | 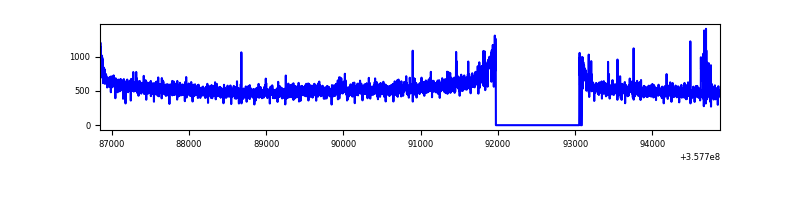 |
| D | 8026 | 6928 | 21 | 21 | 0.26% | 0.30% | 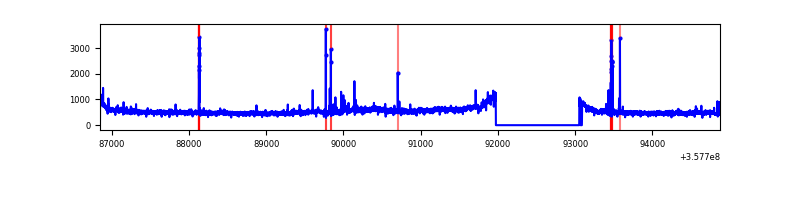 |
Top three noisy pixels from each quadrant. If the there are fewer than three noisy pixels in the level2.evt file, extra rows are filled as -1
| Pixel properties | Quadrant properties | ||||||
|---|---|---|---|---|---|---|---|
| Quadrant | DetID | PixID | Counts | Sigma | Mean | Median | Sigma |
| A | 14 | 239 | 1878465 | 10657.64 | 883 | 867 | 176.2 |
| A | 8 | 192 | 21296 | 115.96 | 883 | 867 | 176.2 |
| A | 13 | 254 | 12406 | 65.5 | 883 | 867 | 176.2 |
| B | 6 | 36 | 7613998 | 52291.02 | 757 | 738 | 145.6 |
| B | 6 | 159 | 1613620 | 11077.94 | 757 | 738 | 145.6 |
| B | 12 | 111 | 17269 | 113.54 | 757 | 738 | 145.6 |
| C | 14 | 238 | 166098 | 807.54 | 879 | 887 | 204.6 |
| C | 3 | 233 | 75198 | 363.23 | 879 | 887 | 204.6 |
| C | 14 | 254 | 39473 | 188.61 | 879 | 887 | 204.6 |
| D | 8 | 195 | 285909 | 1326.55 | 893 | 876 | 214.9 |
| D | 2 | 250 | 62268 | 285.72 | 893 | 876 | 214.9 |
| D | 2 | 234 | 24760 | 111.16 | 893 | 876 | 214.9 |
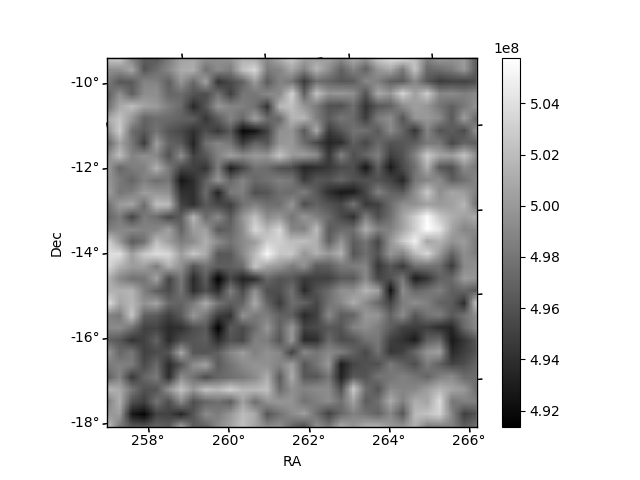
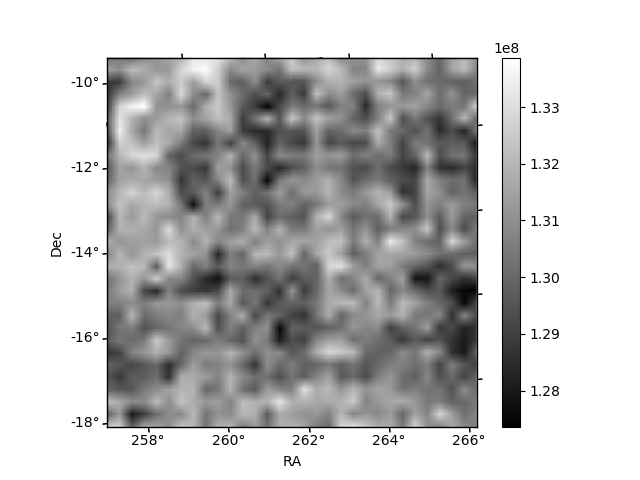
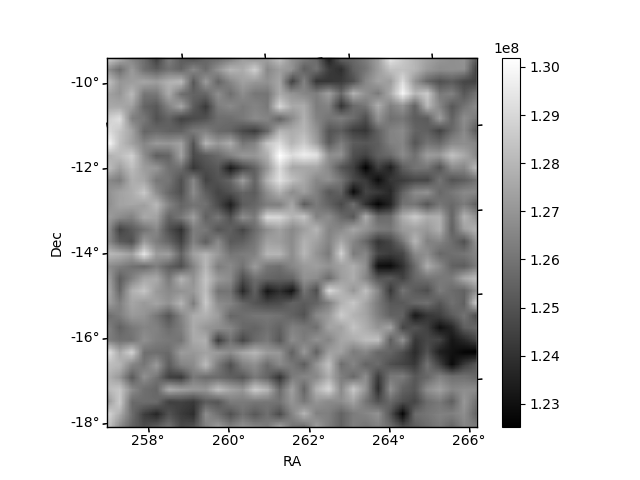
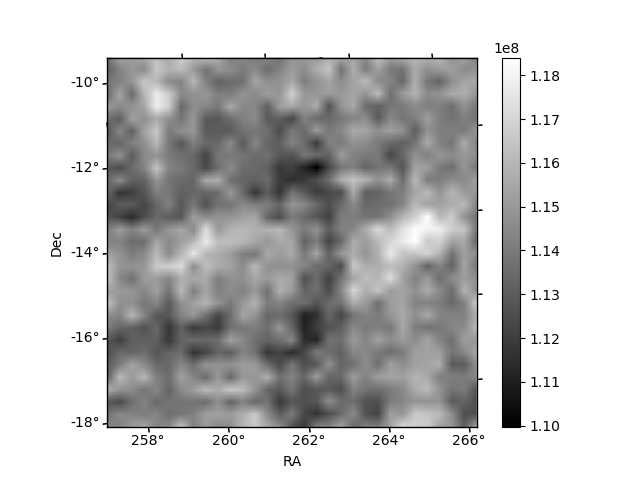
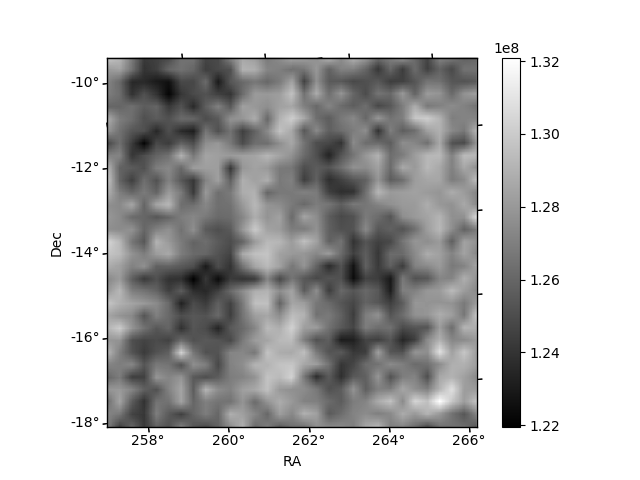
Histogram calculated using DETX and DETY for each event in the final _common_clean file
| Quadrant A | 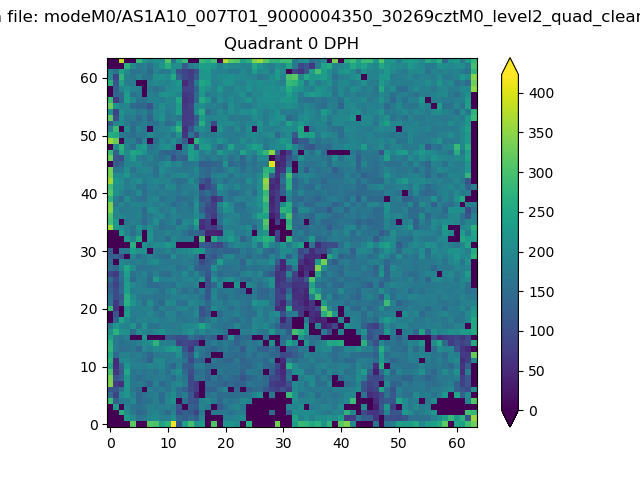 |
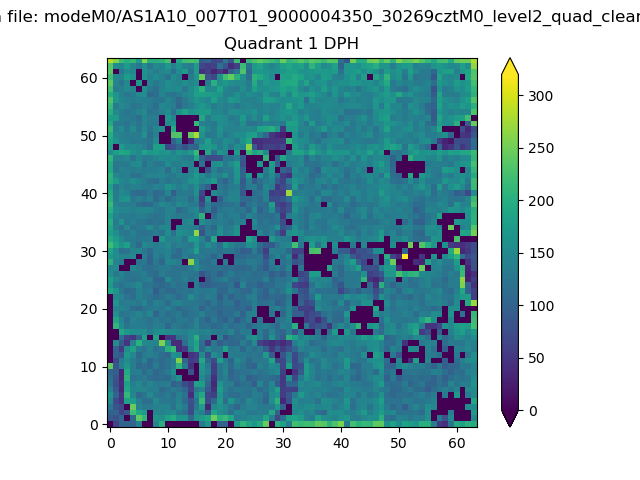 |
Quadrant B |
|---|---|---|---|
| Quadrant D | 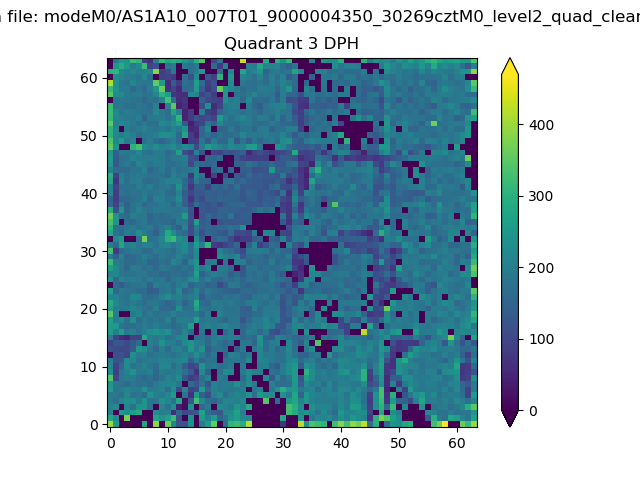 |
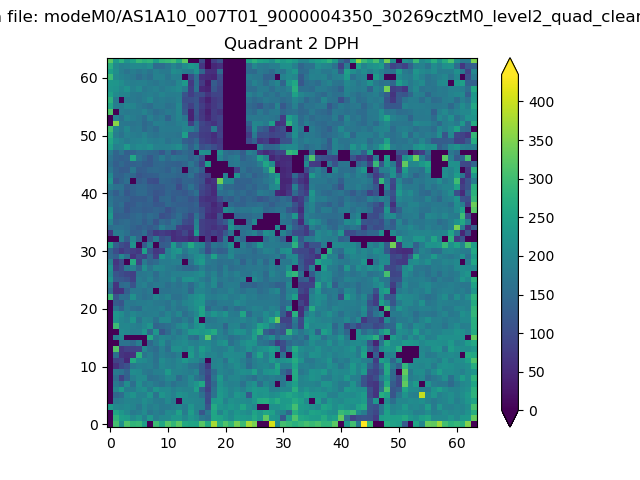 |
Quadrant C |
| Plot type | Count rate plots | Images |
|---|---|---|
| Comparison with Poisson distribution Blue bars denote a histogram of data divided into 1 sec bins. Red curve is a Poisson curve with rate = median count rate of data. |
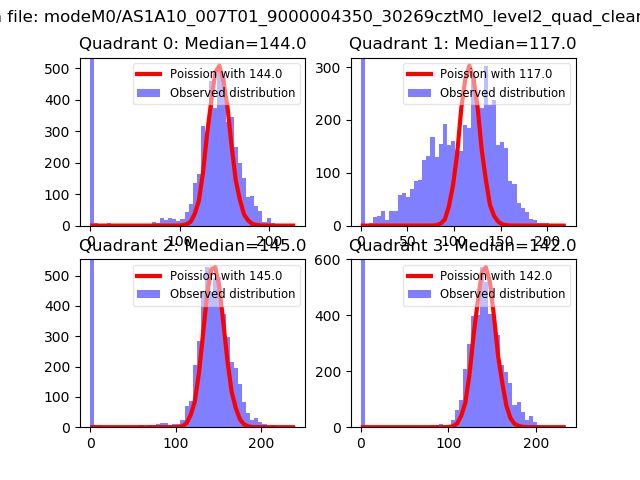 |
 |
| Quadrant-wise count rates Data is divided into 100 sec bins |
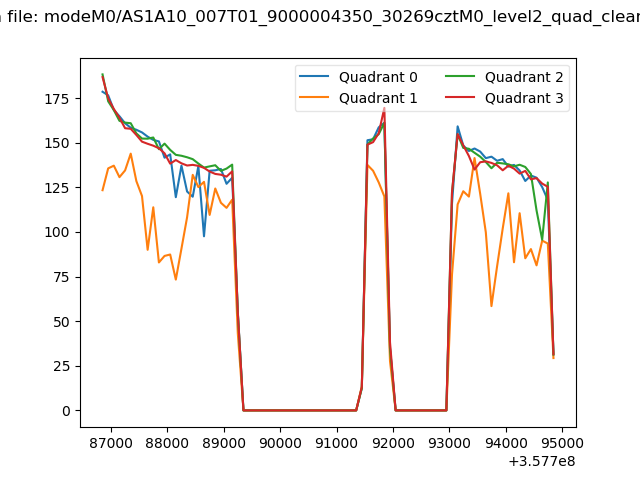 |
|
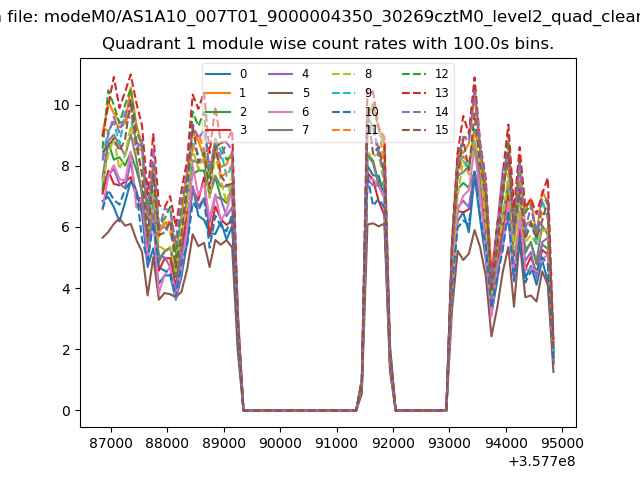
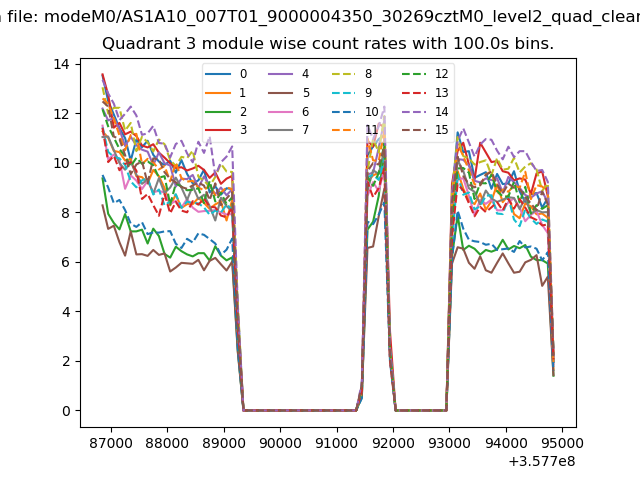
| Module-wise count rates for Quadrant A Data is divided into 100 sec bins |
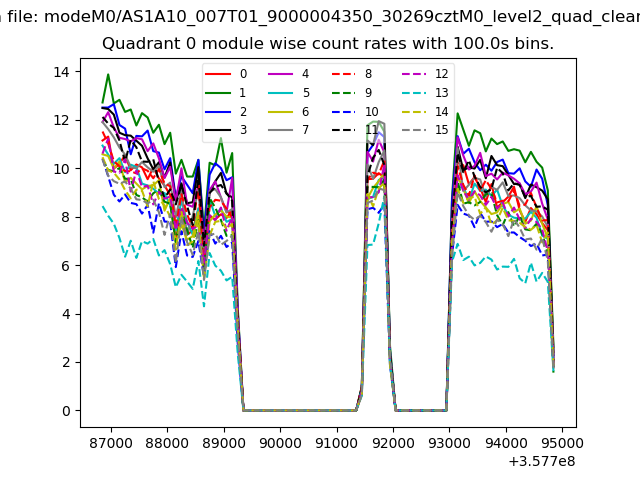 |
 |
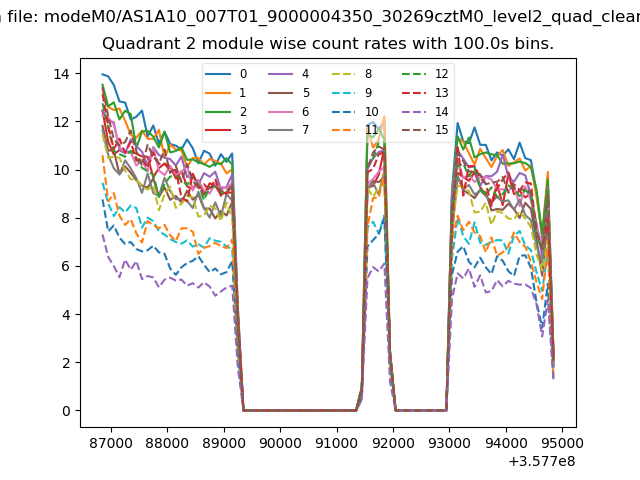
| Module-wise count rates for Quadrant B Data is divided into 100 sec bins |
 |
 |
| Module-wise count rates for Quadrant C Data is divided into 100 sec bins |
 |
 |
| Module-wise count rates for Quadrant D Data is divided into 100 sec bins |
 |
 |
| Parameter | Plot |
|---|---|
| CZT HV Monitor | 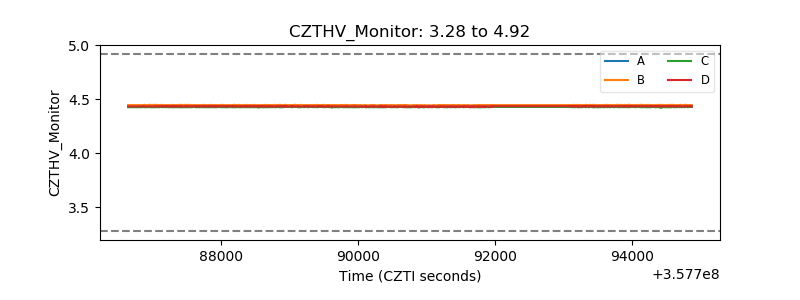 |
| D_VDD | 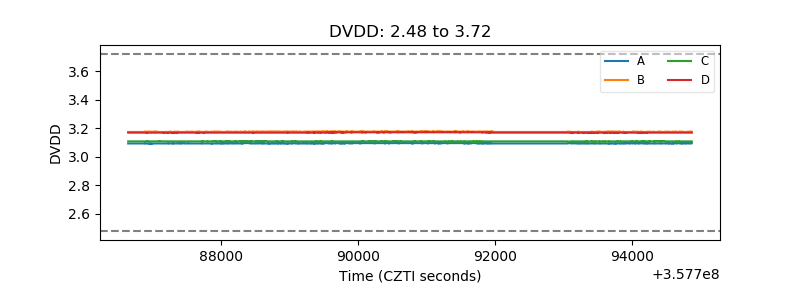 |
| Temperature 1 | 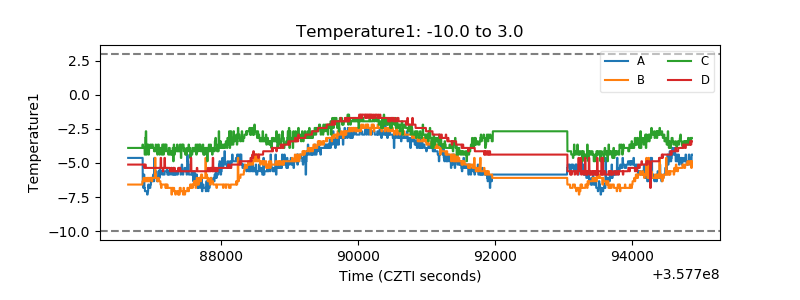 |
| Veto HV Monitor | 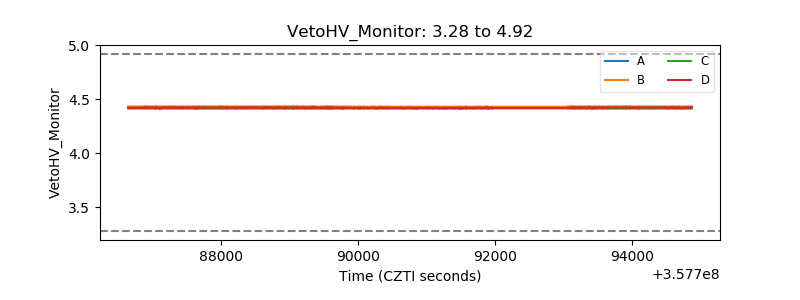 |
| Veto LLD | 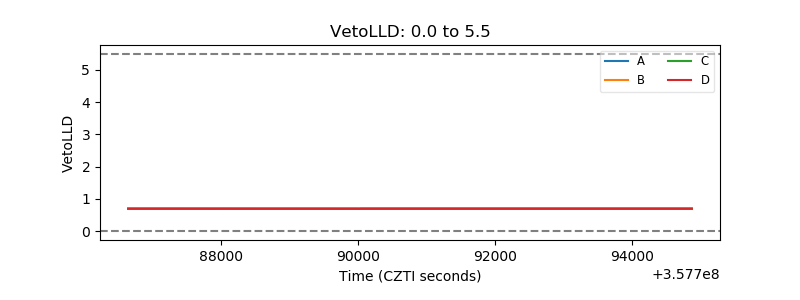 |
| Alpha Counter | 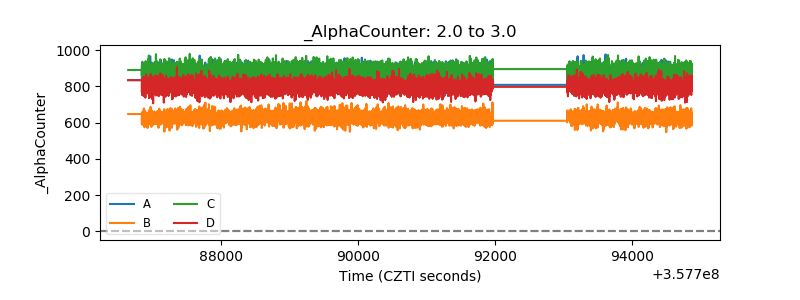 |
| _CPM_Rate | 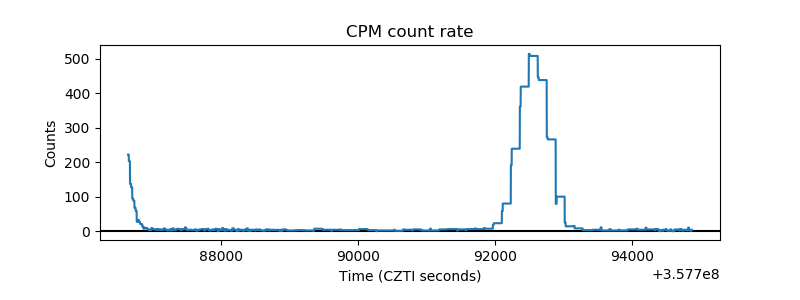 |
| CZT Counter | 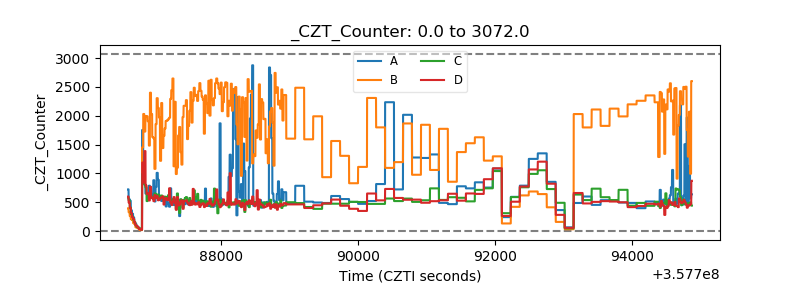 |
| +2.5 Volts monitor | 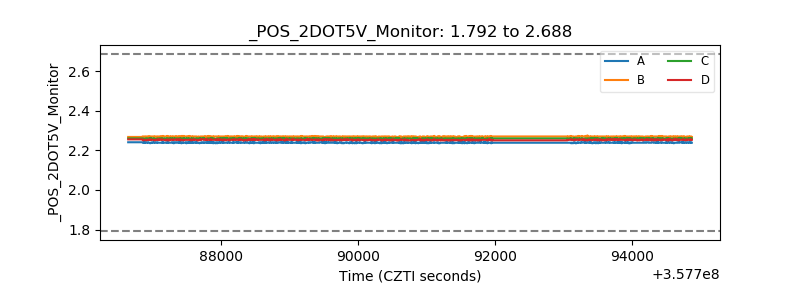 |
| +5 Volts monitor | 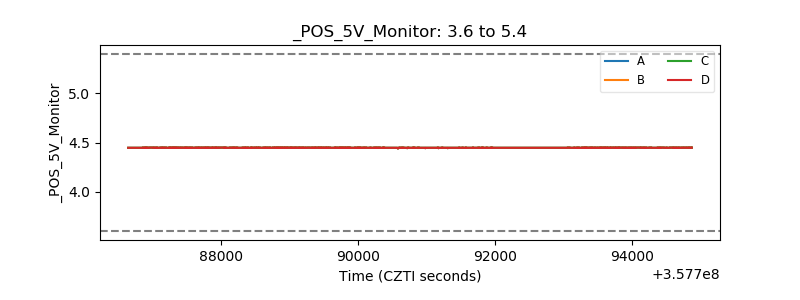 |
| _ROLL_ROT | 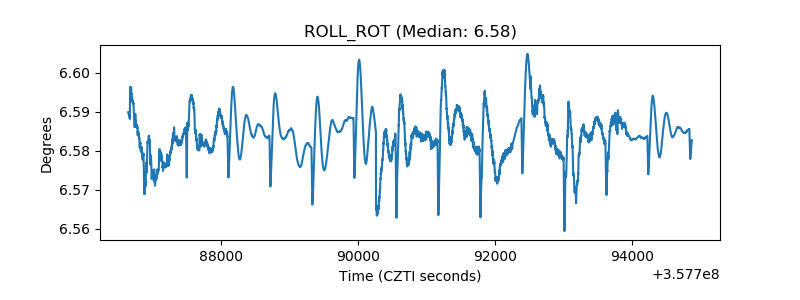 |
| _Roll_DEC | 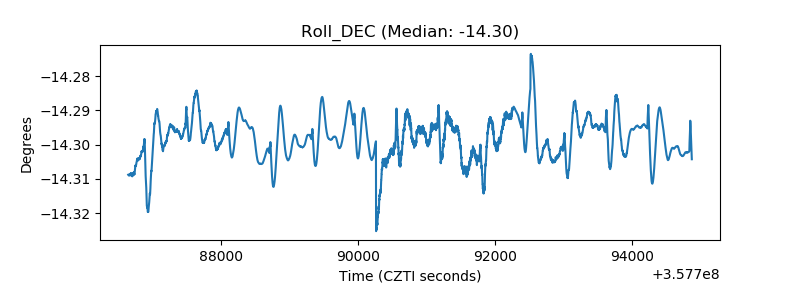 |
| _Roll_RA | 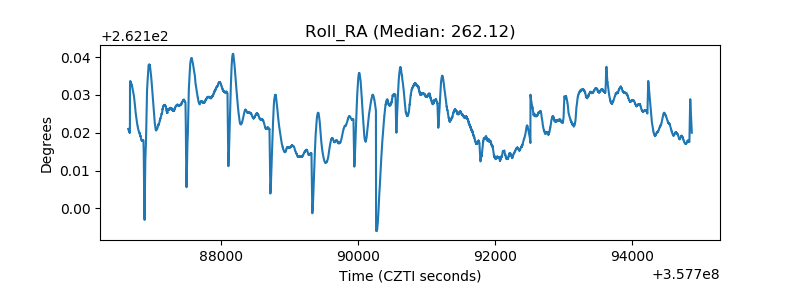 |
| Veto Counter | 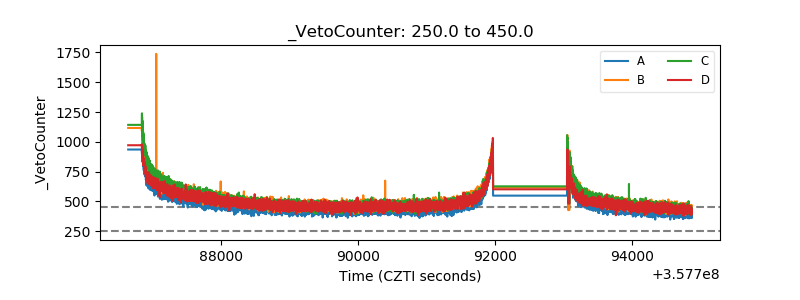 |