| Param | Original file | Final file |
|---|---|---|
| Filename | modeM0/AS1A10_007T01_9000004350_30270cztM0_level2.evt | modeM0/AS1A10_007T01_9000004350_30270cztM0_level2_quad_clean.evt |
| Size (bytes) | 530,383,680 | 51,275,520 |
| Size | 505.8 MB | 48.9 MB |
| Events in quadrant A | 2,907,746 | 329,294 |
| Events in quadrant B | 7,478,147 | 250,053 |
| Events in quadrant C | 2,377,262 | 322,946 |
| Events in quadrant D | 2,982,641 | 320,973 |
| Mode M9 | |||
|---|---|---|---|
| Quadrant | BADHDUFLAG | Total packets | Discarded packets |
| A | 1 | 140174633409320 | 46 |
| B | 1 | -1 | -1 |
| C | 1 | -1 | -1 |
| D | 1 | -1 | -1 |
| Mode SS | |||
|---|---|---|---|
| Quadrant | BADHDUFLAG | Total packets | Discarded packets |
| A | 0 | 105 | 9 |
| B | 0 | 106 | 12 |
| C | 0 | 103 | 9 |
| D | 0 | 106 | 14 |
| Mode M0 | |||
|---|---|---|---|
| Quadrant | BADHDUFLAG | Total packets | Discarded packets |
| A | 0 | 13195 | 1668 |
| B | 0 | 28519 | 3072 |
| C | 0 | 11710 | 1840 |
| D | 0 | 13170 | 1291 |
| Quadrant | Total seconds | Saturated seconds | Saturation percentage |
|---|---|---|---|
| A | 4701 | 115 | 2.446288% |
| B | 4602 | 1831 | 39.787049% |
| C | 4686 | 131 | 2.795561% |
| D | 4689 | 119 | 2.537855% |
Noise dominated data is calculated using 1-second bins in cleaned event files. If a bin has >2000 counts, and if more than 50% of those come from <1% of pixels, then it is considered to be noise-dominated and hence unusable.
| Quadrant | # 1 sec bins | Bins with >0 counts | Bins with >2000 counts | High rate bins dominated by noise | Noise dominated (total time) | Noise dominated (detector-on time) | Marked lightcurve |
|---|---|---|---|---|---|---|---|
| A | 6841 | 4781 | 87 | 87 | 1.27% | 1.82% | 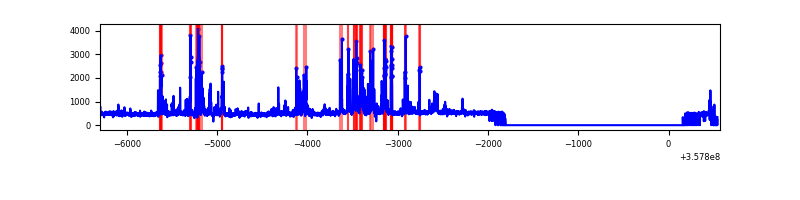 |
| B | 6833 | 4709 | 1340 | 1340 | 19.61% | 28.46% | 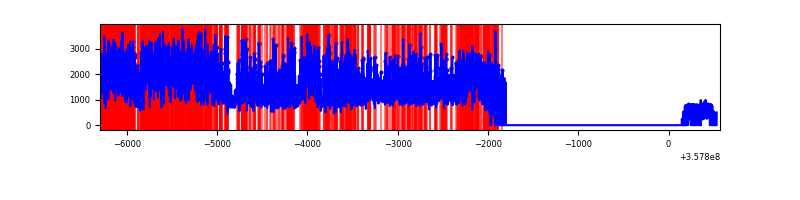 |
| C | 6834 | 4785 | 1 | 1 | 0.01% | 0.02% | 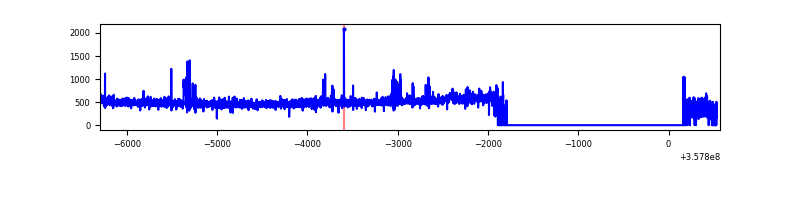 |
| D | 6869 | 4803 | 111 | 111 | 1.62% | 2.31% | 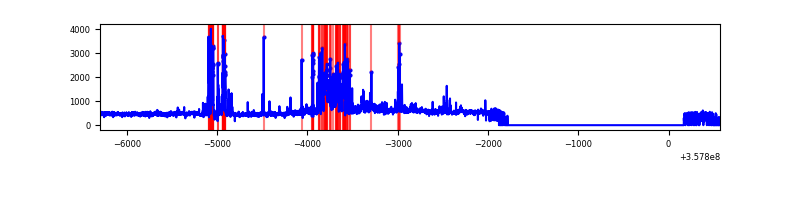 |
Top three noisy pixels from each quadrant. If the there are fewer than three noisy pixels in the level2.evt file, extra rows are filled as -1
| Pixel properties | Quadrant properties | ||||||
|---|---|---|---|---|---|---|---|
| Quadrant | DetID | PixID | Counts | Sigma | Mean | Median | Sigma |
| A | 14 | 239 | 708935 | 6159.95 | 569 | 559 | 115.0 |
| A | 13 | 254 | 8596 | 69.89 | 569 | 559 | 115.0 |
| A | 3 | 137 | 5689 | 44.61 | 569 | 559 | 115.0 |
| B | 6 | 36 | 4399295 | 46587.11 | 484 | 472 | 94.4 |
| B | 6 | 159 | 1132767 | 11991.92 | 484 | 472 | 94.4 |
| B | 0 | 229 | 34724 | 362.76 | 484 | 472 | 94.4 |
| C | 14 | 238 | 120596 | 926.14 | 546 | 551 | 129.6 |
| C | 3 | 233 | 75262 | 576.39 | 546 | 551 | 129.6 |
| C | 14 | 254 | 43612 | 332.21 | 546 | 551 | 129.6 |
| D | 12 | 33 | 419610 | 3004.19 | 552 | 539 | 139.5 |
| D | 8 | 195 | 221684 | 1585.32 | 552 | 539 | 139.5 |
| D | 13 | 249 | 185508 | 1325.99 | 552 | 539 | 139.5 |
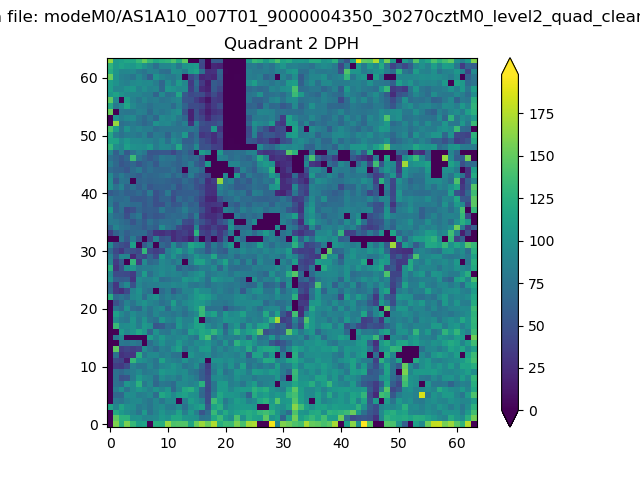
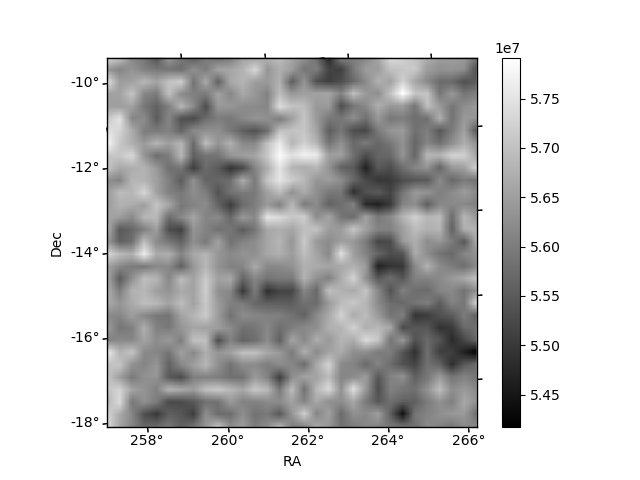
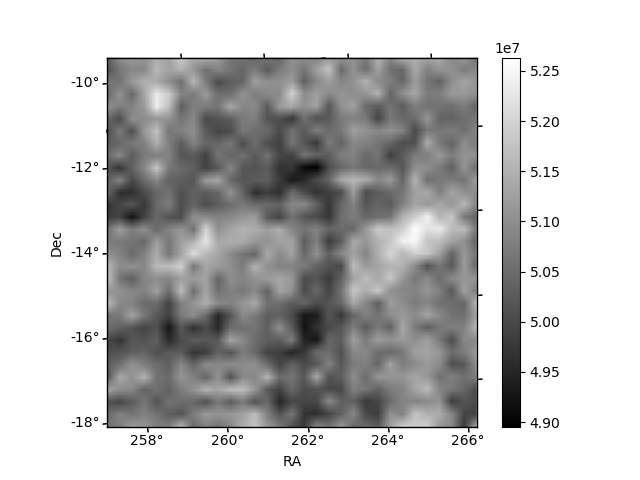
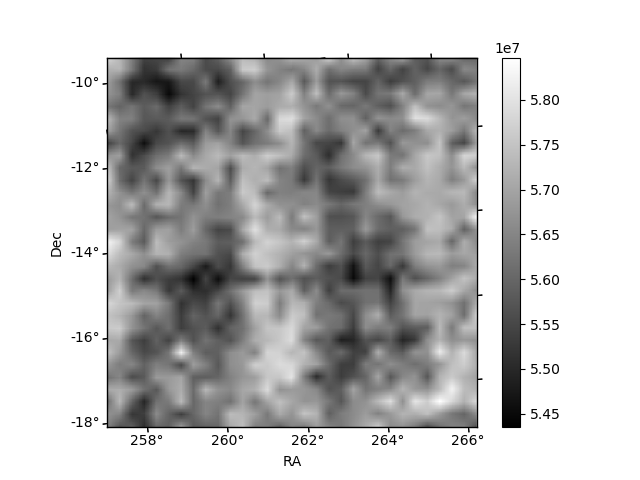
Histogram calculated using DETX and DETY for each event in the final _common_clean file
| Quadrant A | 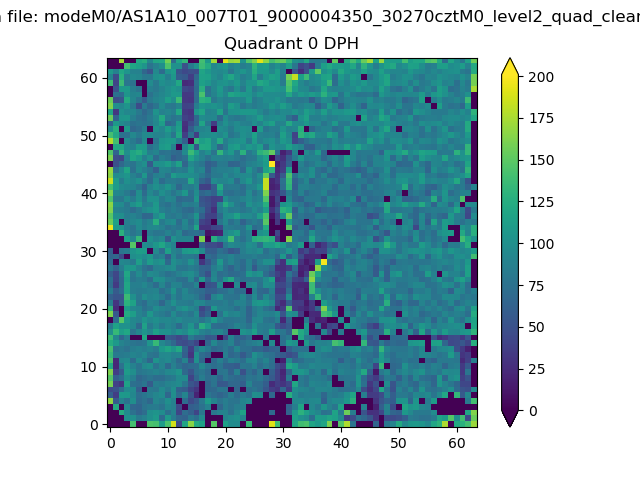 |
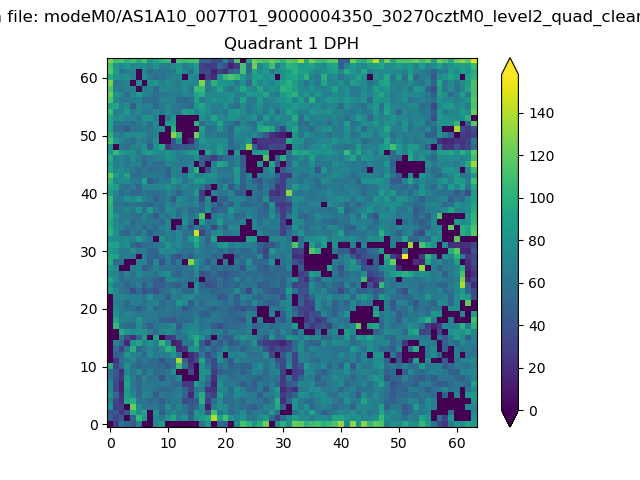 |
Quadrant B |
|---|---|---|---|
| Quadrant D | 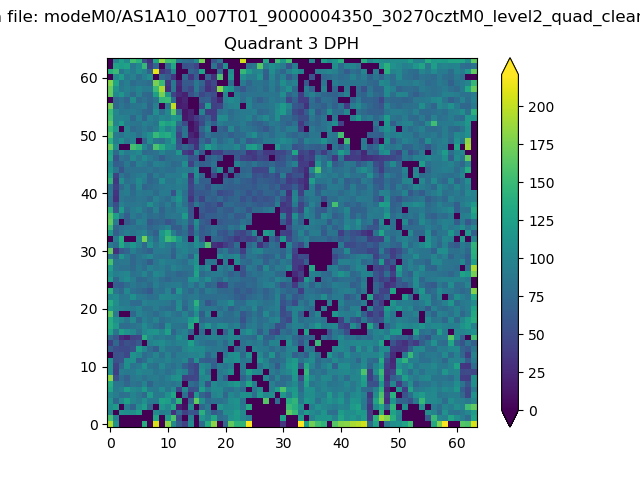 |
 |
Quadrant C |
| Plot type | Count rate plots | Images |
|---|---|---|
| Comparison with Poisson distribution Blue bars denote a histogram of data divided into 1 sec bins. Red curve is a Poisson curve with rate = median count rate of data. |
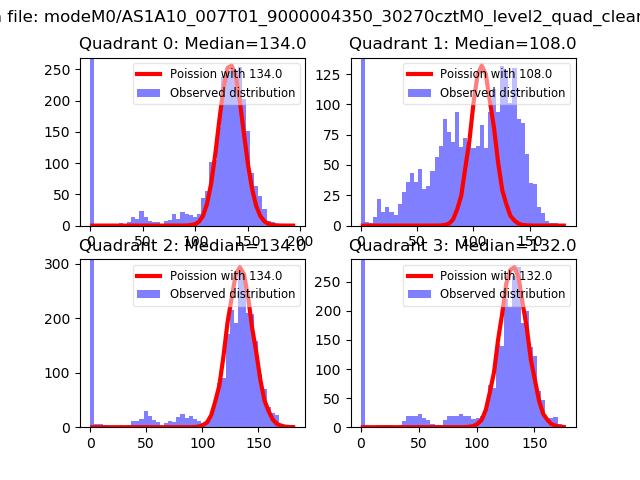 |
 |
| Quadrant-wise count rates Data is divided into 100 sec bins |
 |
|
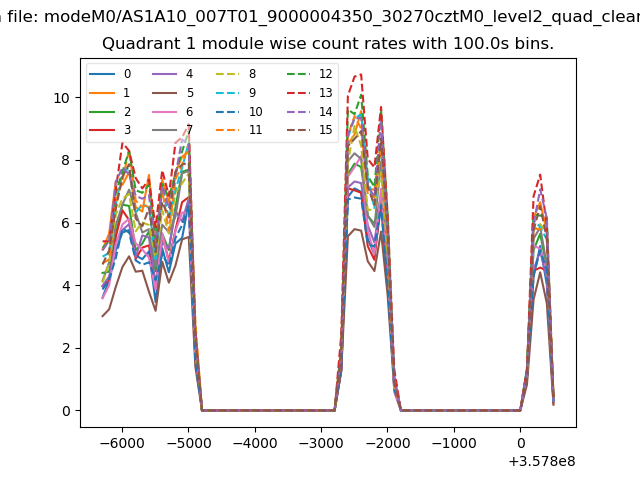
| Module-wise count rates for Quadrant A Data is divided into 100 sec bins |
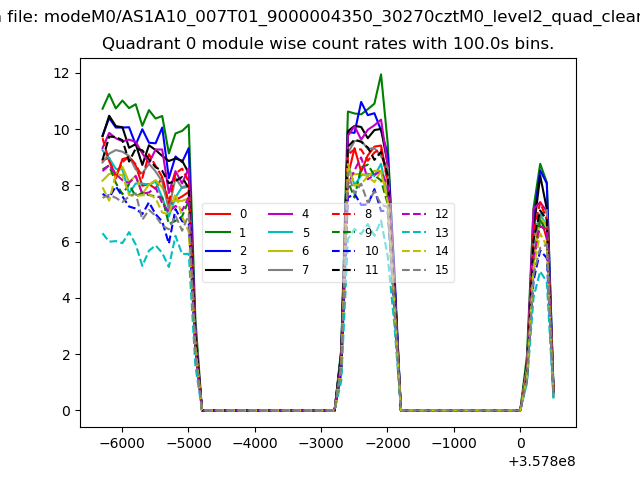 |
 |
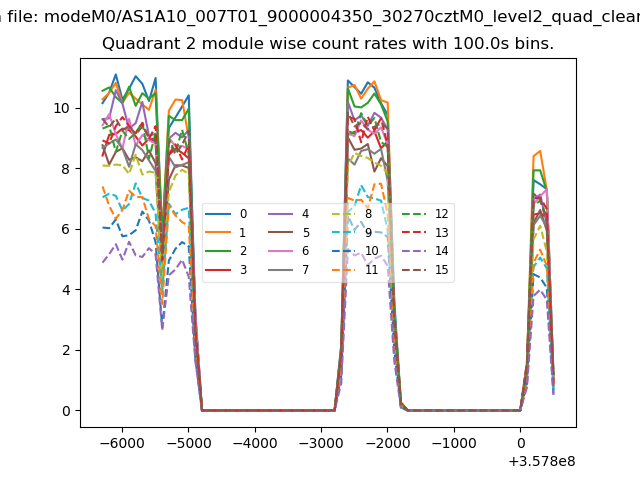
| Module-wise count rates for Quadrant B Data is divided into 100 sec bins |
 |
 |
| Module-wise count rates for Quadrant C Data is divided into 100 sec bins |
 |
 |
| Module-wise count rates for Quadrant D Data is divided into 100 sec bins |
 |
 |
| Parameter | Plot |
|---|---|
| CZT HV Monitor | 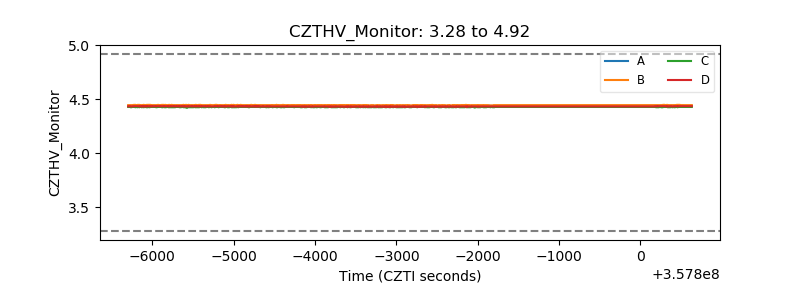 |
| D_VDD | 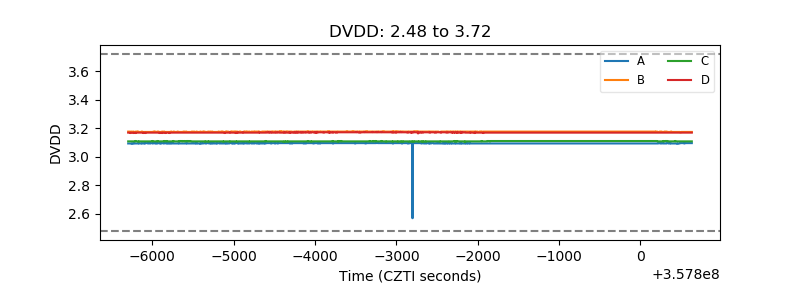 |
| Temperature 1 | 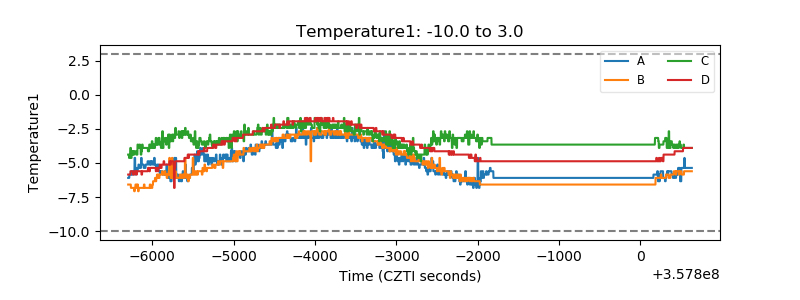 |
| Veto HV Monitor | 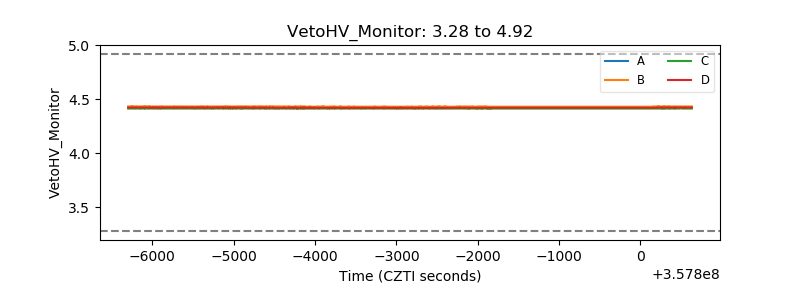 |
| Veto LLD | 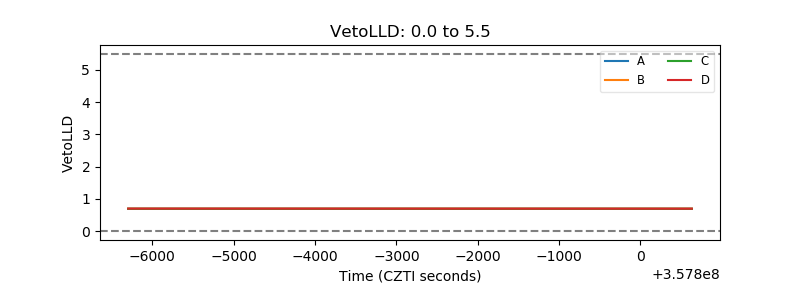 |
| Alpha Counter |  |
| _CPM_Rate | 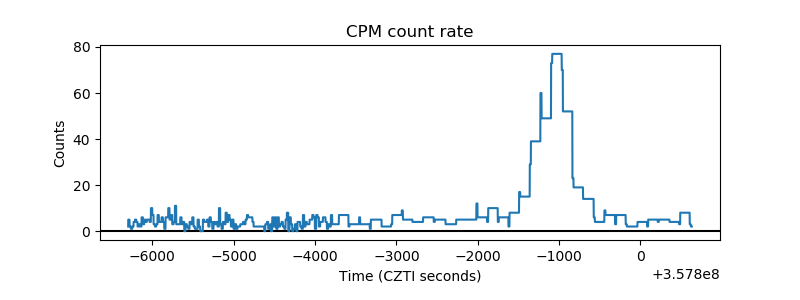 |
| CZT Counter | 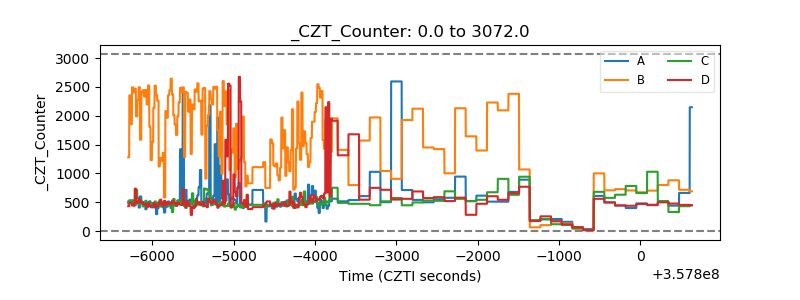 |
| +2.5 Volts monitor | 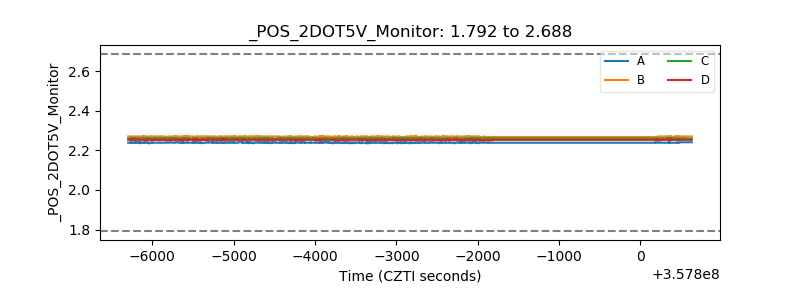 |
| +5 Volts monitor |  |
| _ROLL_ROT | 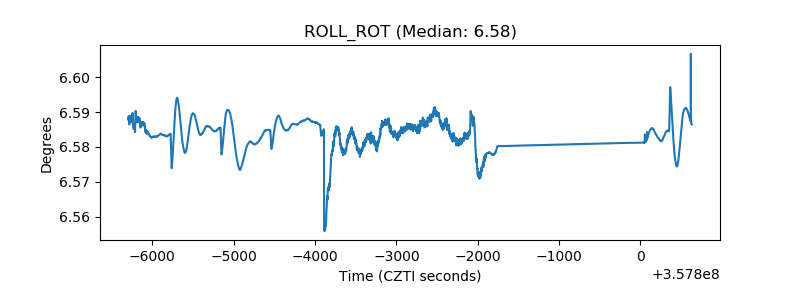 |
| _Roll_DEC |  |
| _Roll_RA | 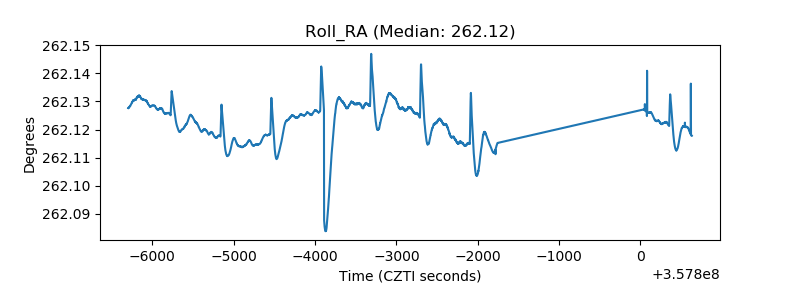 |
| Veto Counter | 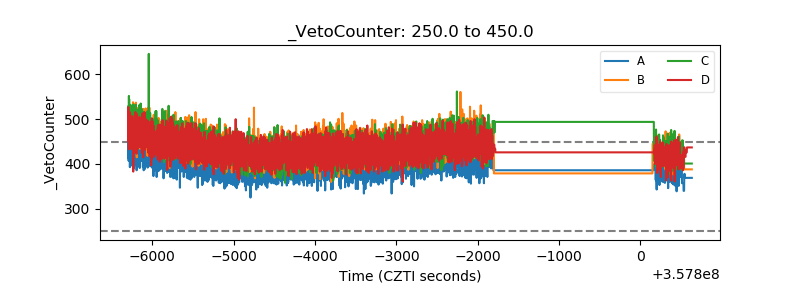 |