| Param | Original file | Final file |
|---|---|---|
| Filename | modeM0/AS1A10_007T01_9000004350_30271cztM0_level2.evt | modeM0/AS1A10_007T01_9000004350_30271cztM0_level2_quad_clean.evt |
| Size (bytes) | 596,053,440 | 98,354,880 |
| Size | 568.4 MB | 93.8 MB |
| Events in quadrant A | 4,094,348 | 613,507 |
| Events in quadrant B | 5,676,273 | 626,875 |
| Events in quadrant C | 3,971,230 | 616,137 |
| Events in quadrant D | 3,808,398 | 606,851 |
| Mode M9 | |||
|---|---|---|---|
| Quadrant | BADHDUFLAG | Total packets | Discarded packets |
| A | 0 | 3 | 0 |
| B | 0 | 3 | 0 |
| C | 0 | 3 | 0 |
| D | 0 | 3 | 0 |
| Mode SS | |||
|---|---|---|---|
| Quadrant | BADHDUFLAG | Total packets | Discarded packets |
| A | 0 | 152 | 0 |
| B | 0 | 152 | 0 |
| C | 0 | 152 | 0 |
| D | 0 | 152 | 0 |
| Mode M0 | |||
|---|---|---|---|
| Quadrant | BADHDUFLAG | Total packets | Discarded packets |
| A | 0 | 16749 | 1 |
| B | 0 | 22412 | 3 |
| C | 0 | 16252 | 1 |
| D | 0 | 15724 | 1 |
| Quadrant | Total seconds | Saturated seconds | Saturation percentage |
|---|---|---|---|
| A | 7407 | 294 | 3.969218% |
| B | 7406 | 257 | 3.470159% |
| C | 7406 | 269 | 3.632190% |
| D | 7407 | 186 | 2.511138% |
Noise dominated data is calculated using 1-second bins in cleaned event files. If a bin has >2000 counts, and if more than 50% of those come from <1% of pixels, then it is considered to be noise-dominated and hence unusable.
| Quadrant | # 1 sec bins | Bins with >0 counts | Bins with >2000 counts | High rate bins dominated by noise | Noise dominated (total time) | Noise dominated (detector-on time) | Marked lightcurve |
|---|---|---|---|---|---|---|---|
| A | 7627 | 7410 | 77 | 77 | 1.01% | 1.04% | 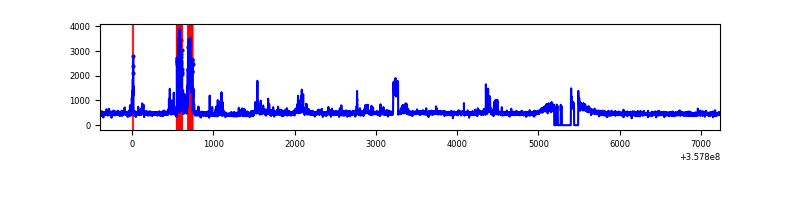 |
| B | 7626 | 7407 | 1 | 1 | 0.01% | 0.01% | 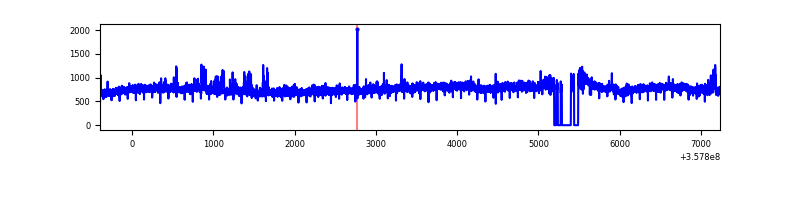 |
| C | 7626 | 7408 | 2 | 2 | 0.03% | 0.03% | 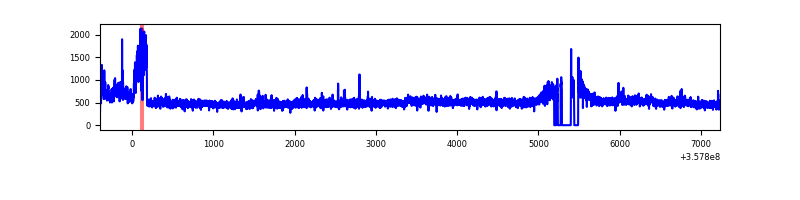 |
| D | 7627 | 7409 | 24 | 24 | 0.31% | 0.32% | 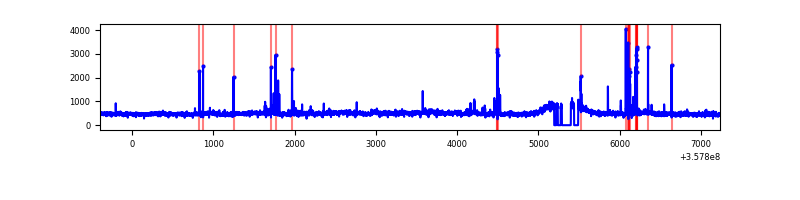 |
Top three noisy pixels from each quadrant. If the there are fewer than three noisy pixels in the level2.evt file, extra rows are filled as -1
| Pixel properties | Quadrant properties | ||||||
|---|---|---|---|---|---|---|---|
| Quadrant | DetID | PixID | Counts | Sigma | Mean | Median | Sigma |
| A | 14 | 239 | 580966 | 3136.15 | 907 | 887 | 185.0 |
| A | 13 | 254 | 13394 | 67.62 | 907 | 887 | 185.0 |
| A | 8 | 192 | 9717 | 47.74 | 907 | 887 | 185.0 |
| B | 6 | 159 | 2056632 | 11651.51 | 898 | 873 | 176.4 |
| B | 0 | 190 | 41771 | 231.8 | 898 | 873 | 176.4 |
| B | 0 | 229 | 38905 | 215.56 | 898 | 873 | 176.4 |
| C | 3 | 233 | 369205 | 1758.26 | 881 | 884 | 209.5 |
| C | 14 | 238 | 144369 | 684.95 | 881 | 884 | 209.5 |
| C | 2 | 114 | 16761 | 75.79 | 881 | 884 | 209.5 |
| D | 8 | 195 | 260767 | 1111.47 | 890 | 872 | 233.8 |
| D | 2 | 250 | 123552 | 524.66 | 890 | 872 | 233.8 |
| D | 2 | 234 | 27910 | 115.63 | 890 | 872 | 233.8 |
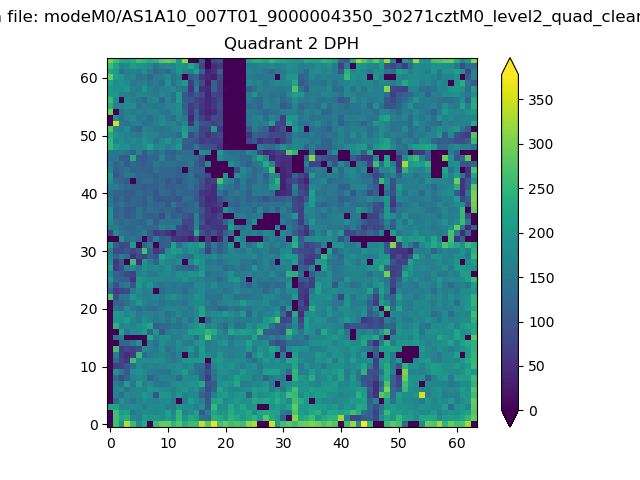
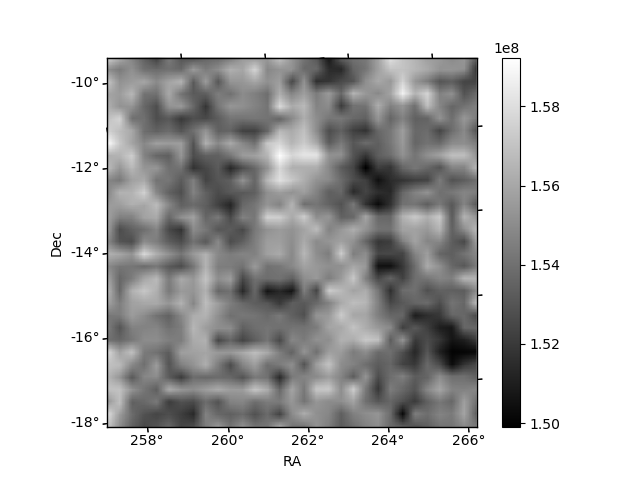
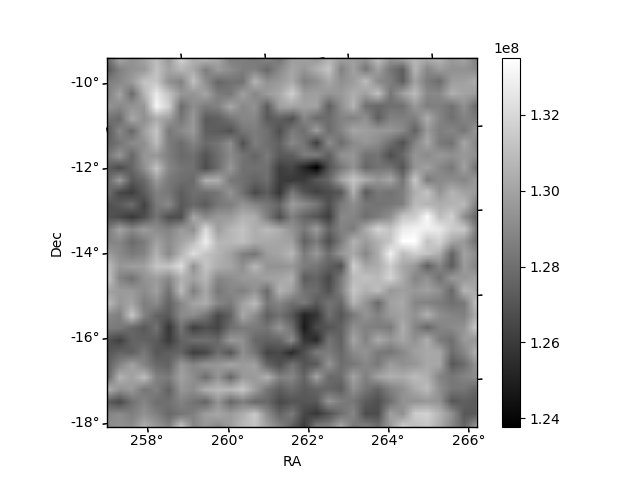
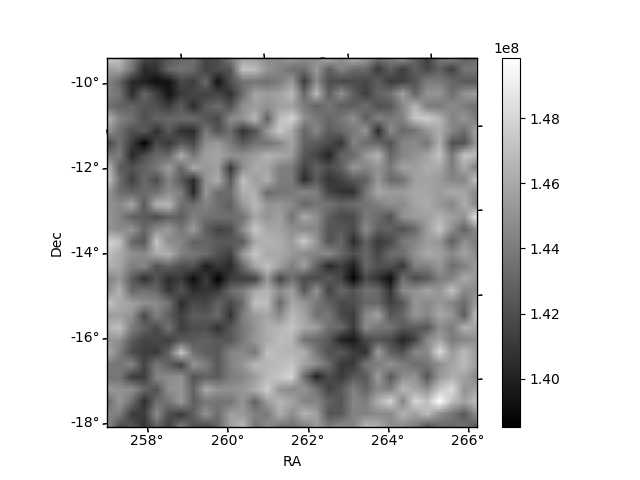
Histogram calculated using DETX and DETY for each event in the final _common_clean file
| Quadrant A | 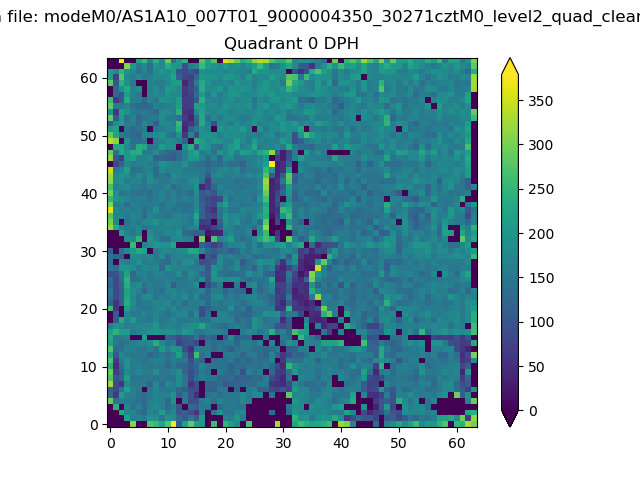 |
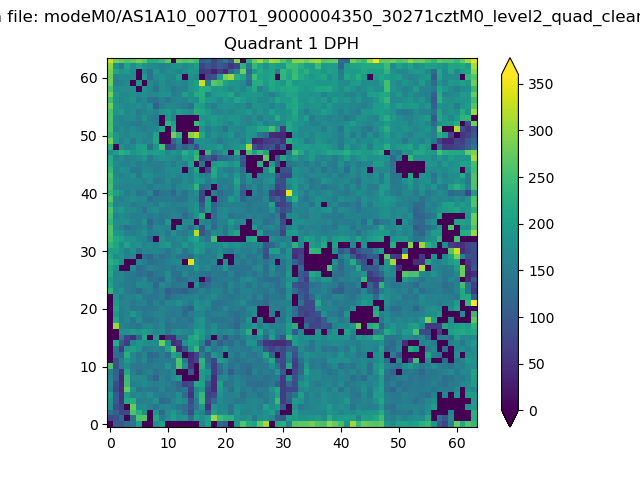 |
Quadrant B |
|---|---|---|---|
| Quadrant D | 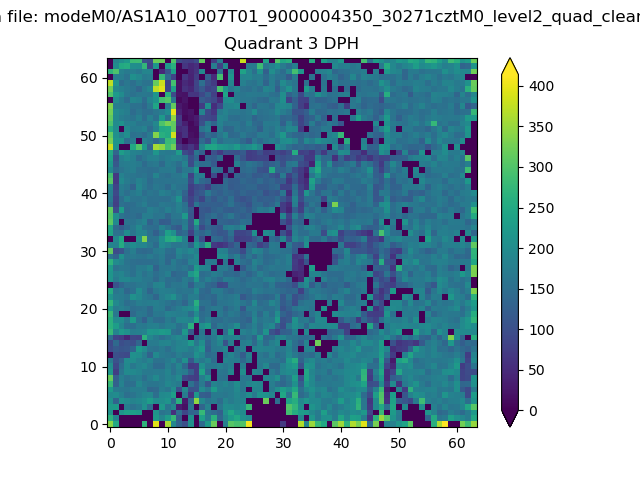 |
 |
Quadrant C |
| Plot type | Count rate plots | Images |
|---|---|---|
| Comparison with Poisson distribution Blue bars denote a histogram of data divided into 1 sec bins. Red curve is a Poisson curve with rate = median count rate of data. |
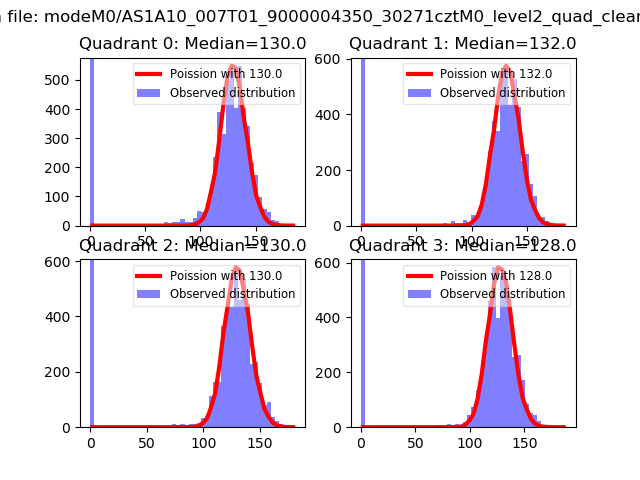 |
 |
| Quadrant-wise count rates Data is divided into 100 sec bins |
 |
|
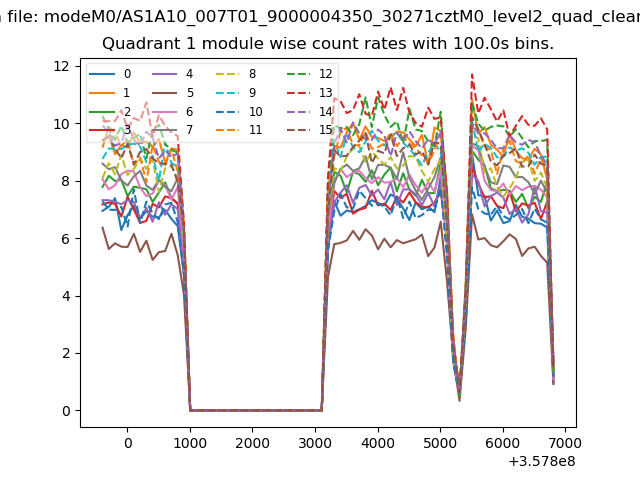
| Module-wise count rates for Quadrant A Data is divided into 100 sec bins |
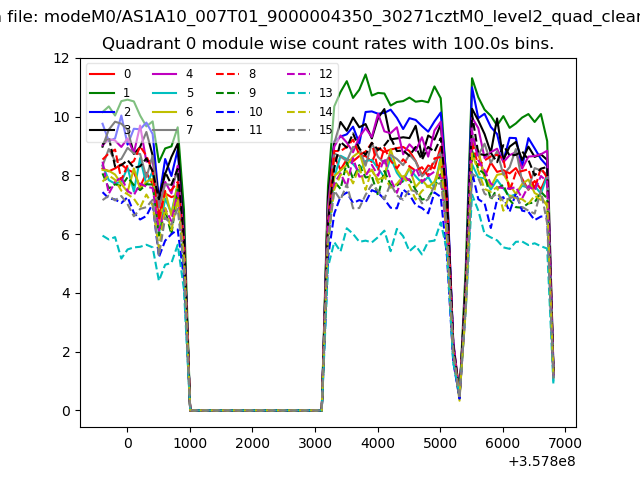 |
 |
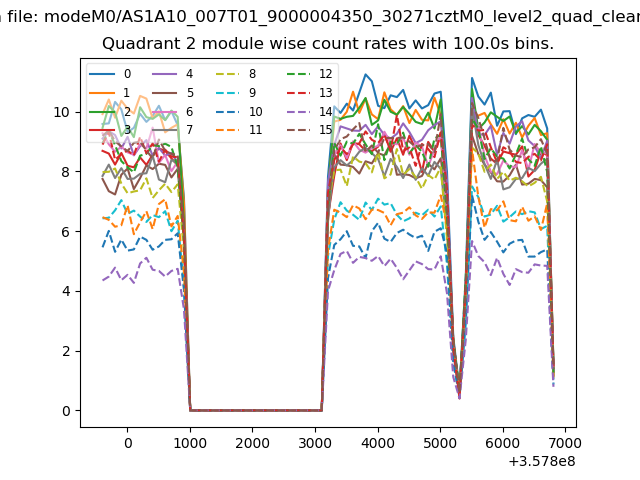
| Module-wise count rates for Quadrant B Data is divided into 100 sec bins |
 |
 |
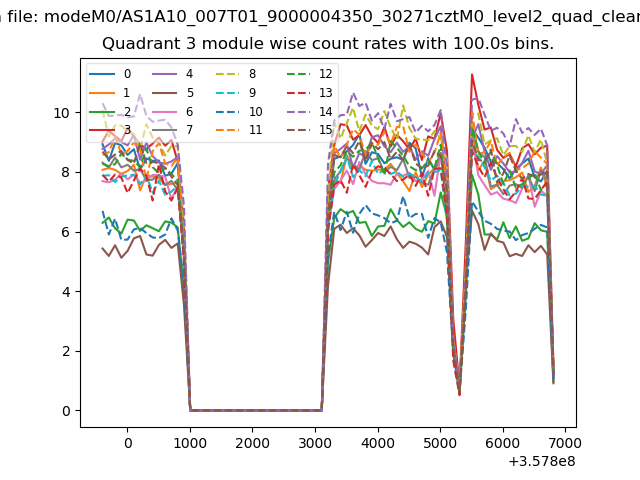
| Module-wise count rates for Quadrant C Data is divided into 100 sec bins |
 |
 |
| Module-wise count rates for Quadrant D Data is divided into 100 sec bins |
 |
 |
| Parameter | Plot |
|---|---|
| CZT HV Monitor | 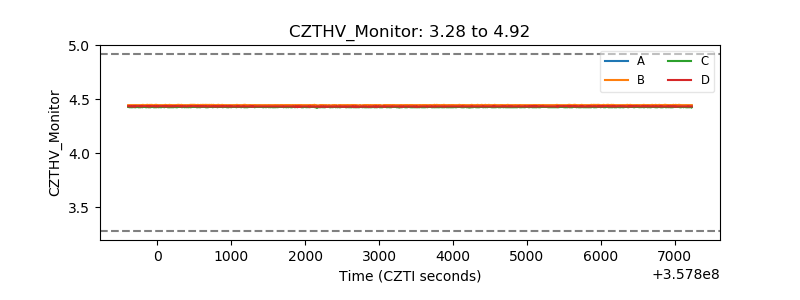 |
| D_VDD | 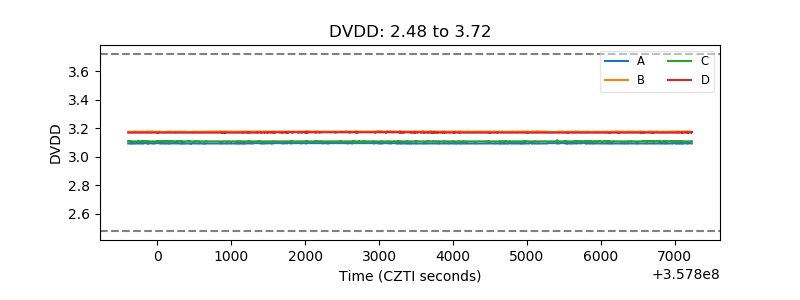 |
| Temperature 1 | 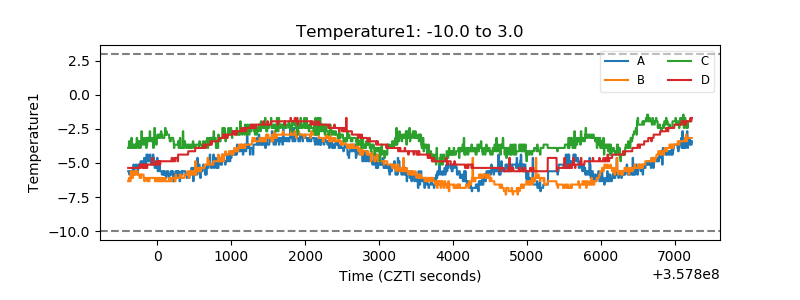 |
| Veto HV Monitor | 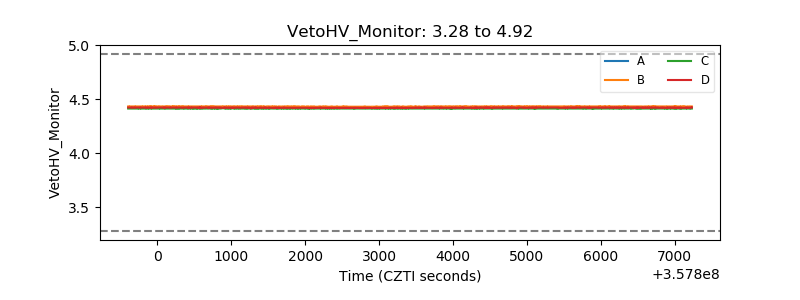 |
| Veto LLD | 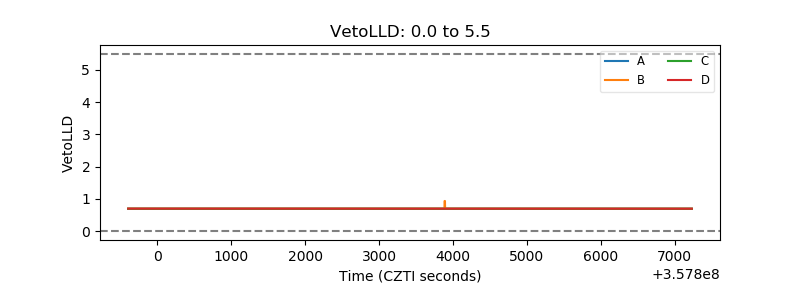 |
| Alpha Counter |  |
| _CPM_Rate |  |
| CZT Counter | 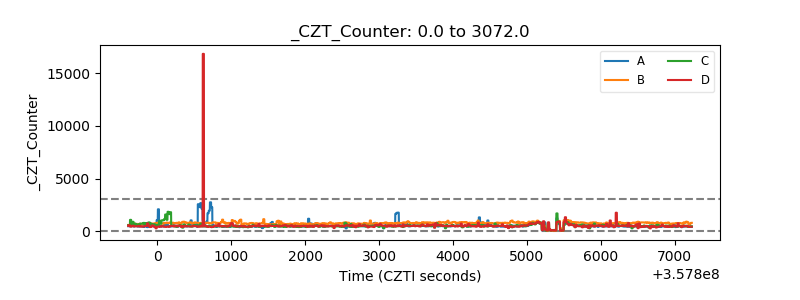 |
| +2.5 Volts monitor |  |
| +5 Volts monitor |  |
| _ROLL_ROT | 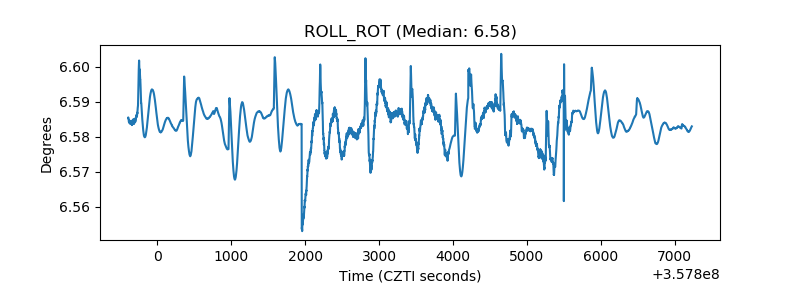 |
| _Roll_DEC | 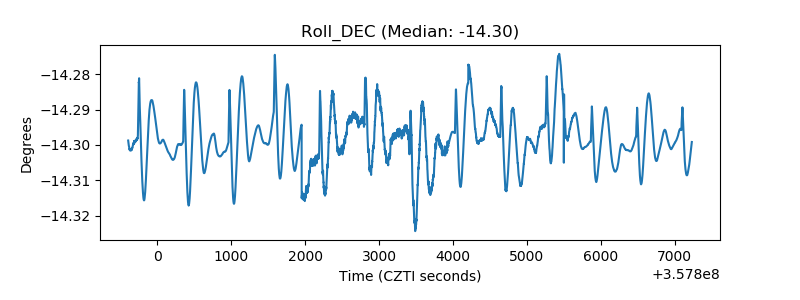 |
| _Roll_RA | 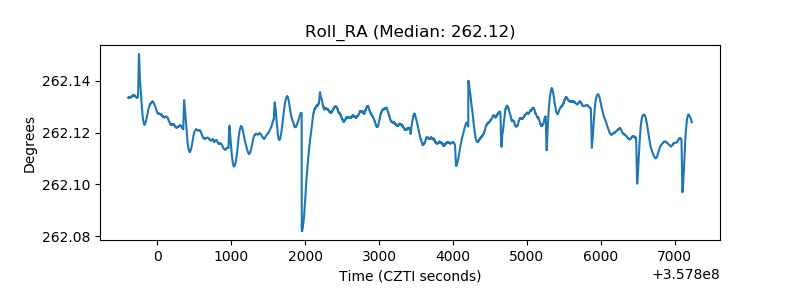 |
| Veto Counter | 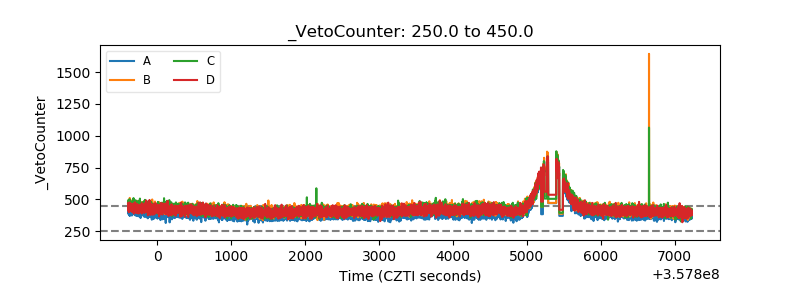 |