| Param | Original file | Final file |
|---|---|---|
| Filename | modeM0/AS1A10_007T01_9000004350_30272cztM0_level2.evt | modeM0/AS1A10_007T01_9000004350_30272cztM0_level2_quad_clean.evt |
| Size (bytes) | 433,725,120 | 61,709,760 |
| Size | 413.6 MB | 58.9 MB |
| Events in quadrant A | 2,750,637 | 372,292 |
| Events in quadrant B | 4,140,991 | 348,377 |
| Events in quadrant C | 2,826,211 | 377,468 |
| Events in quadrant D | 3,028,048 | 369,556 |
| Mode SS | |||
|---|---|---|---|
| Quadrant | BADHDUFLAG | Total packets | Discarded packets |
| A | 0 | 148 | 26 |
| B | 0 | 148 | 26 |
| C | 0 | 148 | 30 |
| D | 0 | 146 | 28 |
| Mode M0 | |||
|---|---|---|---|
| Quadrant | BADHDUFLAG | Total packets | Discarded packets |
| A | 0 | 16449 | 4655 |
| B | 0 | 22554 | 6035 |
| C | 0 | 15655 | 3815 |
| D | 0 | 16338 | 3848 |
| Quadrant | Total seconds | Saturated seconds | Saturation percentage |
|---|---|---|---|
| A | 5729 | 43 | 0.750567% |
| B | 5494 | 36 | 0.655260% |
| C | 5782 | 51 | 0.882048% |
| D | 5796 | 48 | 0.828157% |
Noise dominated data is calculated using 1-second bins in cleaned event files. If a bin has >2000 counts, and if more than 50% of those come from <1% of pixels, then it is considered to be noise-dominated and hence unusable.
| Quadrant | # 1 sec bins | Bins with >0 counts | Bins with >2000 counts | High rate bins dominated by noise | Noise dominated (total time) | Noise dominated (detector-on time) | Marked lightcurve |
|---|---|---|---|---|---|---|---|
| A | 7399 | 6201 | 5 | 5 | 0.07% | 0.08% | 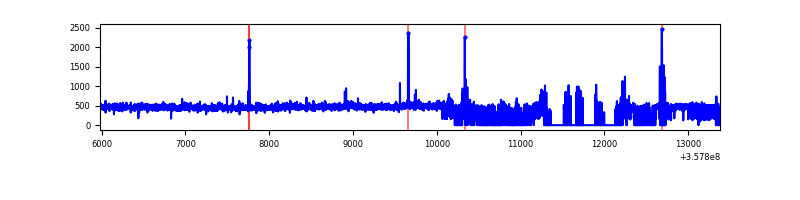 |
| B | 7401 | 5957 | 0 | 0 | 0.00% | 0.00% | 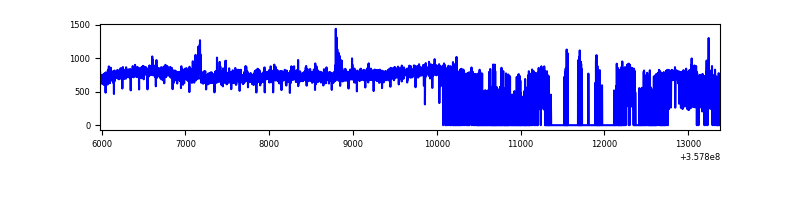 |
| C | 7400 | 6261 | 0 | 0 | 0.00% | 0.00% | 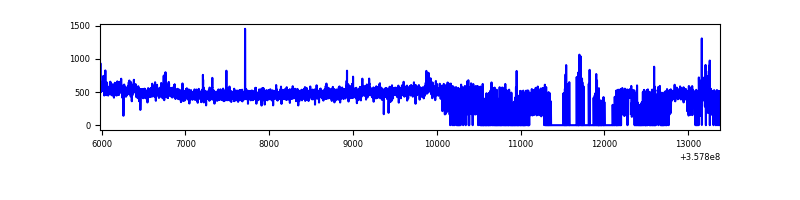 |
| D | 7401 | 6292 | 23 | 23 | 0.31% | 0.37% | 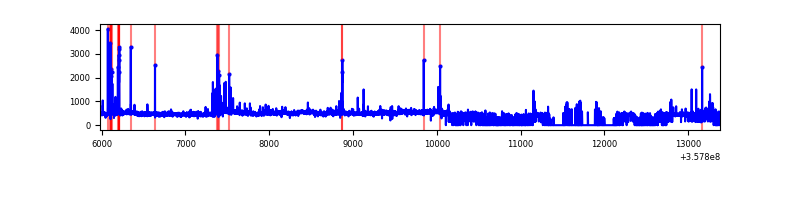 |
Top three noisy pixels from each quadrant. If the there are fewer than three noisy pixels in the level2.evt file, extra rows are filled as -1
| Pixel properties | Quadrant properties | ||||||
|---|---|---|---|---|---|---|---|
| Quadrant | DetID | PixID | Counts | Sigma | Mean | Median | Sigma |
| A | 14 | 239 | 124054 | 902.04 | 680 | 666 | 136.8 |
| A | 13 | 254 | 10440 | 71.45 | 680 | 666 | 136.8 |
| A | 3 | 137 | 7056 | 46.71 | 680 | 666 | 136.8 |
| B | 6 | 159 | 1532995 | 12128.65 | 643 | 626 | 126.3 |
| B | 6 | 36 | 57637 | 451.24 | 643 | 626 | 126.3 |
| B | 0 | 190 | 25721 | 198.63 | 643 | 626 | 126.3 |
| C | 14 | 238 | 111194 | 705.45 | 665 | 670 | 156.7 |
| C | 3 | 233 | 102252 | 648.38 | 665 | 670 | 156.7 |
| C | 2 | 114 | 13311 | 80.69 | 665 | 670 | 156.7 |
| D | 8 | 195 | 191298 | 1089.41 | 669 | 658 | 175.0 |
| D | 2 | 250 | 169263 | 963.49 | 669 | 658 | 175.0 |
| D | 12 | 227 | 30830 | 172.42 | 669 | 658 | 175.0 |
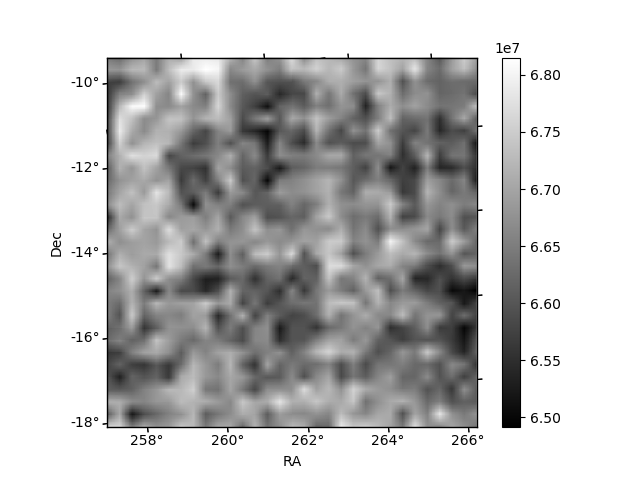
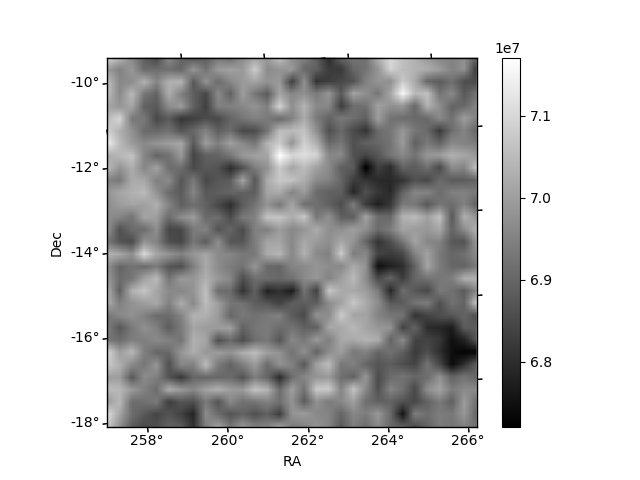
Histogram calculated using DETX and DETY for each event in the final _common_clean file
| Quadrant A | 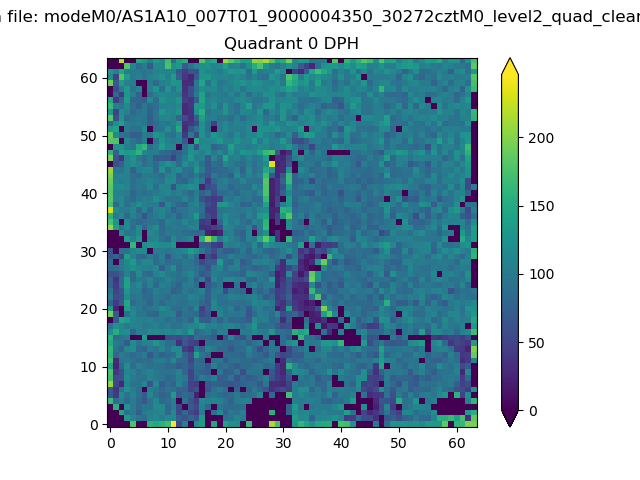 |
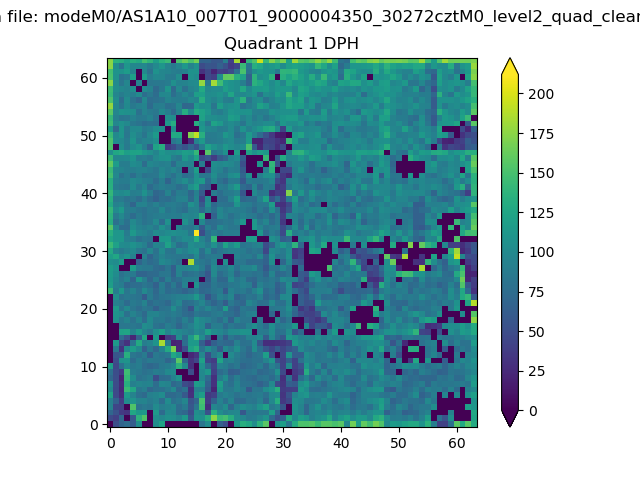 |
Quadrant B |
|---|---|---|---|
| Quadrant D | 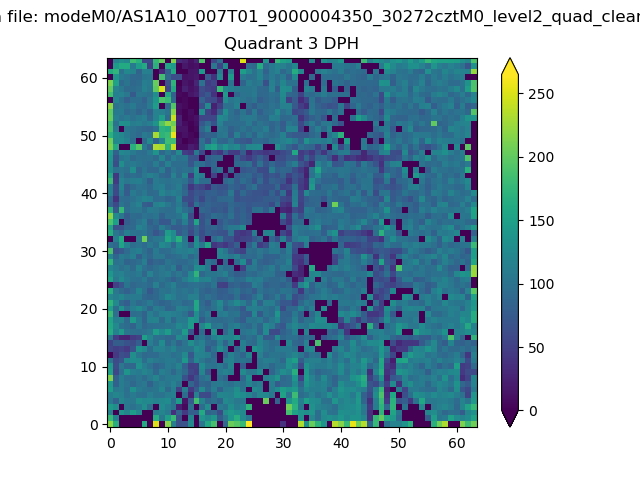 |
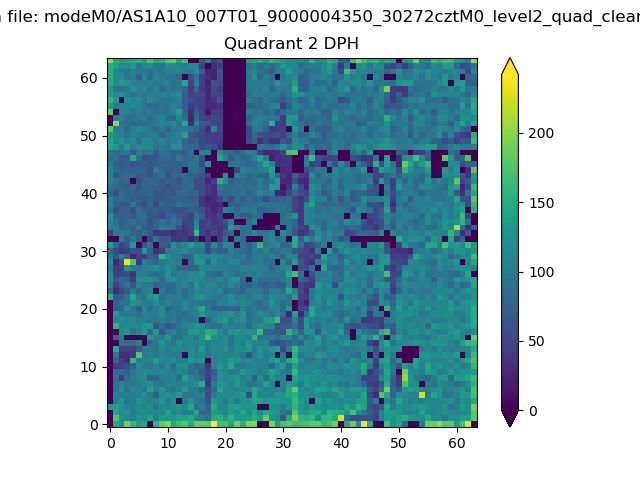 |
Quadrant C |
| Plot type | Count rate plots | Images |
|---|---|---|
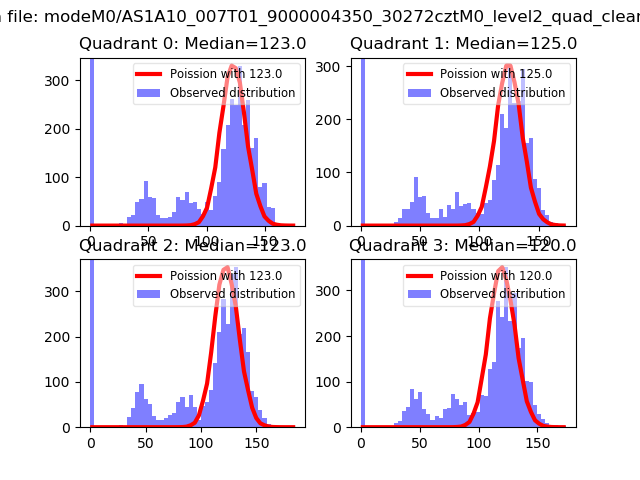
| Comparison with Poisson distribution Blue bars denote a histogram of data divided into 1 sec bins. Red curve is a Poisson curve with rate = median count rate of data. |
 |
 |
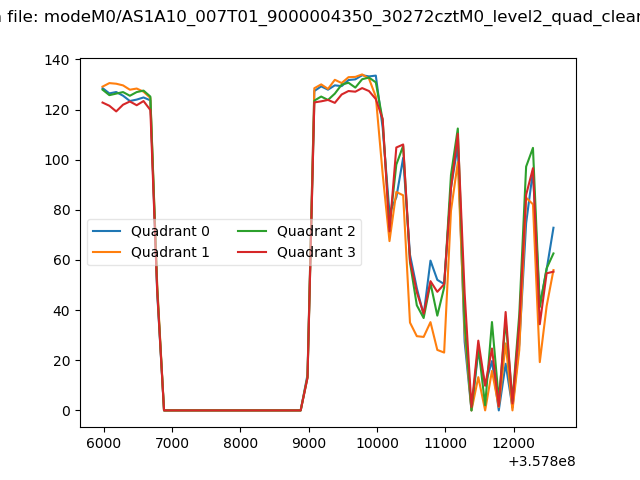
| Quadrant-wise count rates Data is divided into 100 sec bins |
 |
|
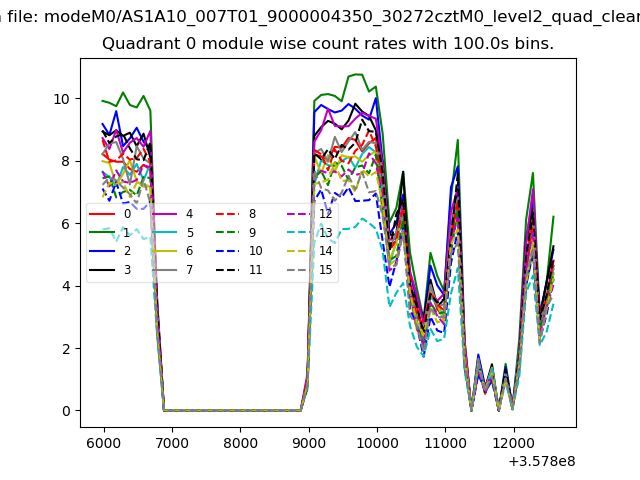
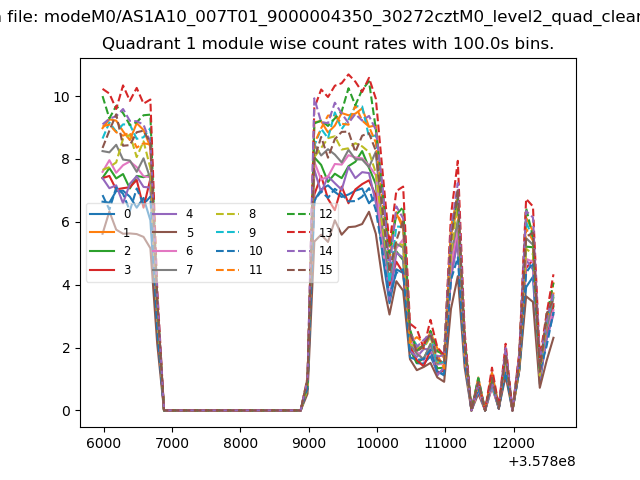
| Module-wise count rates for Quadrant A Data is divided into 100 sec bins |
 |
 |
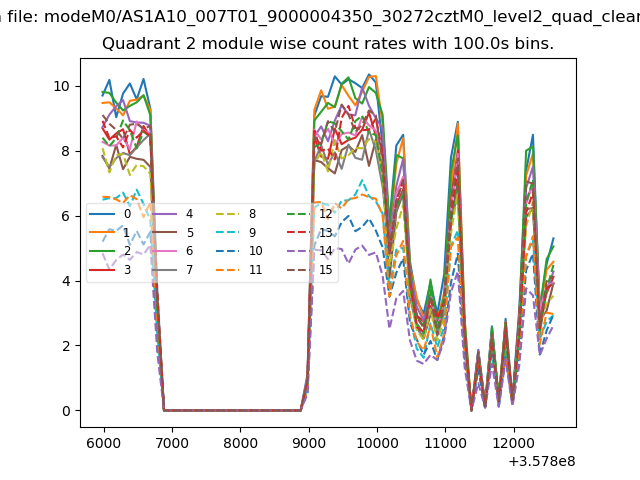
| Module-wise count rates for Quadrant B Data is divided into 100 sec bins |
 |
 |
| Module-wise count rates for Quadrant C Data is divided into 100 sec bins |
 |
 |
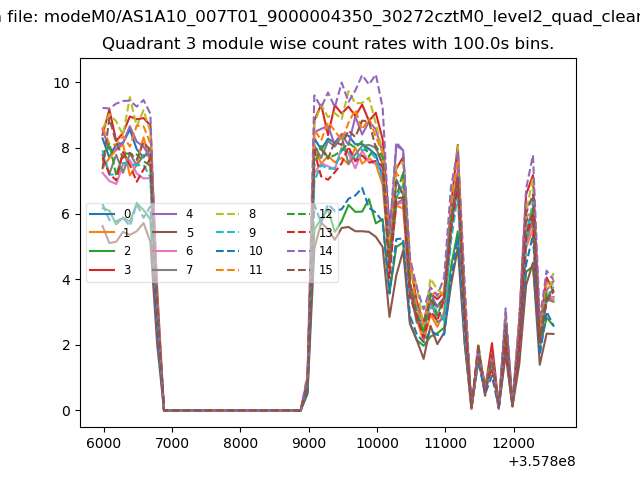
| Module-wise count rates for Quadrant D Data is divided into 100 sec bins |
 |
 |
| Parameter | Plot |
|---|---|
| CZT HV Monitor | 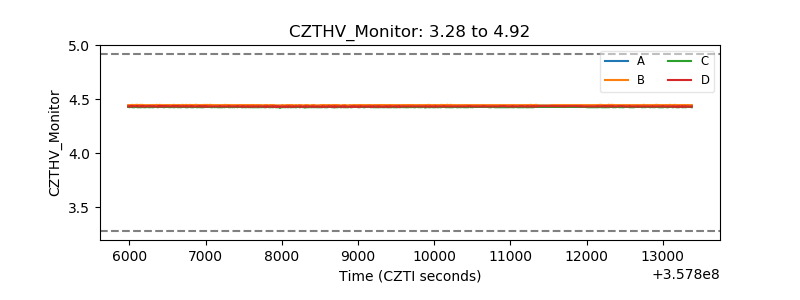 |
| D_VDD | 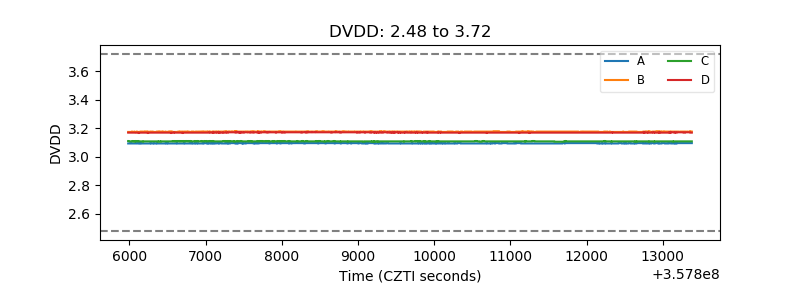 |
| Temperature 1 | 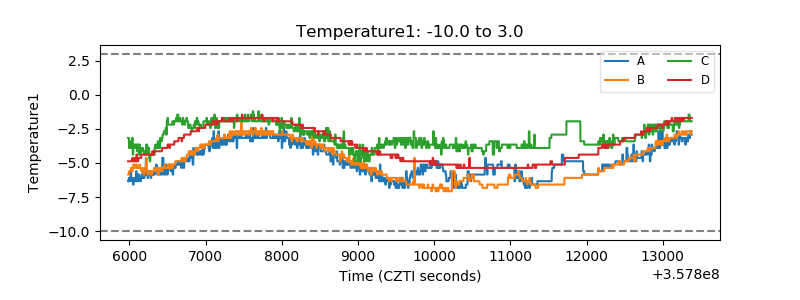 |
| Veto HV Monitor | 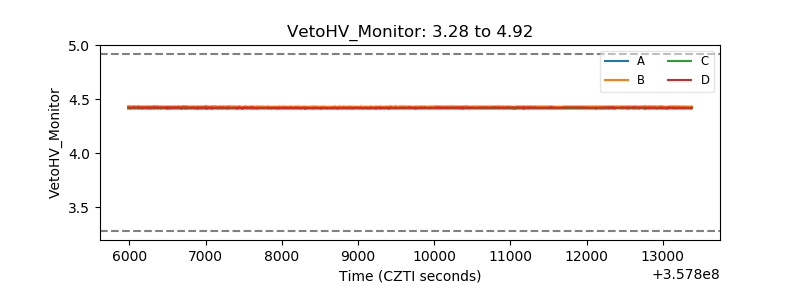 |
| Veto LLD | 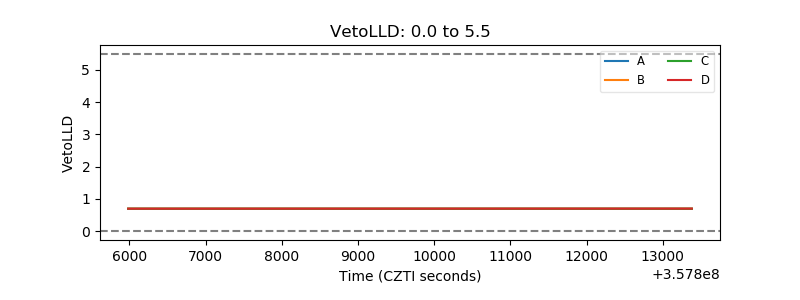 |
| Alpha Counter | 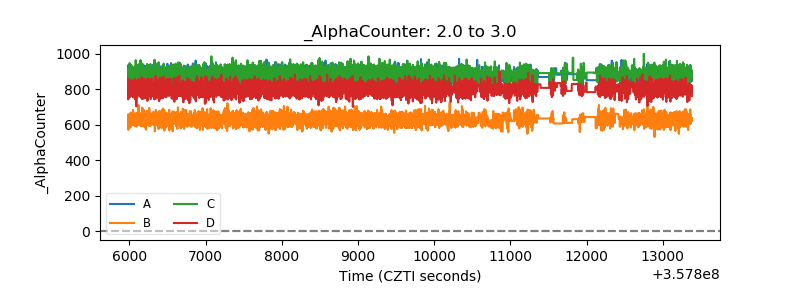 |
| _CPM_Rate | 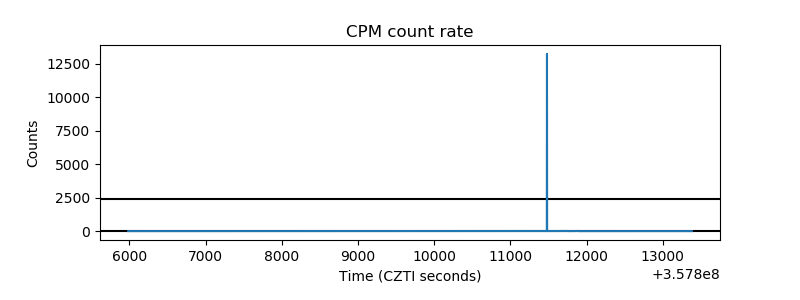 |
| CZT Counter | 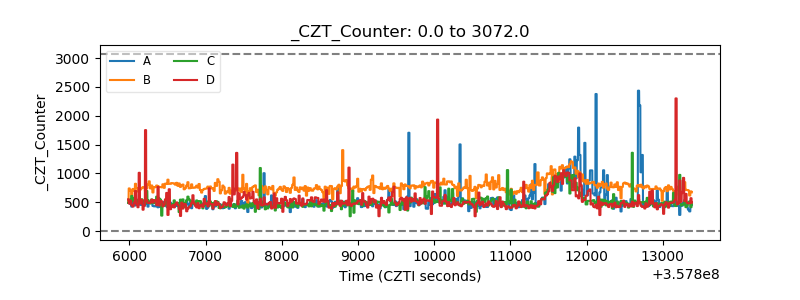 |
| +2.5 Volts monitor |  |
| +5 Volts monitor |  |
| _ROLL_ROT | 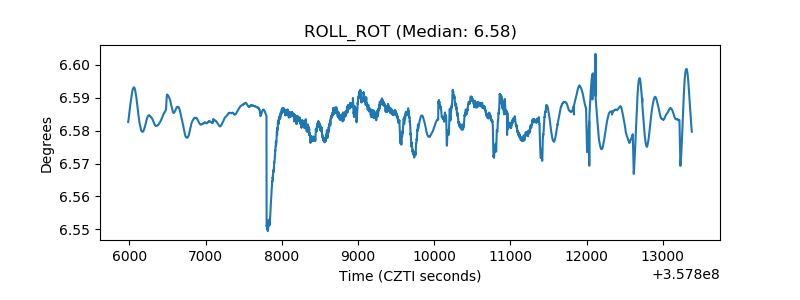 |
| _Roll_DEC | 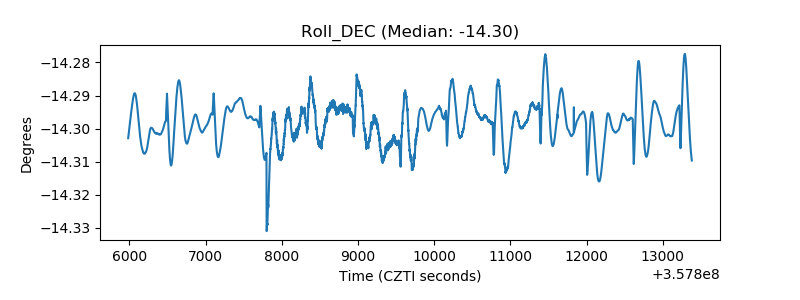 |
| _Roll_RA |  |
| Veto Counter | 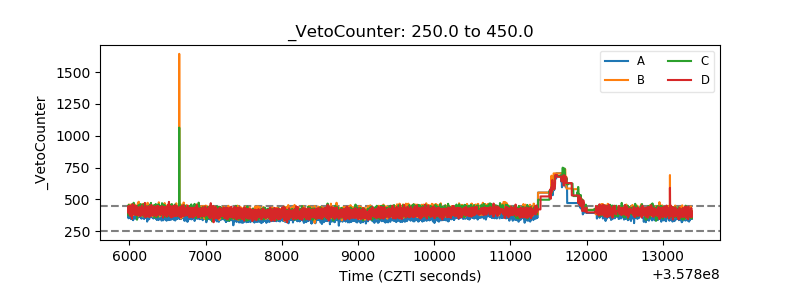 |