| Param | Original file | Final file |
|---|---|---|
| Filename | modeM0/AS1A10_007T01_9000004350_30277cztM0_level2.evt | modeM0/AS1A10_007T01_9000004350_30277cztM0_level2_quad_clean.evt |
| Size (bytes) | 565,306,560 | 84,150,720 |
| Size | 539.1 MB | 80.3 MB |
| Events in quadrant A | 3,773,611 | 524,044 |
| Events in quadrant B | 5,331,091 | 530,863 |
| Events in quadrant C | 3,714,198 | 516,505 |
| Events in quadrant D | 3,849,682 | 511,778 |
| Mode M9 | |||
|---|---|---|---|
| Quadrant | BADHDUFLAG | Total packets | Discarded packets |
| A | 0 | 19 | 0 |
| B | 0 | 19 | 0 |
| C | 0 | 19 | 0 |
| D | 0 | 19 | 0 |
| Mode SS | |||
|---|---|---|---|
| Quadrant | BADHDUFLAG | Total packets | Discarded packets |
| A | 0 | 136 | 0 |
| B | 0 | 136 | 0 |
| C | 0 | 136 | 0 |
| D | 0 | 136 | 0 |
| Mode M0 | |||
|---|---|---|---|
| Quadrant | BADHDUFLAG | Total packets | Discarded packets |
| A | 0 | 15555 | 2 |
| B | 0 | 20594 | 2 |
| C | 0 | 15122 | 2 |
| D | 0 | 16038 | 2 |
| Quadrant | Total seconds | Saturated seconds | Saturation percentage |
|---|---|---|---|
| A | 6675 | 276 | 4.134831% |
| B | 6675 | 168 | 2.516854% |
| C | 6675 | 235 | 3.520599% |
| D | 6676 | 112 | 1.677651% |
Noise dominated data is calculated using 1-second bins in cleaned event files. If a bin has >2000 counts, and if more than 50% of those come from <1% of pixels, then it is considered to be noise-dominated and hence unusable.
| Quadrant | # 1 sec bins | Bins with >0 counts | Bins with >2000 counts | High rate bins dominated by noise | Noise dominated (total time) | Noise dominated (detector-on time) | Marked lightcurve |
|---|---|---|---|---|---|---|---|
| A | 8570 | 6676 | 160 | 160 | 1.87% | 2.40% | 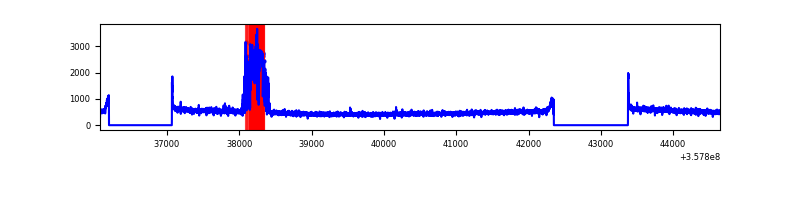 |
| B | 8570 | 6675 | 16 | 16 | 0.19% | 0.24% | 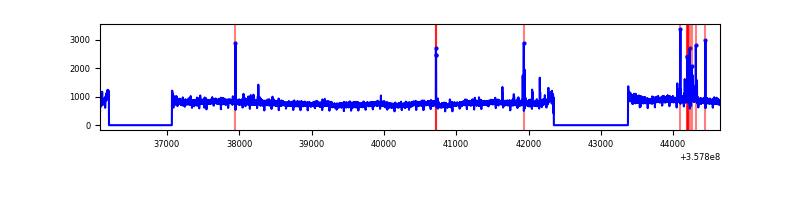 |
| C | 8570 | 6675 | 4 | 4 | 0.05% | 0.06% | 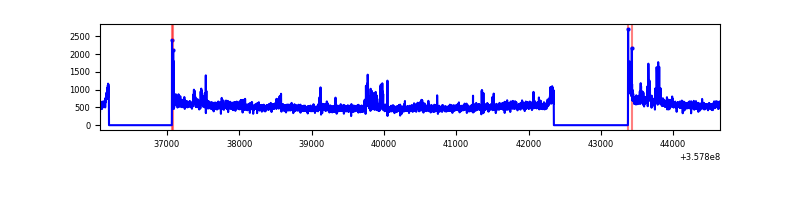 |
| D | 8571 | 6678 | 44 | 44 | 0.51% | 0.66% | 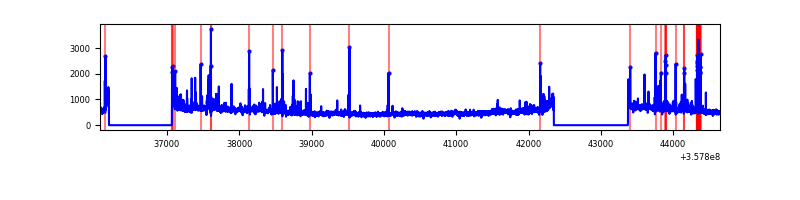 |
Top three noisy pixels from each quadrant. If the there are fewer than three noisy pixels in the level2.evt file, extra rows are filled as -1
| Pixel properties | Quadrant properties | ||||||
|---|---|---|---|---|---|---|---|
| Quadrant | DetID | PixID | Counts | Sigma | Mean | Median | Sigma |
| A | 0 | 13 | 518987 | 3073.17 | 835 | 816 | 168.6 |
| A | 8 | 192 | 25067 | 143.83 | 835 | 816 | 168.6 |
| A | 13 | 254 | 12305 | 68.14 | 835 | 816 | 168.6 |
| B | 6 | 159 | 1887374 | 11717.87 | 842 | 822 | 161.0 |
| B | 0 | 229 | 48169 | 294.08 | 842 | 822 | 161.0 |
| B | 0 | 190 | 43181 | 263.1 | 842 | 822 | 161.0 |
| C | 3 | 233 | 315520 | 1622.63 | 817 | 822 | 193.9 |
| C | 14 | 238 | 150928 | 773.97 | 817 | 822 | 193.9 |
| C | 14 | 254 | 29049 | 145.54 | 817 | 822 | 193.9 |
| D | 8 | 195 | 298269 | 1438.02 | 823 | 803 | 206.9 |
| D | 12 | 233 | 147082 | 707.15 | 823 | 803 | 206.9 |
| D | 13 | 249 | 79397 | 379.94 | 823 | 803 | 206.9 |
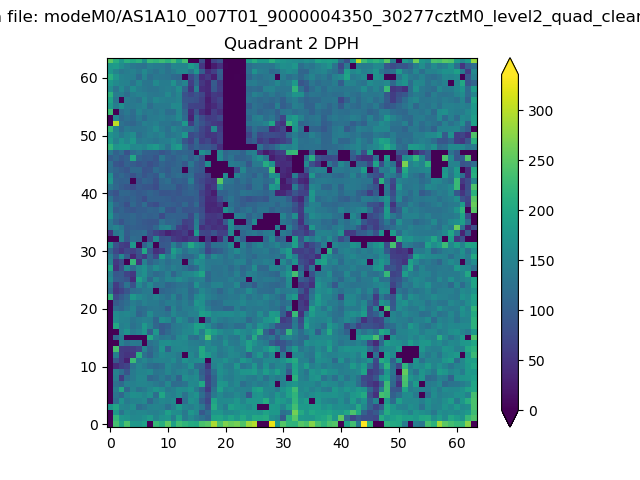
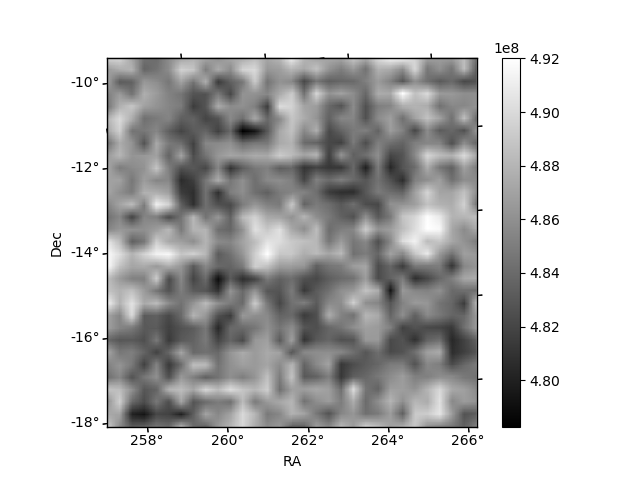
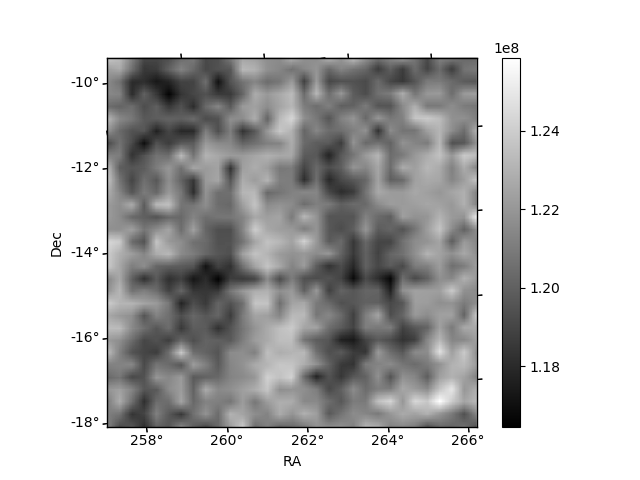
Histogram calculated using DETX and DETY for each event in the final _common_clean file
| Quadrant A | 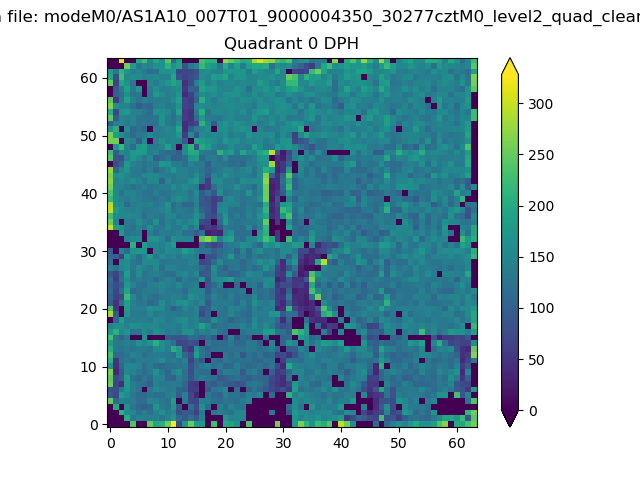 |
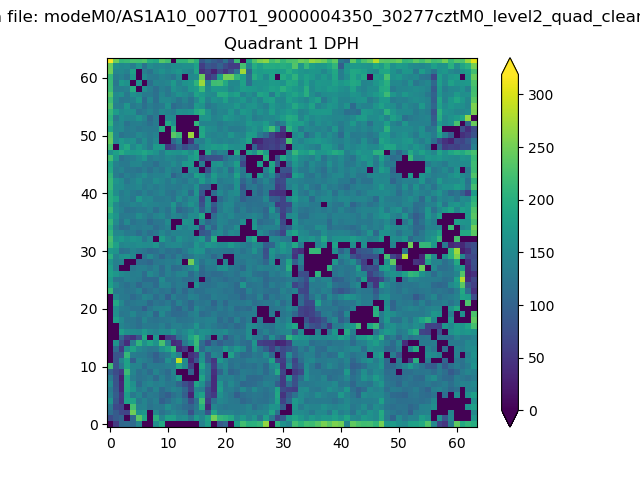 |
Quadrant B |
|---|---|---|---|
| Quadrant D | 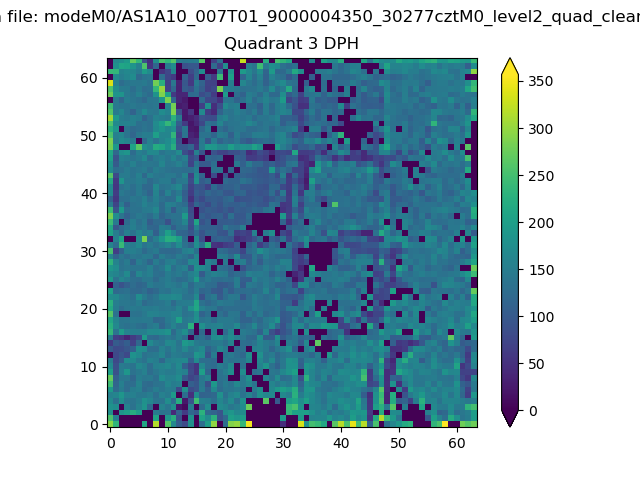 |
 |
Quadrant C |
| Plot type | Count rate plots | Images |
|---|---|---|
| Comparison with Poisson distribution Blue bars denote a histogram of data divided into 1 sec bins. Red curve is a Poisson curve with rate = median count rate of data. |
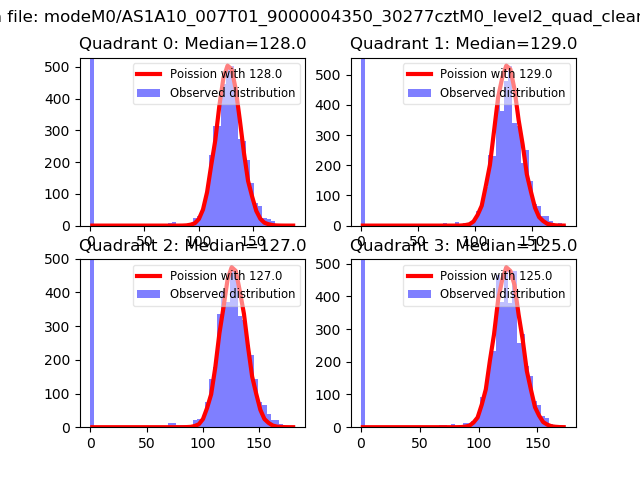 |
 |
| Quadrant-wise count rates Data is divided into 100 sec bins |
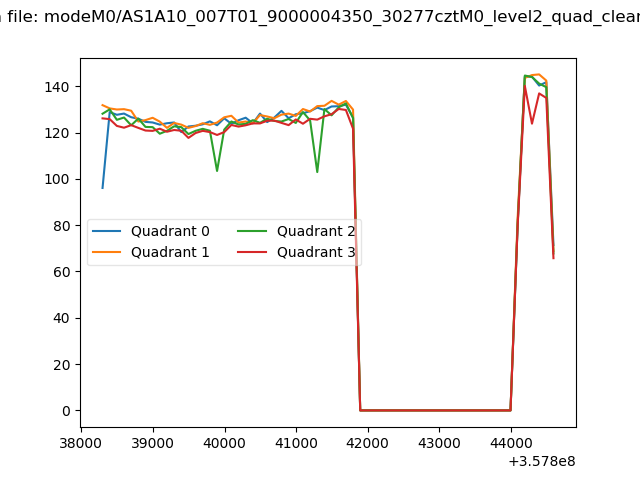 |
|
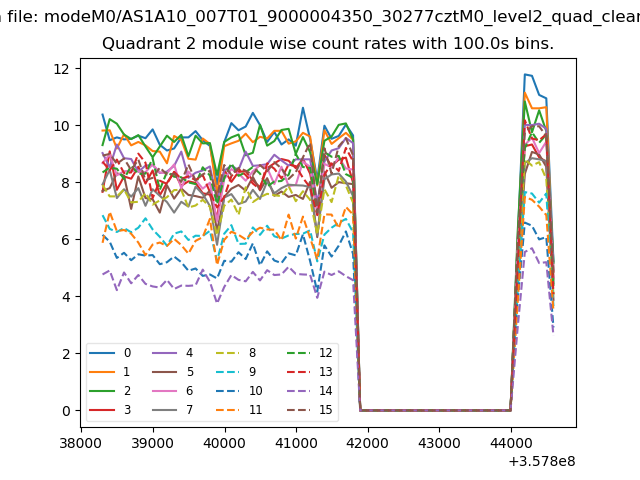
| Module-wise count rates for Quadrant A Data is divided into 100 sec bins |
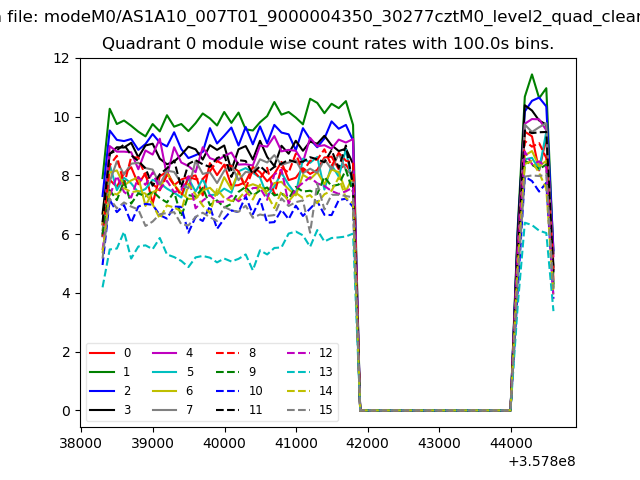 |
 |
| Module-wise count rates for Quadrant B Data is divided into 100 sec bins |
 |
 |
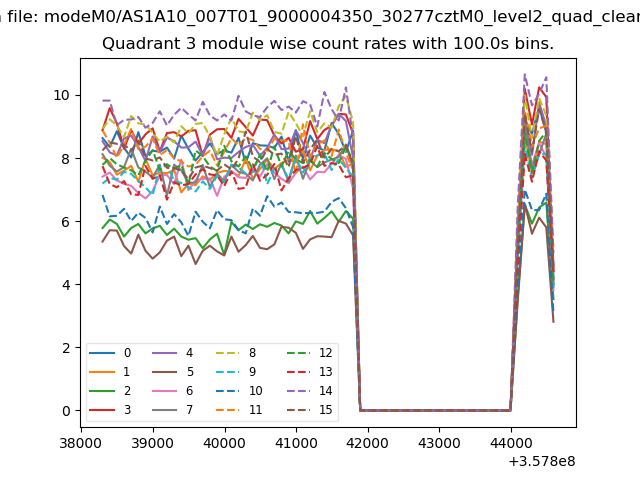
| Module-wise count rates for Quadrant C Data is divided into 100 sec bins |
 |
 |
| Module-wise count rates for Quadrant D Data is divided into 100 sec bins |
 |
 |
| Parameter | Plot |
|---|---|
| CZT HV Monitor | 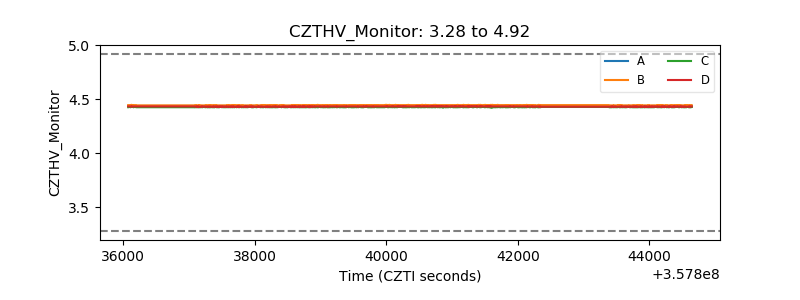 |
| D_VDD | 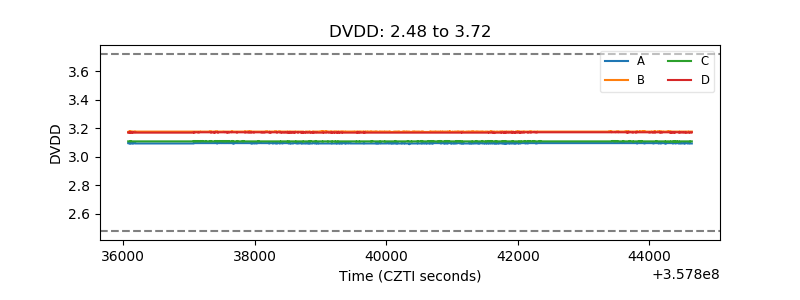 |
| Temperature 1 | 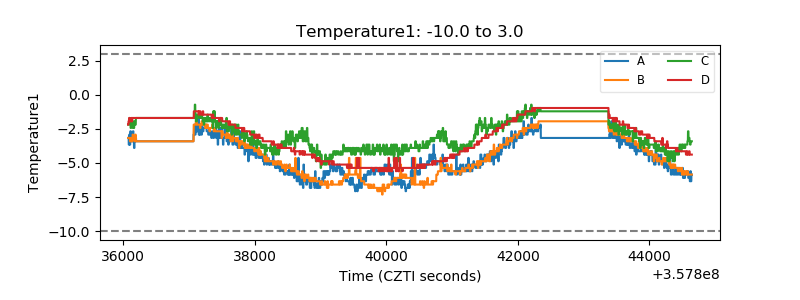 |
| Veto HV Monitor | 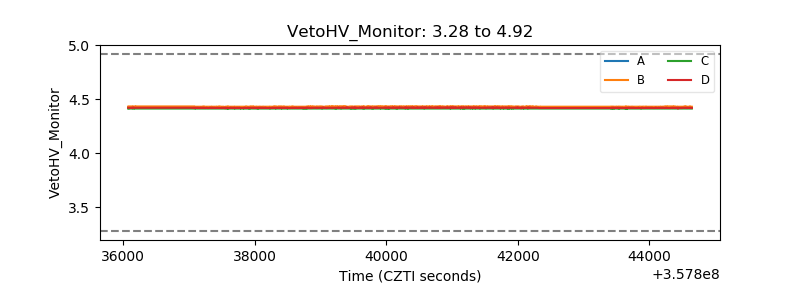 |
| Veto LLD | 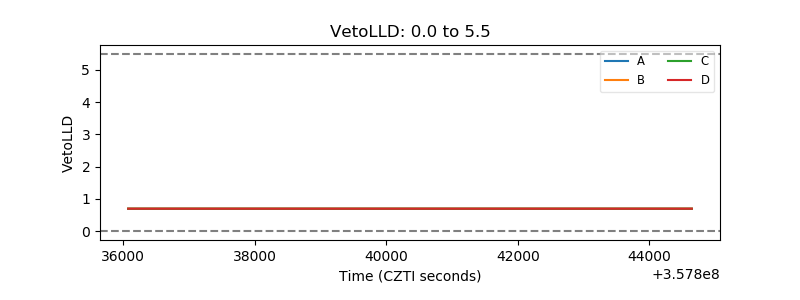 |
| Alpha Counter | 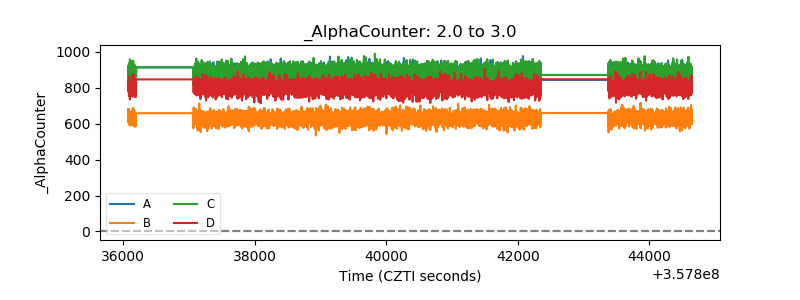 |
| _CPM_Rate |  |
| CZT Counter | 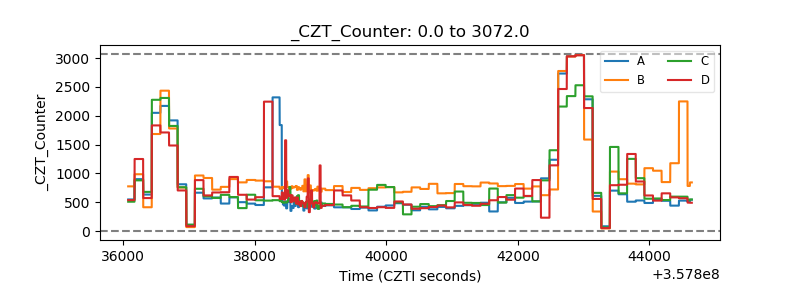 |
| +2.5 Volts monitor | 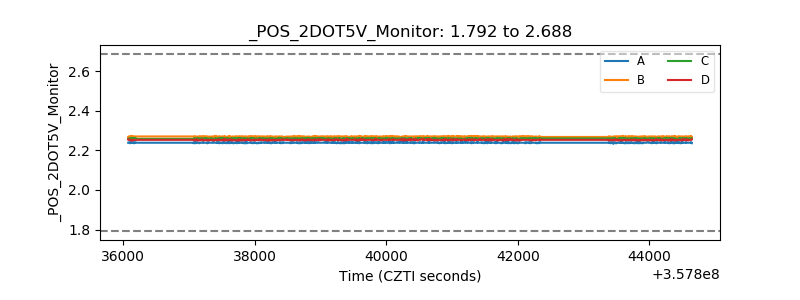 |
| +5 Volts monitor |  |
| _ROLL_ROT | 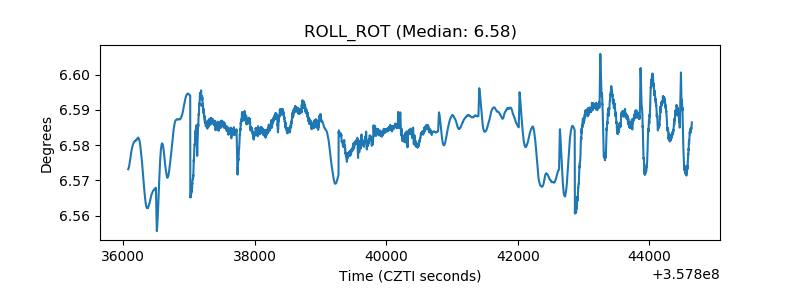 |
| _Roll_DEC | 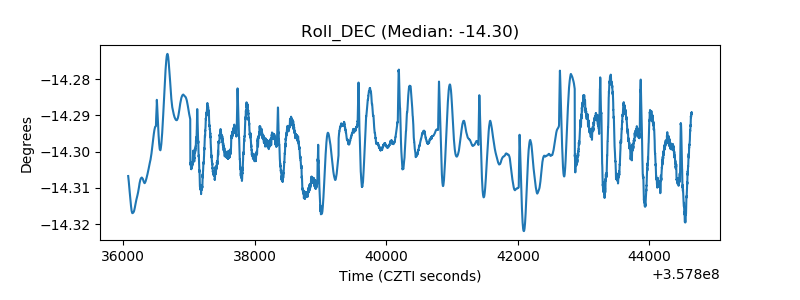 |
| _Roll_RA | 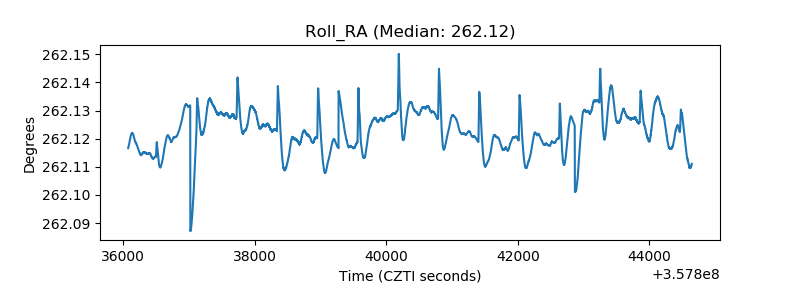 |
| Veto Counter | 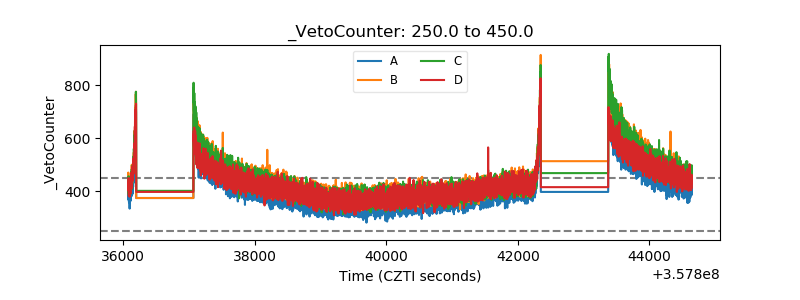 |