| Param | Original file | Final file |
|---|---|---|
| Filename | modeM0/AS1A10_007T01_9000004350_30280cztM0_level2.evt | modeM0/AS1A10_007T01_9000004350_30280cztM0_level2_quad_clean.evt |
| Size (bytes) | 664,813,440 | 112,282,560 |
| Size | 634.0 MB | 107.1 MB |
| Events in quadrant A | 3,600,311 | 738,709 |
| Events in quadrant B | 5,634,962 | 763,227 |
| Events in quadrant C | 4,494,507 | 731,614 |
| Events in quadrant D | 5,942,317 | 690,404 |
| Mode M9 | |||
|---|---|---|---|
| Quadrant | BADHDUFLAG | Total packets | Discarded packets |
| A | 0 | 25 | 0 |
| B | 0 | 25 | 0 |
| C | 0 | 25 | 0 |
| D | 0 | 25 | 0 |
| Mode SS | |||
|---|---|---|---|
| Quadrant | BADHDUFLAG | Total packets | Discarded packets |
| A | 0 | 140 | 0 |
| B | 0 | 140 | 0 |
| C | 0 | 140 | 0 |
| D | 0 | 140 | 0 |
| Mode M0 | |||
|---|---|---|---|
| Quadrant | BADHDUFLAG | Total packets | Discarded packets |
| A | 0 | 14884 | 2 |
| B | 0 | 21259 | 2 |
| C | 0 | 18259 | 2 |
| D | 0 | 22248 | 2 |
| Quadrant | Total seconds | Saturated seconds | Saturation percentage |
|---|---|---|---|
| A | 6839 | 70 | 1.023541% |
| B | 6840 | 129 | 1.885965% |
| C | 6840 | 252 | 3.684211% |
| D | 6839 | 648 | 9.475069% |
Noise dominated data is calculated using 1-second bins in cleaned event files. If a bin has >2000 counts, and if more than 50% of those come from <1% of pixels, then it is considered to be noise-dominated and hence unusable.
| Quadrant | # 1 sec bins | Bins with >0 counts | Bins with >2000 counts | High rate bins dominated by noise | Noise dominated (total time) | Noise dominated (detector-on time) | Marked lightcurve |
|---|---|---|---|---|---|---|---|
| A | 9309 | 6841 | 3 | 3 | 0.03% | 0.04% | 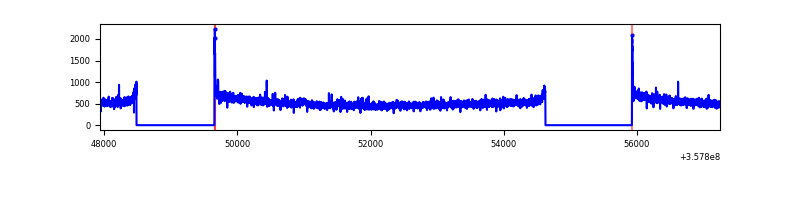 |
| B | 9310 | 6842 | 4 | 4 | 0.04% | 0.06% | 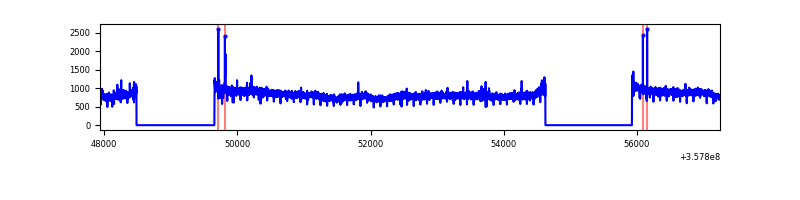 |
| C | 9310 | 6842 | 19 | 19 | 0.20% | 0.28% | 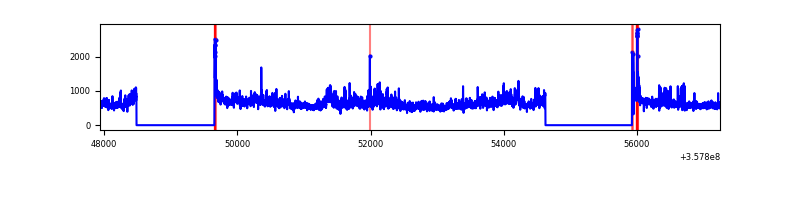 |
| D | 9309 | 6841 | 558 | 558 | 5.99% | 8.16% | 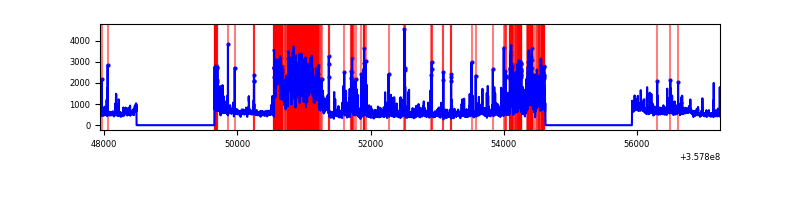 |
Top three noisy pixels from each quadrant. If the there are fewer than three noisy pixels in the level2.evt file, extra rows are filled as -1
| Pixel properties | Quadrant properties | ||||||
|---|---|---|---|---|---|---|---|
| Quadrant | DetID | PixID | Counts | Sigma | Mean | Median | Sigma |
| A | 13 | 170 | 44989 | 244.46 | 913 | 898 | 180.4 |
| A | 8 | 192 | 27132 | 145.46 | 913 | 898 | 180.4 |
| A | 13 | 254 | 13486 | 69.79 | 913 | 898 | 180.4 |
| B | 6 | 159 | 1991422 | 11543.91 | 917 | 895 | 172.4 |
| B | 12 | 111 | 20723 | 114.99 | 917 | 895 | 172.4 |
| B | 11 | 111 | 18817 | 103.94 | 917 | 895 | 172.4 |
| C | 3 | 233 | 735077 | 3549.92 | 889 | 897 | 206.8 |
| C | 14 | 238 | 168520 | 810.49 | 889 | 897 | 206.8 |
| C | 0 | 10 | 74995 | 358.28 | 889 | 897 | 206.8 |
| D | 12 | 227 | 1220849 | 5553.71 | 867 | 849 | 219.7 |
| D | 1 | 52 | 794667 | 3613.63 | 867 | 849 | 219.7 |
| D | 13 | 104 | 275750 | 1251.41 | 867 | 849 | 219.7 |
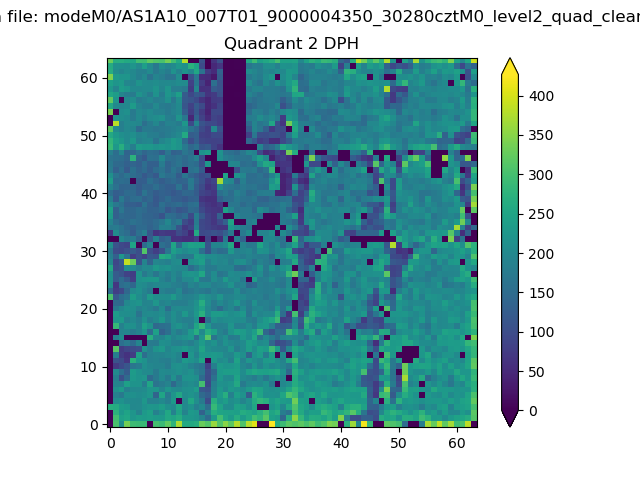
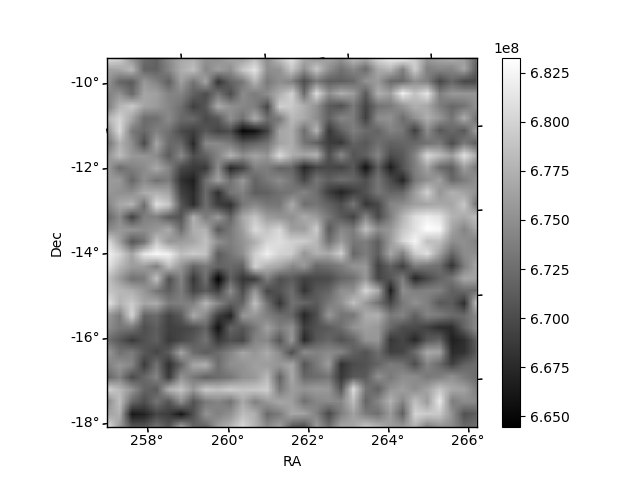
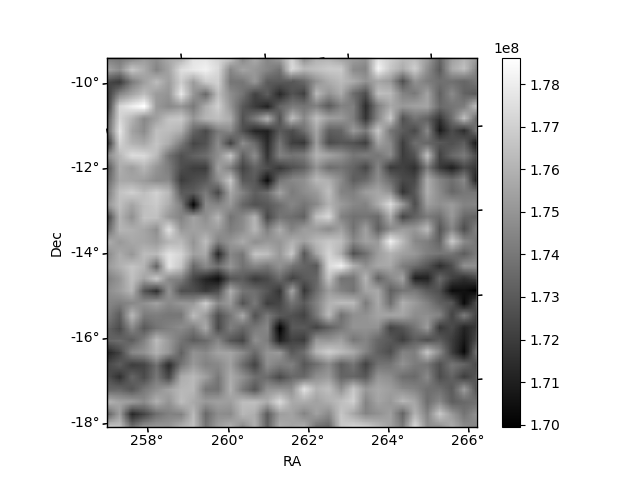
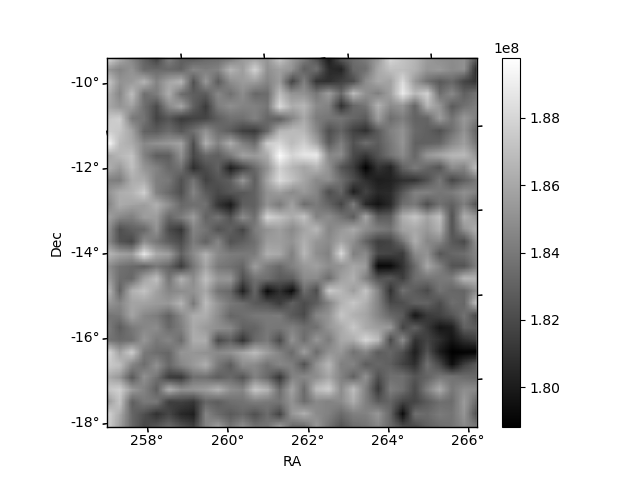
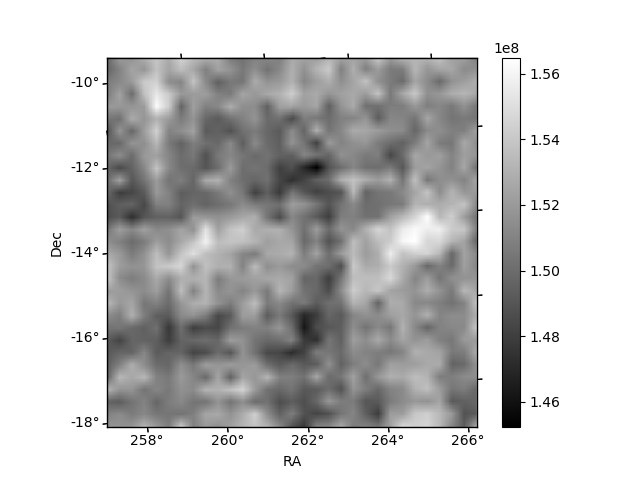
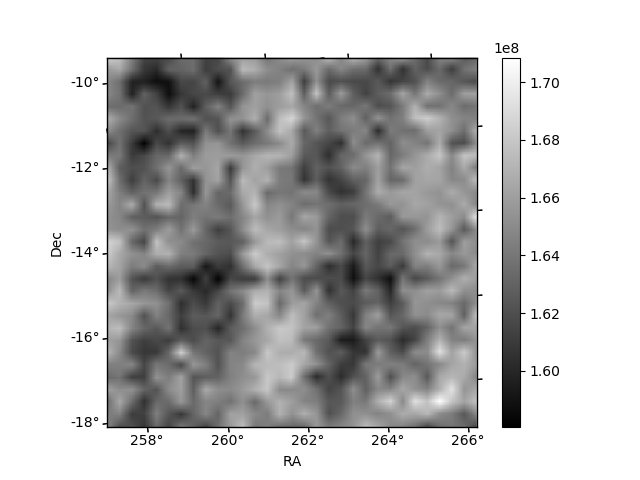
Histogram calculated using DETX and DETY for each event in the final _common_clean file
| Quadrant A | 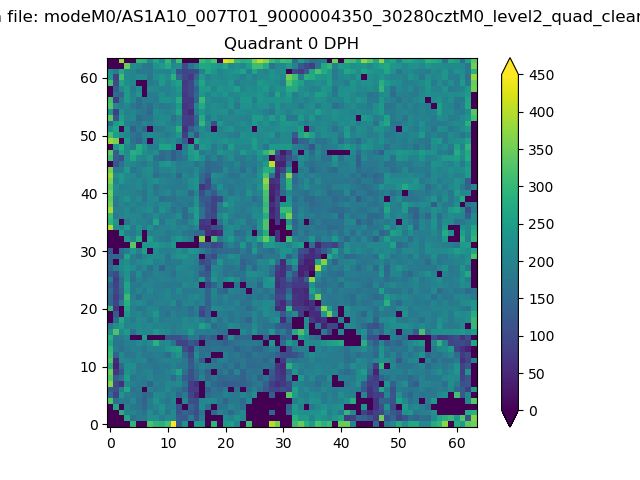 |
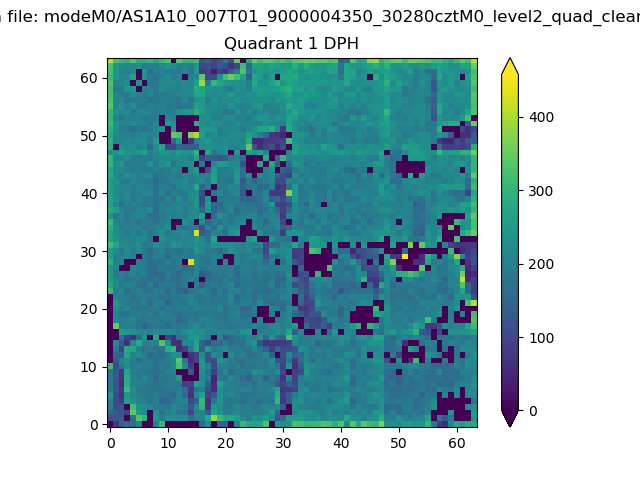 |
Quadrant B |
|---|---|---|---|
| Quadrant D | 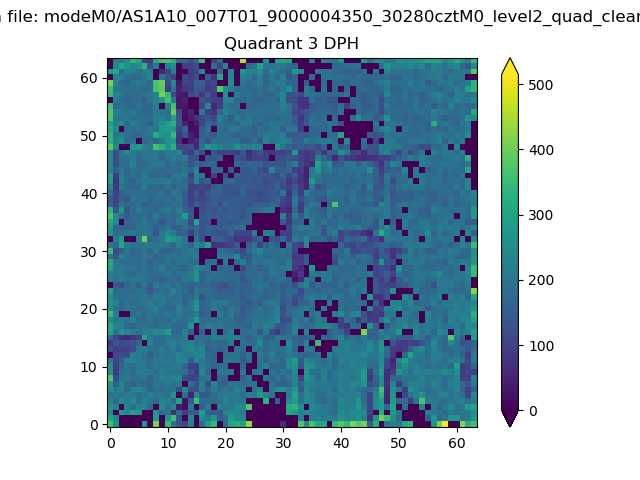 |
 |
Quadrant C |
| Plot type | Count rate plots | Images |
|---|---|---|
| Comparison with Poisson distribution Blue bars denote a histogram of data divided into 1 sec bins. Red curve is a Poisson curve with rate = median count rate of data. |
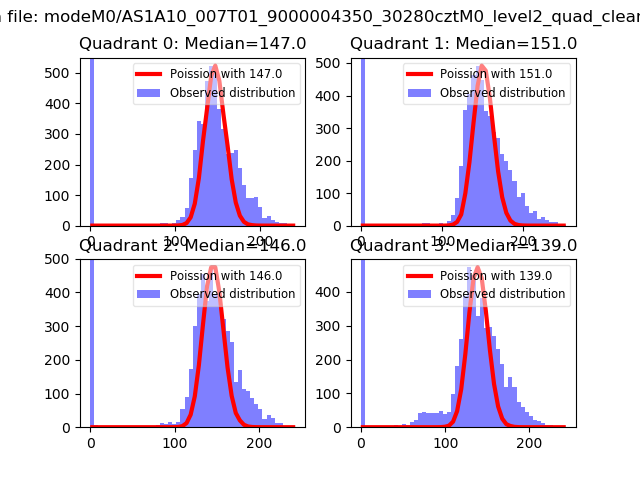 |
 |
| Quadrant-wise count rates Data is divided into 100 sec bins |
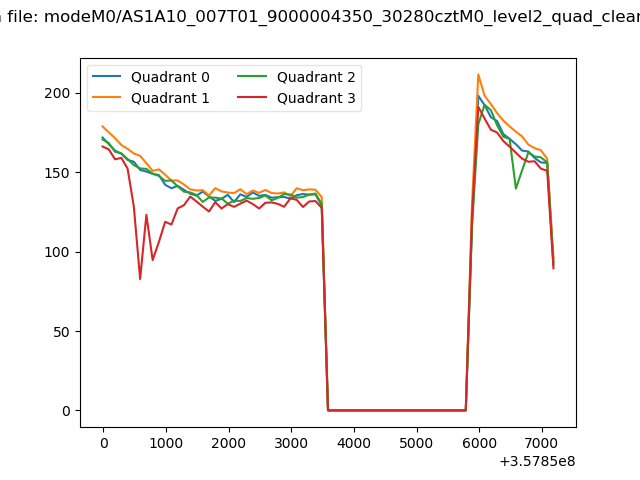 |
|
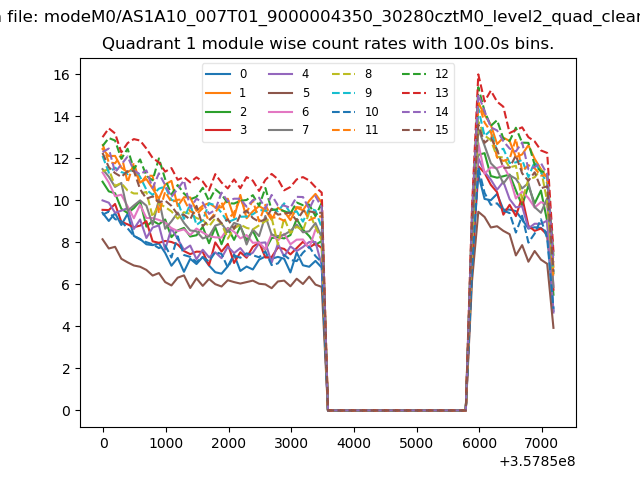
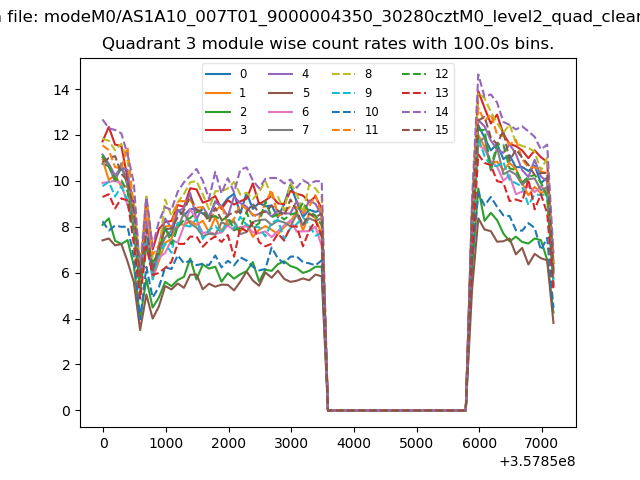
| Module-wise count rates for Quadrant A Data is divided into 100 sec bins |
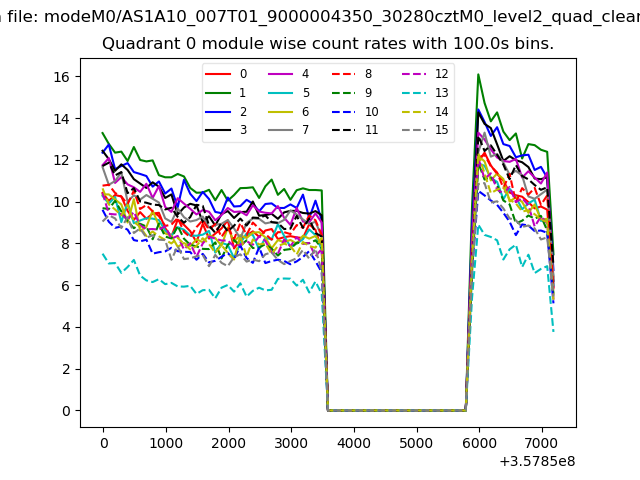 |
 |
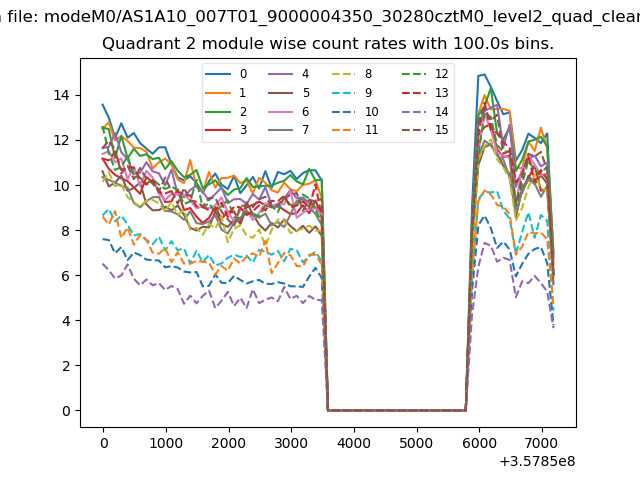
| Module-wise count rates for Quadrant B Data is divided into 100 sec bins |
 |
 |
| Module-wise count rates for Quadrant C Data is divided into 100 sec bins |
 |
 |
| Module-wise count rates for Quadrant D Data is divided into 100 sec bins |
 |
 |
| Parameter | Plot |
|---|---|
| CZT HV Monitor | 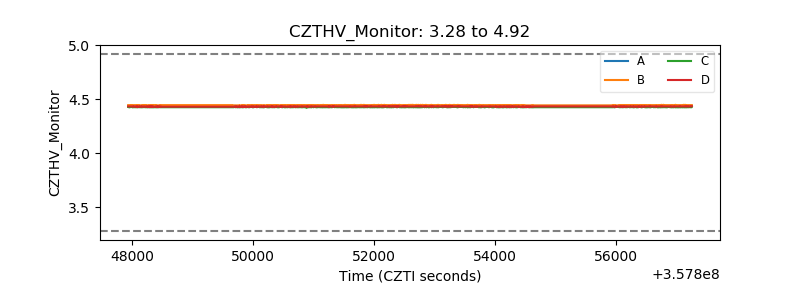 |
| D_VDD | 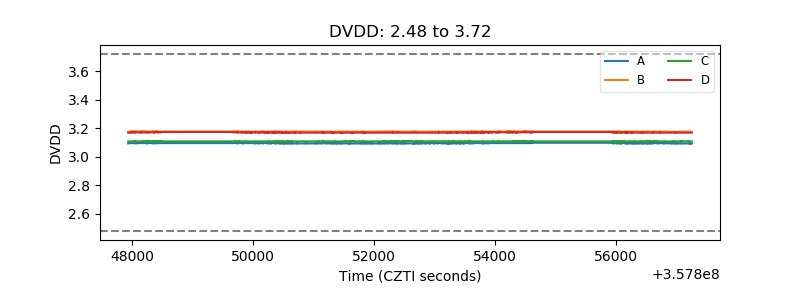 |
| Temperature 1 | 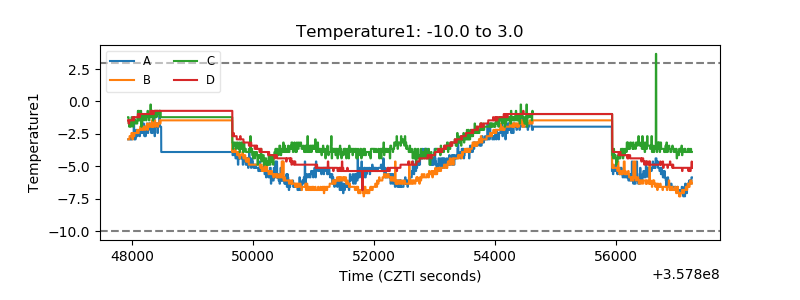 |
| Veto HV Monitor | 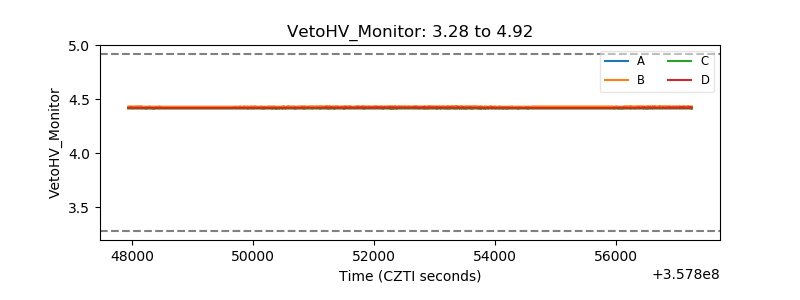 |
| Veto LLD | 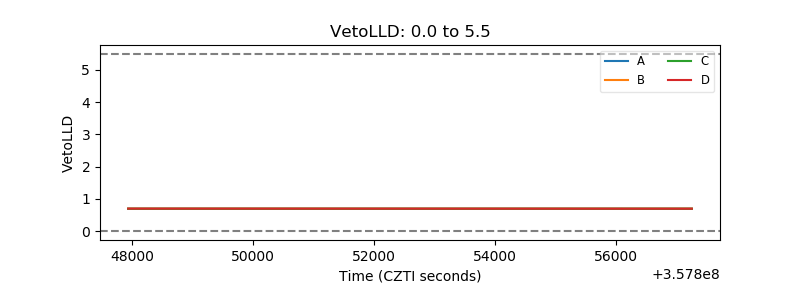 |
| Alpha Counter |  |
| _CPM_Rate | 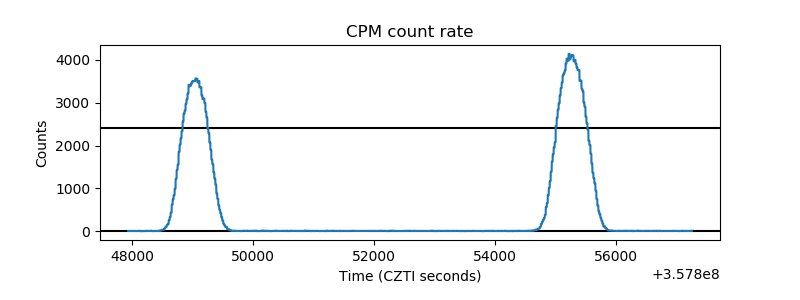 |
| CZT Counter | 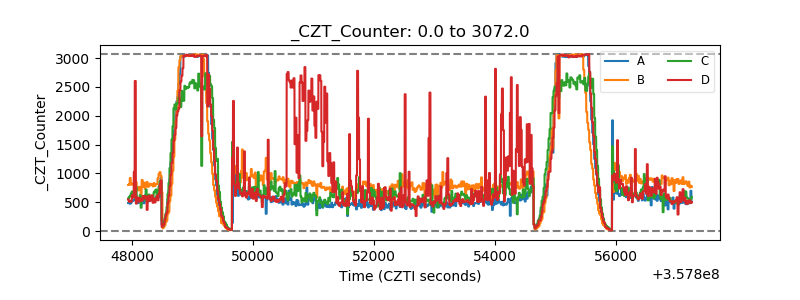 |
| +2.5 Volts monitor | 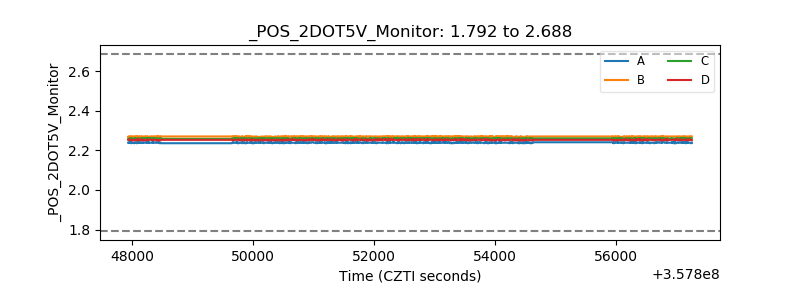 |
| +5 Volts monitor | 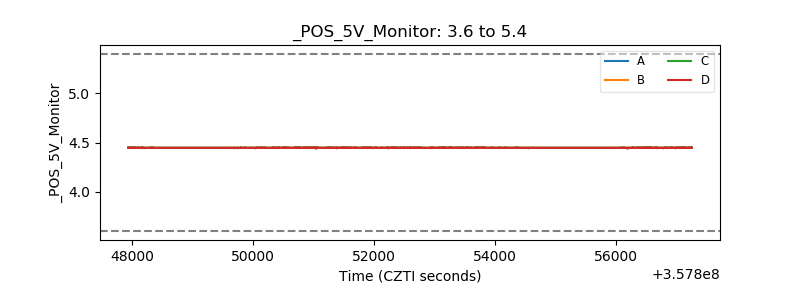 |
| _ROLL_ROT | 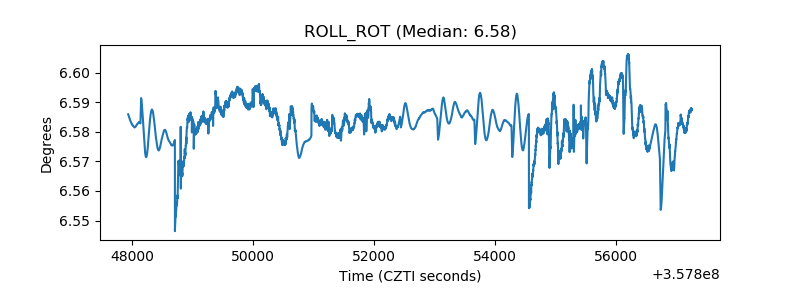 |
| _Roll_DEC | 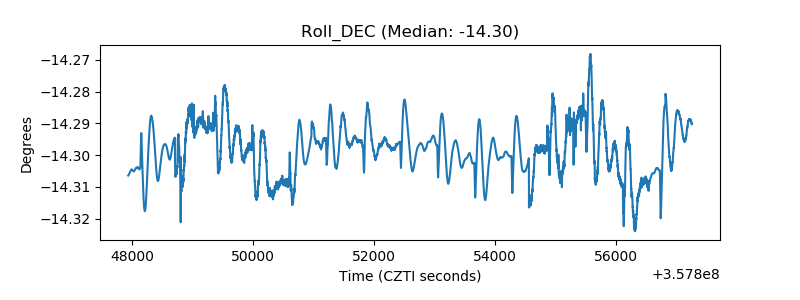 |
| _Roll_RA | 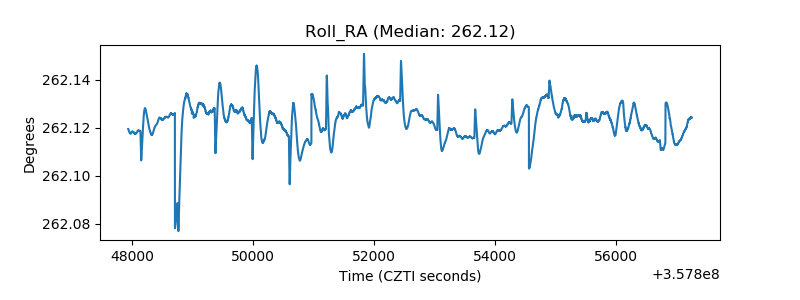 |
| Veto Counter | 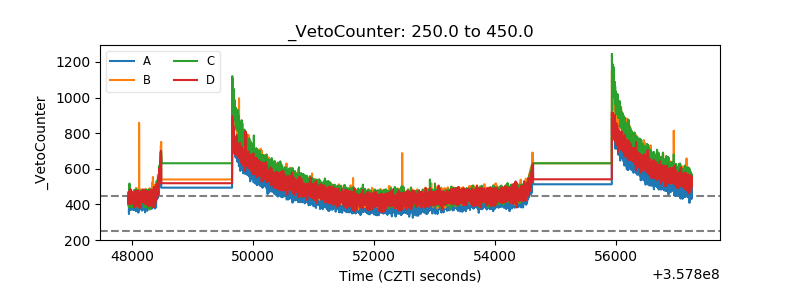 |