| Param | Original file | Final file |
|---|---|---|
| Filename | modeM0/AS1A10_007T01_9000004350_30282cztM0_level2.evt | modeM0/AS1A10_007T01_9000004350_30282cztM0_level2_quad_clean.evt |
| Size (bytes) | 627,880,320 | 116,769,600 |
| Size | 598.8 MB | 111.4 MB |
| Events in quadrant A | 3,683,214 | 765,808 |
| Events in quadrant B | 5,401,244 | 793,028 |
| Events in quadrant C | 3,865,058 | 773,151 |
| Events in quadrant D | 5,618,770 | 743,173 |
| Mode M9 | |||
|---|---|---|---|
| Quadrant | BADHDUFLAG | Total packets | Discarded packets |
| A | 0 | 21 | 0 |
| B | 0 | 22 | 0 |
| C | 0 | 22 | 0 |
| D | 0 | 22 | 0 |
| Mode SS | |||
|---|---|---|---|
| Quadrant | BADHDUFLAG | Total packets | Discarded packets |
| A | 0 | 132 | 0 |
| B | 0 | 132 | 0 |
| C | 0 | 132 | 0 |
| D | 0 | 132 | 0 |
| Mode M0 | |||
|---|---|---|---|
| Quadrant | BADHDUFLAG | Total packets | Discarded packets |
| A | 0 | 14957 | 2 |
| B | 0 | 20431 | 2 |
| C | 0 | 15617 | 2 |
| D | 0 | 21253 | 2 |
| Quadrant | Total seconds | Saturated seconds | Saturation percentage |
|---|---|---|---|
| A | 6628 | 89 | 1.342788% |
| B | 6628 | 122 | 1.840676% |
| C | 6628 | 143 | 2.157514% |
| D | 6628 | 228 | 3.439952% |
Noise dominated data is calculated using 1-second bins in cleaned event files. If a bin has >2000 counts, and if more than 50% of those come from <1% of pixels, then it is considered to be noise-dominated and hence unusable.
| Quadrant | # 1 sec bins | Bins with >0 counts | Bins with >2000 counts | High rate bins dominated by noise | Noise dominated (total time) | Noise dominated (detector-on time) | Marked lightcurve |
|---|---|---|---|---|---|---|---|
| A | 7983 | 6629 | 27 | 27 | 0.34% | 0.41% | 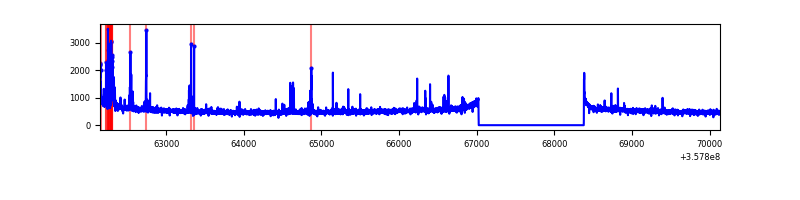 |
| B | 7983 | 6629 | 0 | 0 | 0.00% | 0.00% | 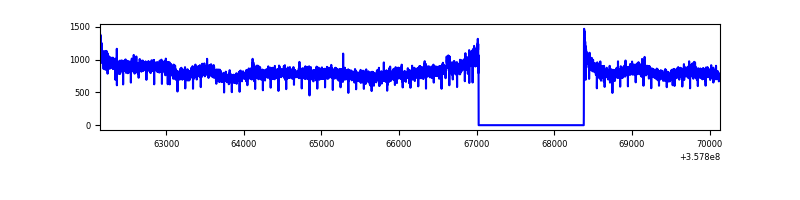 |
| C | 7983 | 6629 | 10 | 10 | 0.13% | 0.15% | 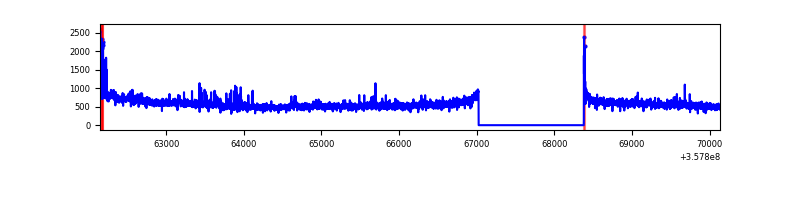 |
| D | 7983 | 6629 | 120 | 120 | 1.50% | 1.81% | 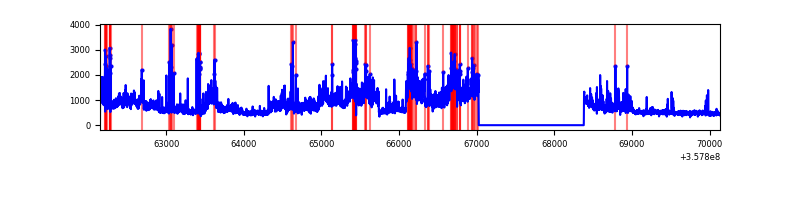 |
Top three noisy pixels from each quadrant. If the there are fewer than three noisy pixels in the level2.evt file, extra rows are filled as -1
| Pixel properties | Quadrant properties | ||||||
|---|---|---|---|---|---|---|---|
| Quadrant | DetID | PixID | Counts | Sigma | Mean | Median | Sigma |
| A | 0 | 13 | 226999 | 1285.08 | 890 | 874 | 176.0 |
| A | 8 | 192 | 21145 | 115.2 | 890 | 874 | 176.0 |
| A | 13 | 254 | 11831 | 62.27 | 890 | 874 | 176.0 |
| B | 6 | 159 | 1876158 | 11385.82 | 894 | 874 | 164.7 |
| B | 12 | 111 | 19897 | 115.5 | 894 | 874 | 164.7 |
| B | 11 | 111 | 18459 | 106.77 | 894 | 874 | 164.7 |
| C | 3 | 233 | 198486 | 976.28 | 877 | 888 | 202.4 |
| C | 14 | 238 | 160174 | 786.99 | 877 | 888 | 202.4 |
| C | 0 | 10 | 50504 | 245.14 | 877 | 888 | 202.4 |
| D | 8 | 195 | 1787931 | 8592.47 | 866 | 851 | 208.0 |
| D | 1 | 52 | 383452 | 1839.59 | 866 | 851 | 208.0 |
| D | 2 | 250 | 64260 | 304.88 | 866 | 851 | 208.0 |
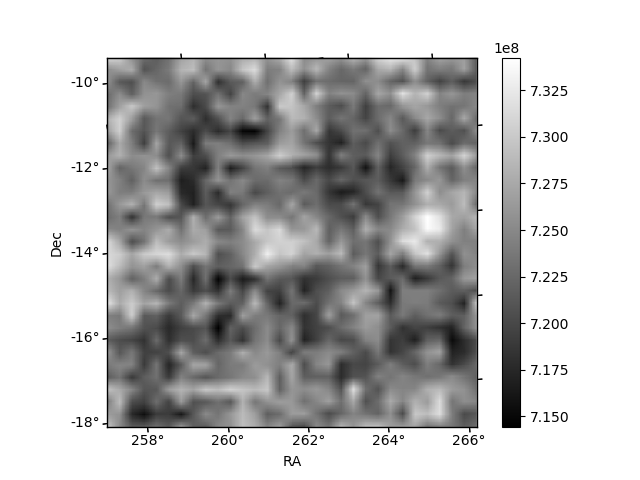
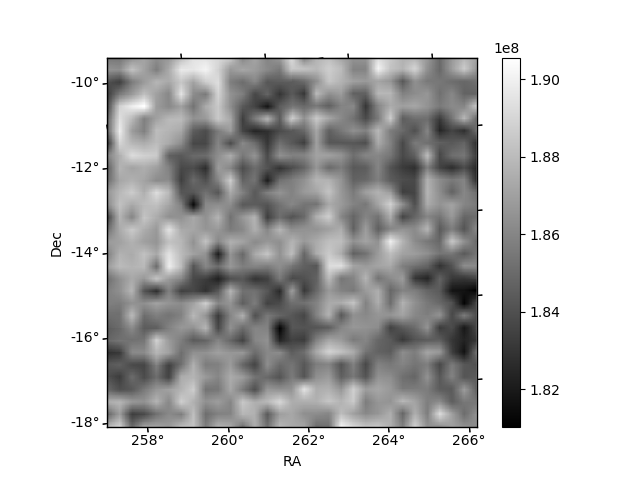
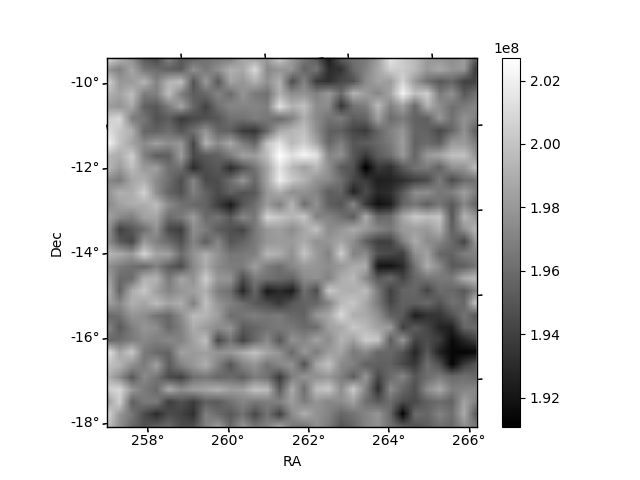
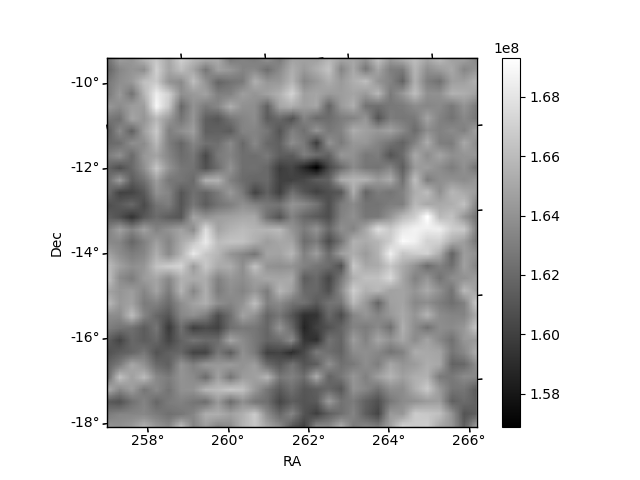
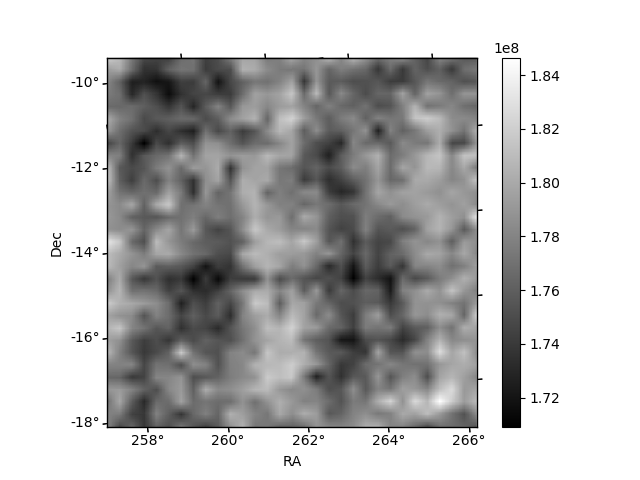
Histogram calculated using DETX and DETY for each event in the final _common_clean file
| Quadrant A | 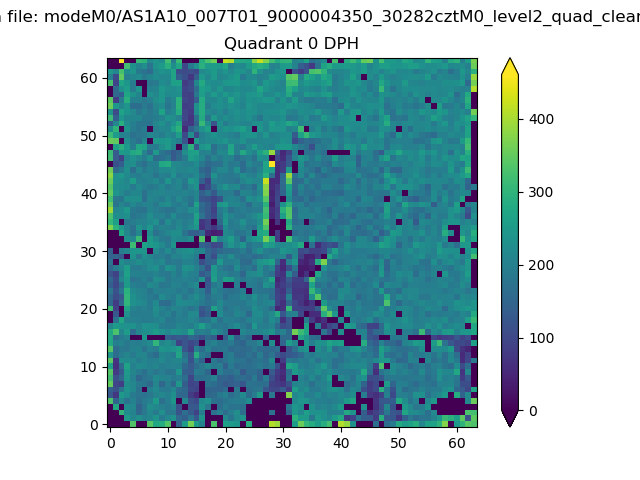 |
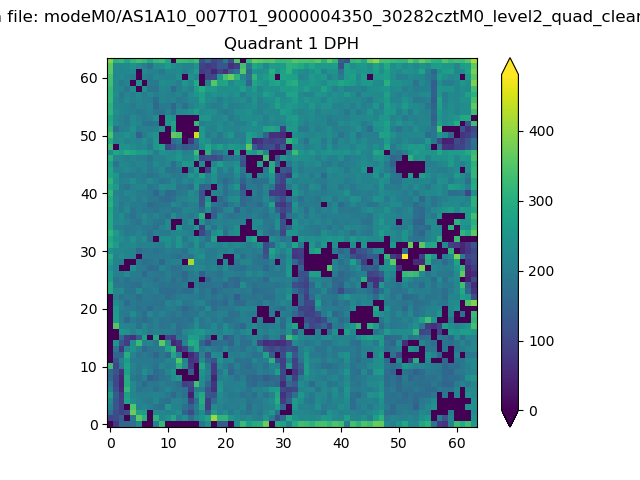 |
Quadrant B |
|---|---|---|---|
| Quadrant D | 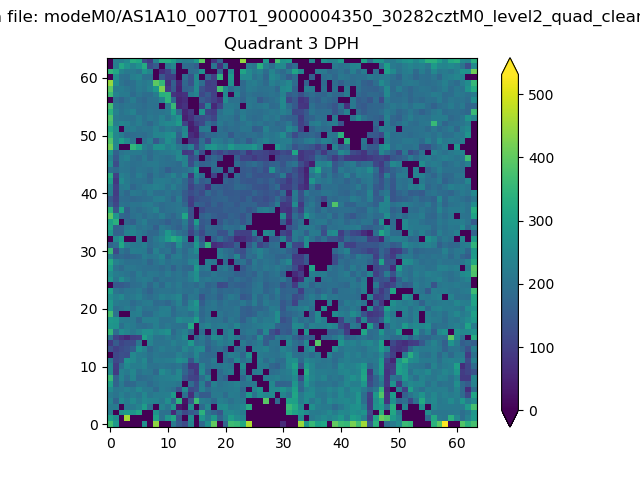 |
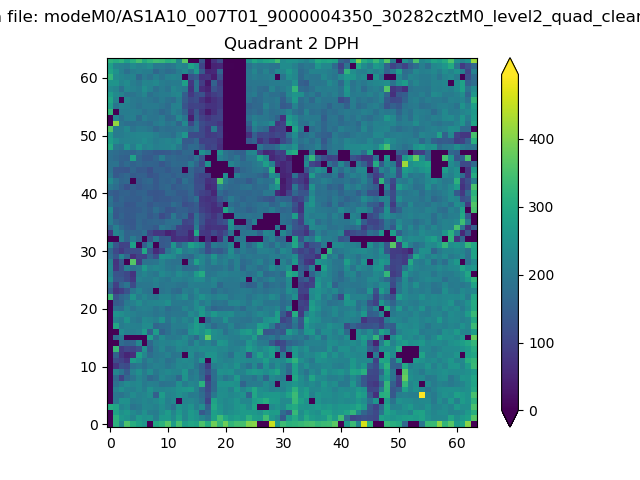 |
Quadrant C |
| Plot type | Count rate plots | Images |
|---|---|---|
| Comparison with Poisson distribution Blue bars denote a histogram of data divided into 1 sec bins. Red curve is a Poisson curve with rate = median count rate of data. |
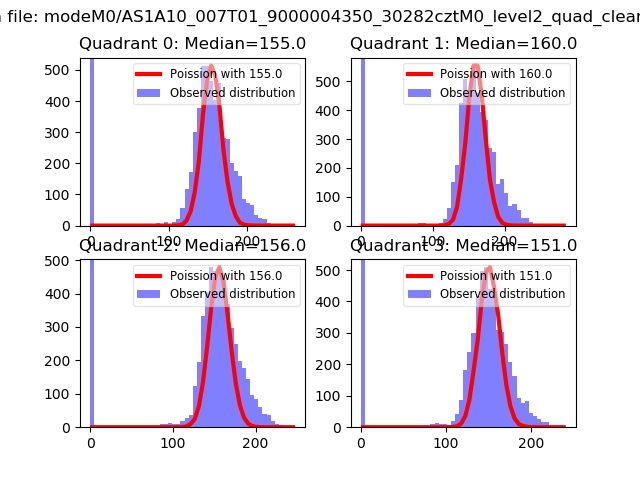 |
 |
| Quadrant-wise count rates Data is divided into 100 sec bins |
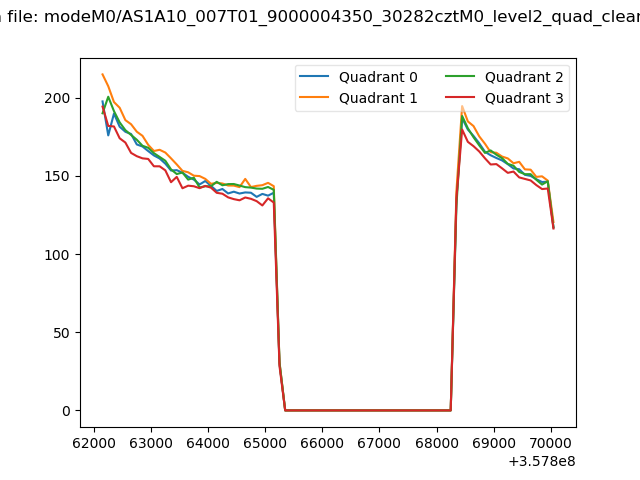 |
|
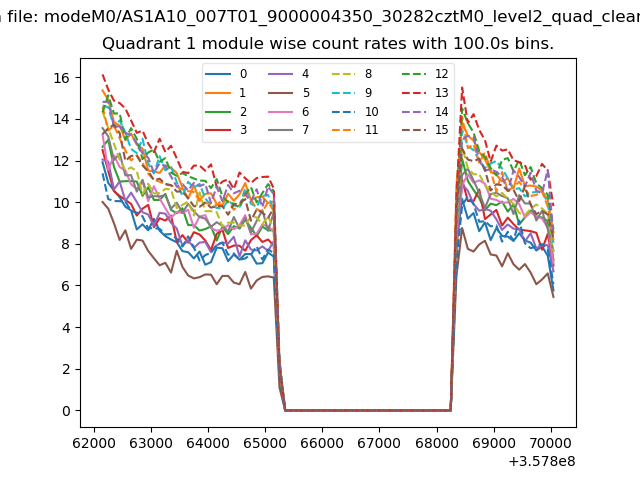
| Module-wise count rates for Quadrant A Data is divided into 100 sec bins |
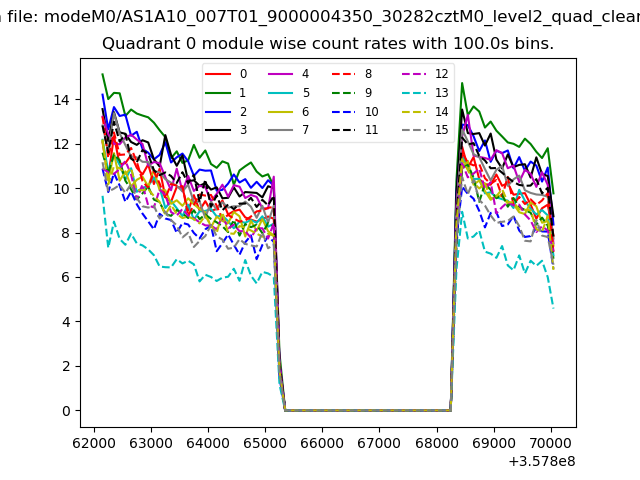 |
 |
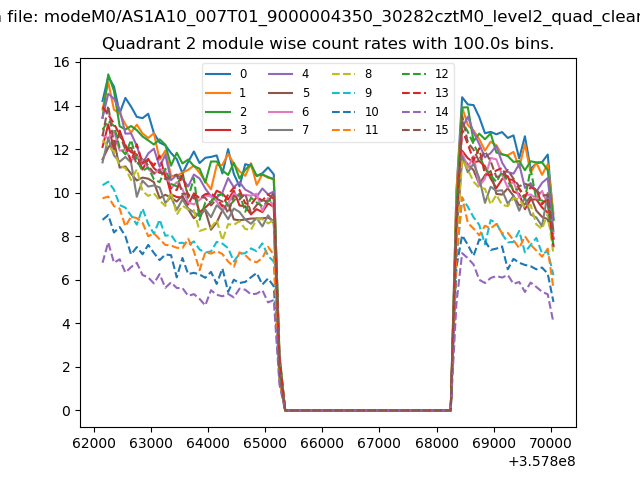
| Module-wise count rates for Quadrant B Data is divided into 100 sec bins |
 |
 |
| Module-wise count rates for Quadrant C Data is divided into 100 sec bins |
 |
 |
| Module-wise count rates for Quadrant D Data is divided into 100 sec bins |
 |
 |
| Parameter | Plot |
|---|---|
| CZT HV Monitor | 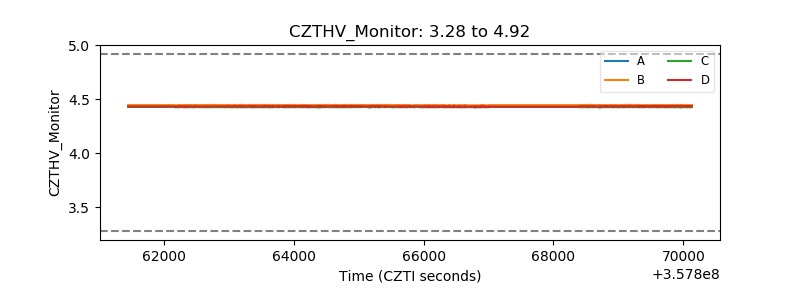 |
| D_VDD | 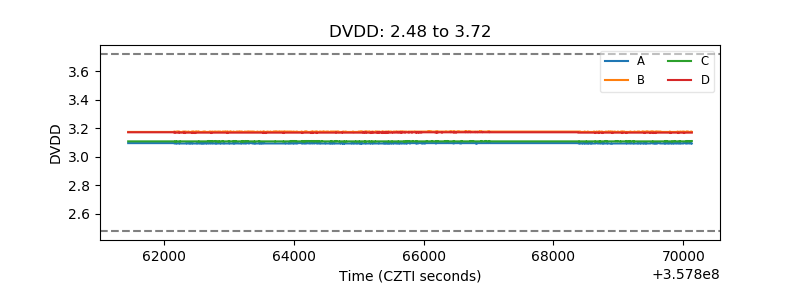 |
| Temperature 1 | 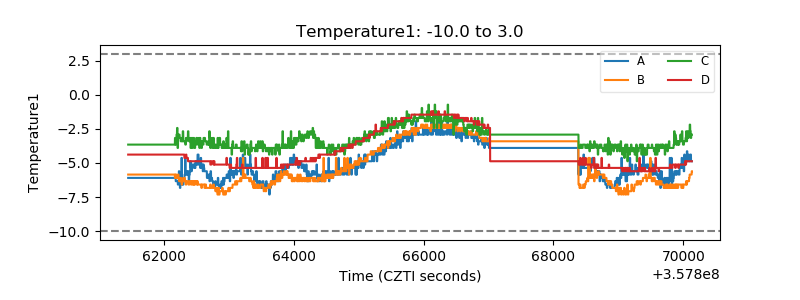 |
| Veto HV Monitor | 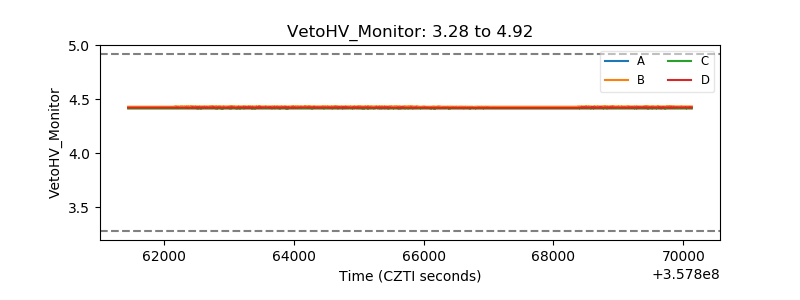 |
| Veto LLD | 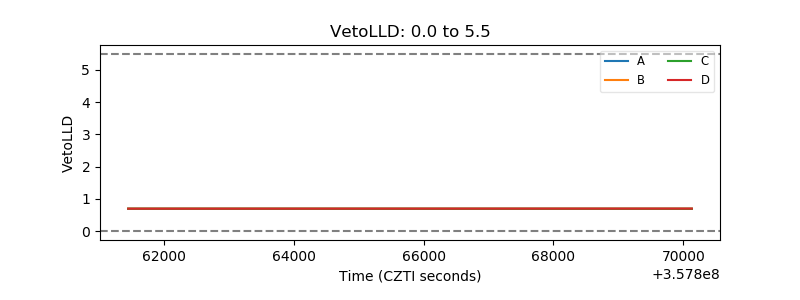 |
| Alpha Counter |  |
| _CPM_Rate | 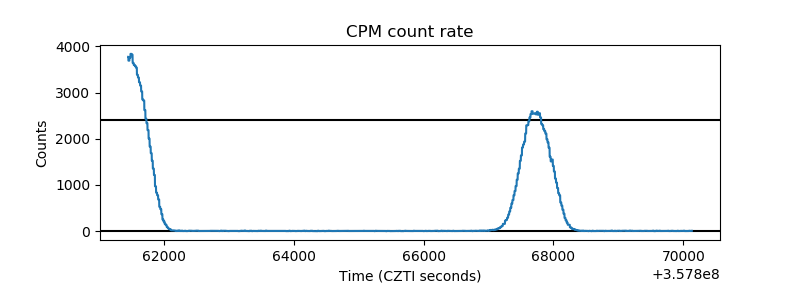 |
| CZT Counter | 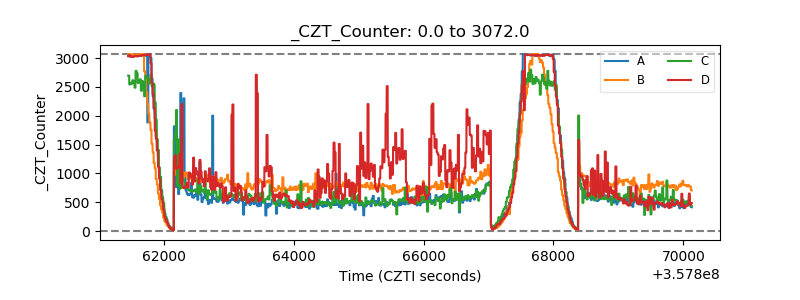 |
| +2.5 Volts monitor | 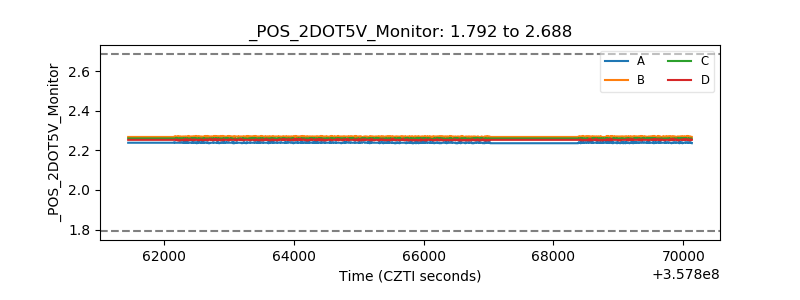 |
| +5 Volts monitor |  |
| _ROLL_ROT | 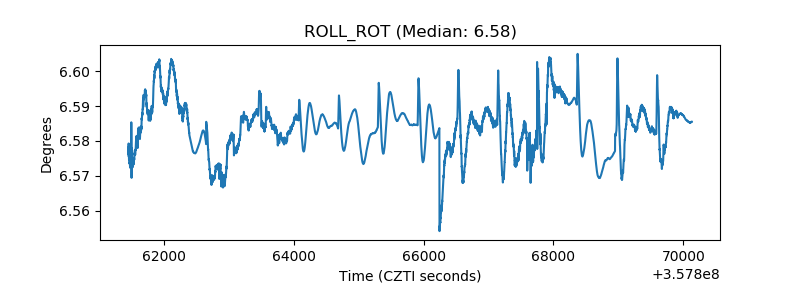 |
| _Roll_DEC | 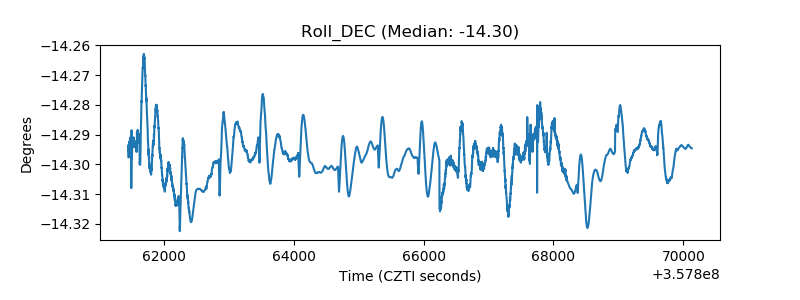 |
| _Roll_RA | 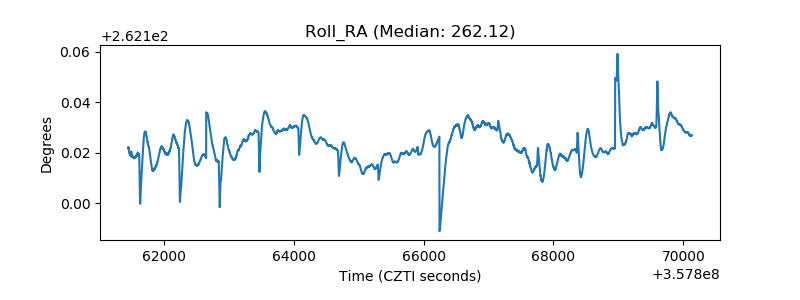 |
| Veto Counter | 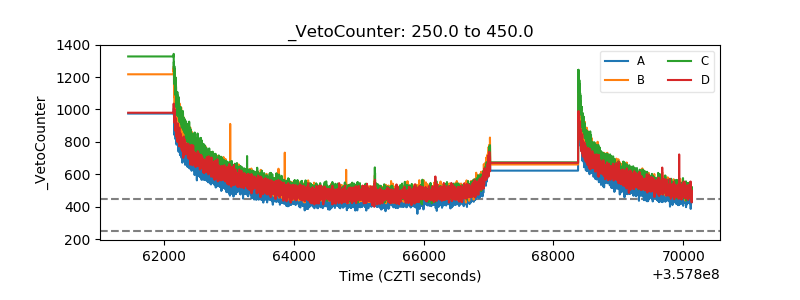 |