| Param | Original file | Final file |
|---|---|---|
| Filename | modeM0/AS1A10_007T01_9000004350_30283cztM0_level2.evt | modeM0/AS1A10_007T01_9000004350_30283cztM0_level2_quad_clean.evt |
| Size (bytes) | 510,984,000 | 90,745,920 |
| Size | 487.3 MB | 86.5 MB |
| Events in quadrant A | 3,267,940 | 579,527 |
| Events in quadrant B | 4,892,114 | 592,542 |
| Events in quadrant C | 3,398,025 | 582,652 |
| Events in quadrant D | 3,504,966 | 568,602 |
| Mode M9 | |||
|---|---|---|---|
| Quadrant | BADHDUFLAG | Total packets | Discarded packets |
| A | 0 | 13 | 0 |
| B | 0 | 13 | 0 |
| C | 0 | 13 | 0 |
| D | 0 | 13 | 0 |
| Mode SS | |||
|---|---|---|---|
| Quadrant | BADHDUFLAG | Total packets | Discarded packets |
| A | 0 | 124 | 0 |
| B | 0 | 124 | 0 |
| C | 0 | 124 | 0 |
| D | 0 | 124 | 0 |
| Mode M0 | |||
|---|---|---|---|
| Quadrant | BADHDUFLAG | Total packets | Discarded packets |
| A | 0 | 13332 | 1 |
| B | 0 | 18777 | 1 |
| C | 0 | 13784 | 1 |
| D | 0 | 14409 | 1 |
| Quadrant | Total seconds | Saturated seconds | Saturation percentage |
|---|---|---|---|
| A | 6081 | 104 | 1.710245% |
| B | 6082 | 156 | 2.564946% |
| C | 6082 | 87 | 1.430451% |
| D | 6082 | 27 | 0.443933% |
Noise dominated data is calculated using 1-second bins in cleaned event files. If a bin has >2000 counts, and if more than 50% of those come from <1% of pixels, then it is considered to be noise-dominated and hence unusable.
| Quadrant | # 1 sec bins | Bins with >0 counts | Bins with >2000 counts | High rate bins dominated by noise | Noise dominated (total time) | Noise dominated (detector-on time) | Marked lightcurve |
|---|---|---|---|---|---|---|---|
| A | 7361 | 6082 | 45 | 45 | 0.61% | 0.74% | 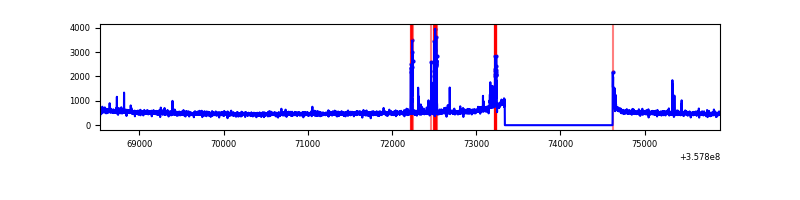 |
| B | 7362 | 6083 | 11 | 11 | 0.15% | 0.18% | 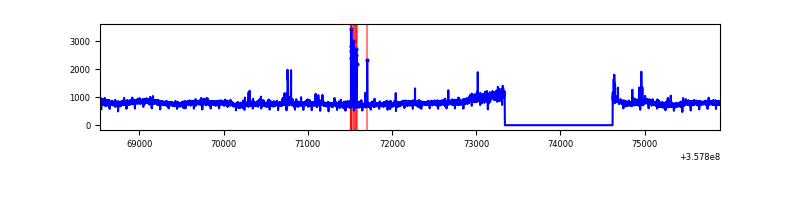 |
| C | 7362 | 6083 | 1 | 1 | 0.01% | 0.02% | 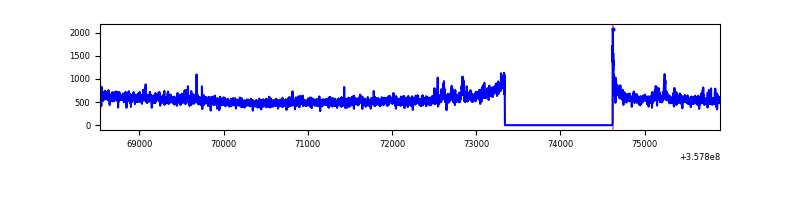 |
| D | 7362 | 6083 | 13 | 13 | 0.18% | 0.21% | 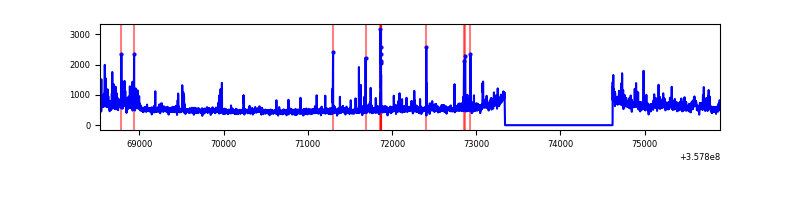 |
Top three noisy pixels from each quadrant. If the there are fewer than three noisy pixels in the level2.evt file, extra rows are filled as -1
| Pixel properties | Quadrant properties | ||||||
|---|---|---|---|---|---|---|---|
| Quadrant | DetID | PixID | Counts | Sigma | Mean | Median | Sigma |
| A | 0 | 13 | 189343 | 1189.11 | 795 | 781 | 158.6 |
| A | 8 | 192 | 11226 | 65.87 | 795 | 781 | 158.6 |
| A | 13 | 254 | 10481 | 61.17 | 795 | 781 | 158.6 |
| B | 6 | 159 | 1641294 | 10983.15 | 795 | 776 | 149.4 |
| B | 0 | 229 | 85814 | 569.32 | 795 | 776 | 149.4 |
| B | 6 | 36 | 41753 | 274.34 | 795 | 776 | 149.4 |
| C | 3 | 233 | 204277 | 1110.3 | 782 | 789 | 183.3 |
| C | 14 | 238 | 127637 | 692.13 | 782 | 789 | 183.3 |
| C | 2 | 114 | 14437 | 74.47 | 782 | 789 | 183.3 |
| D | 8 | 195 | 288539 | 1520.52 | 784 | 769 | 189.3 |
| D | 13 | 104 | 69860 | 365.06 | 784 | 769 | 189.3 |
| D | 5 | 222 | 61889 | 322.94 | 784 | 769 | 189.3 |
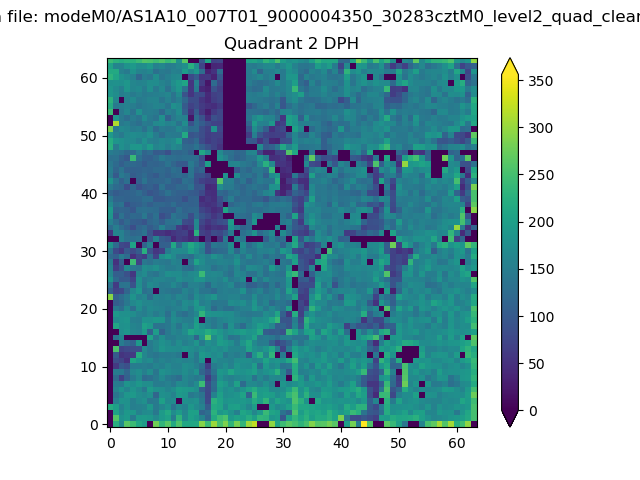
Histogram calculated using DETX and DETY for each event in the final _common_clean file
| Quadrant A | 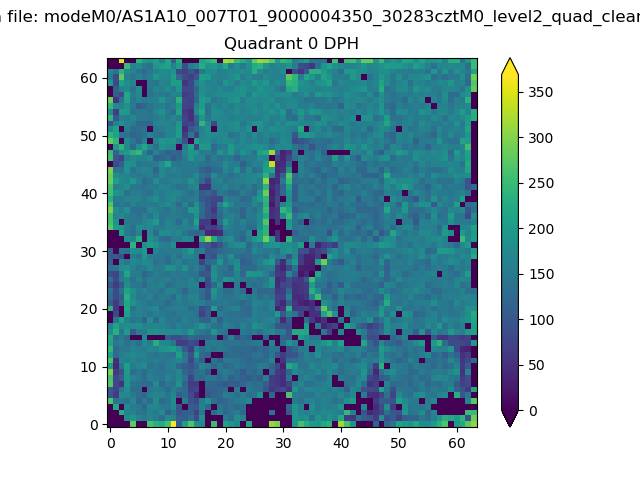 |
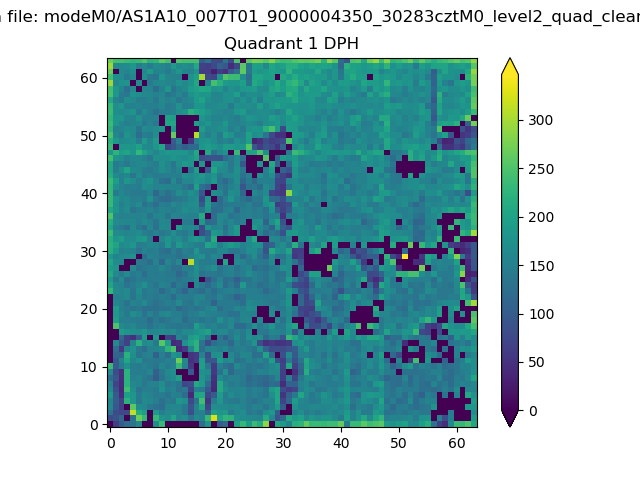 |
Quadrant B |
|---|---|---|---|
| Quadrant D | 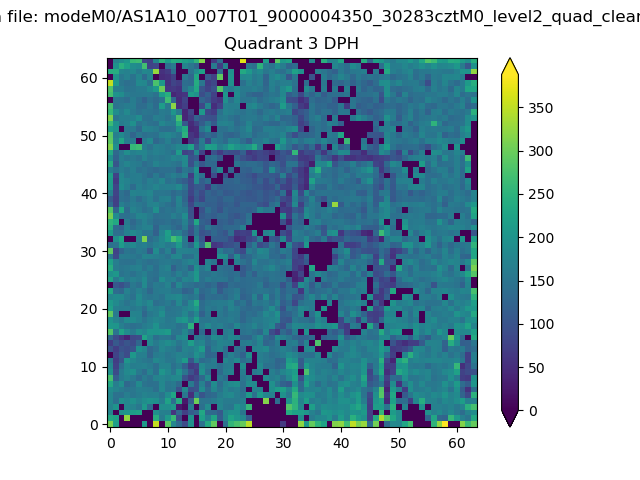 |
 |
Quadrant C |
| Plot type | Count rate plots | Images |
|---|---|---|
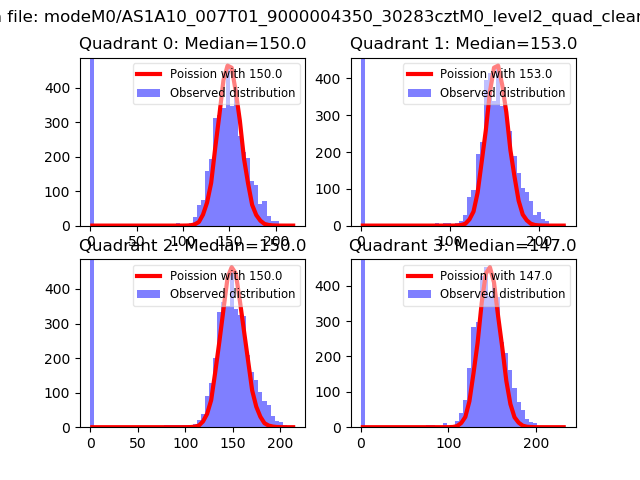
| Comparison with Poisson distribution Blue bars denote a histogram of data divided into 1 sec bins. Red curve is a Poisson curve with rate = median count rate of data. |
 |
 |
| Quadrant-wise count rates Data is divided into 100 sec bins |
 |
|
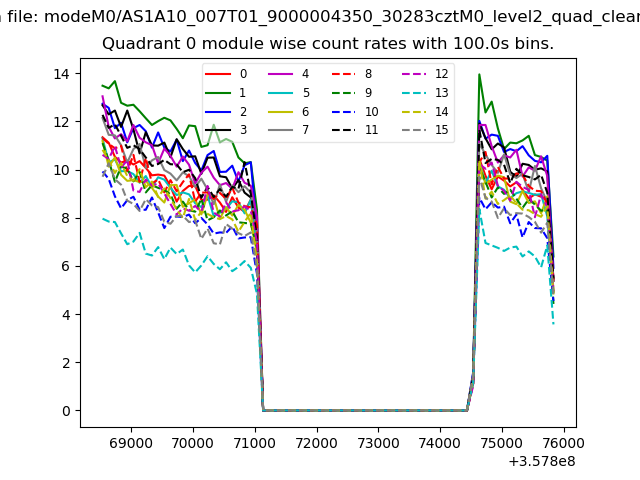
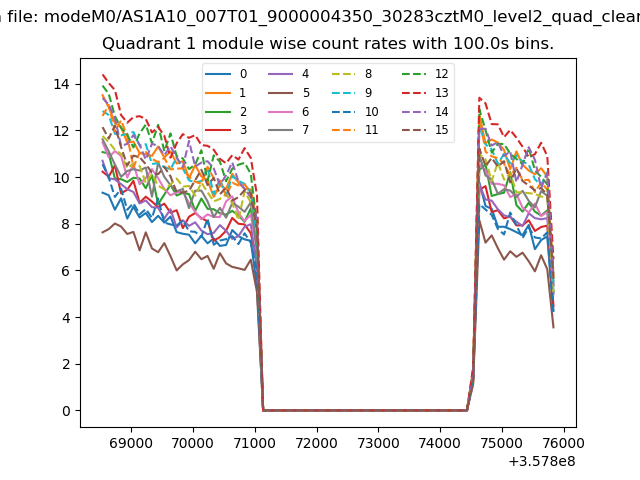
| Module-wise count rates for Quadrant A Data is divided into 100 sec bins |
 |
 |
| Module-wise count rates for Quadrant B Data is divided into 100 sec bins |
 |
 |
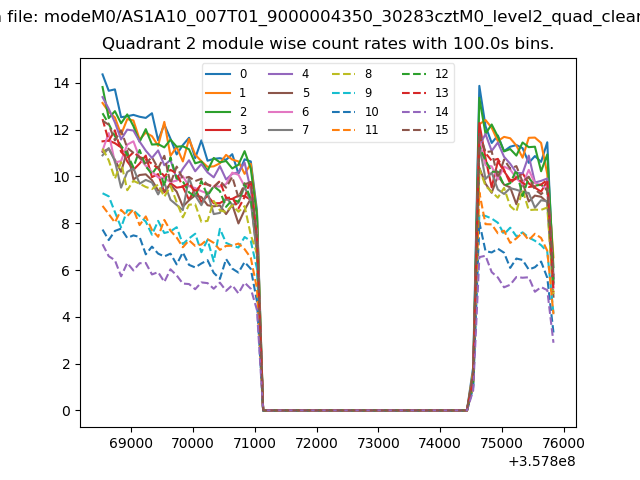
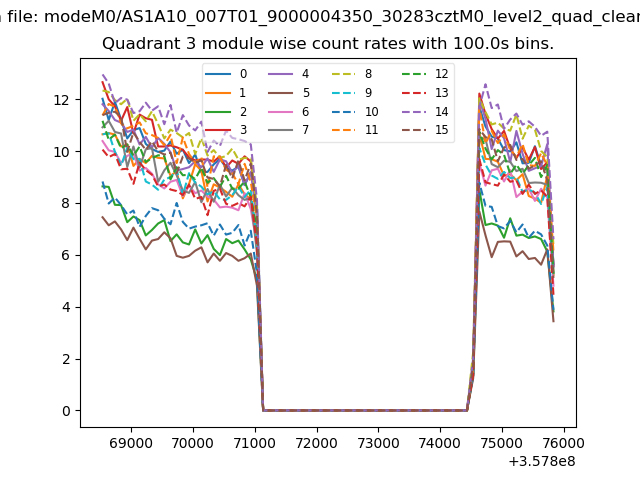
| Module-wise count rates for Quadrant C Data is divided into 100 sec bins |
 |
 |
| Module-wise count rates for Quadrant D Data is divided into 100 sec bins |
 |
 |
| Parameter | Plot |
|---|---|
| CZT HV Monitor | 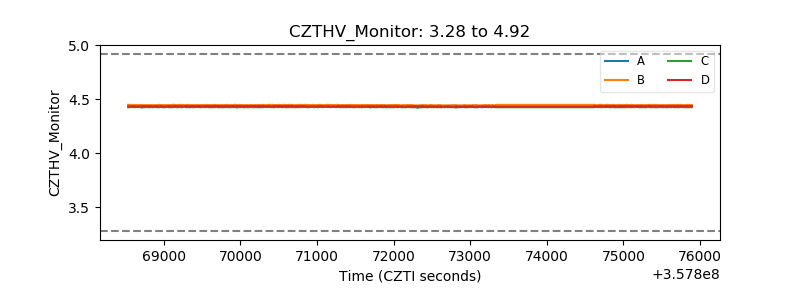 |
| D_VDD |  |
| Temperature 1 | 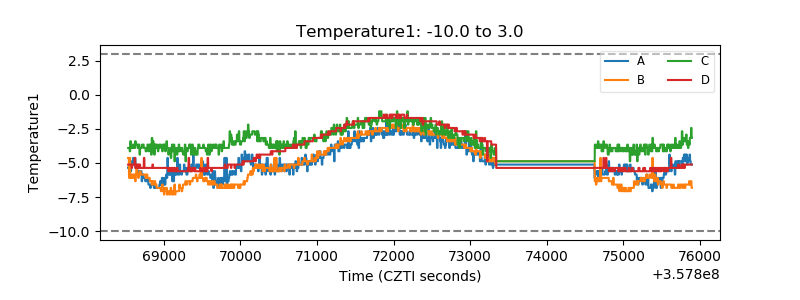 |
| Veto HV Monitor | 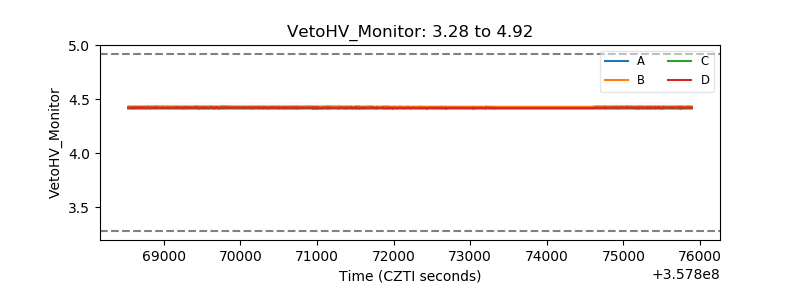 |
| Veto LLD | 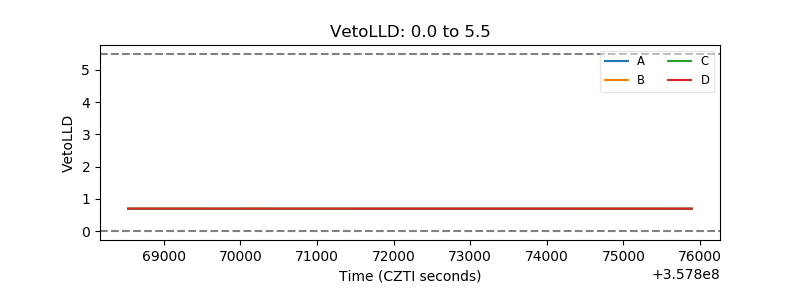 |
| Alpha Counter |  |
| _CPM_Rate | 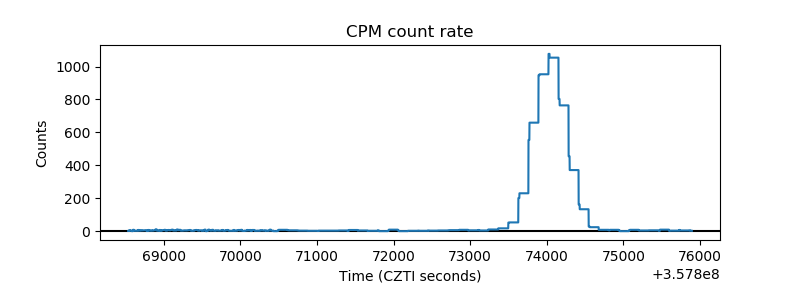 |
| CZT Counter | 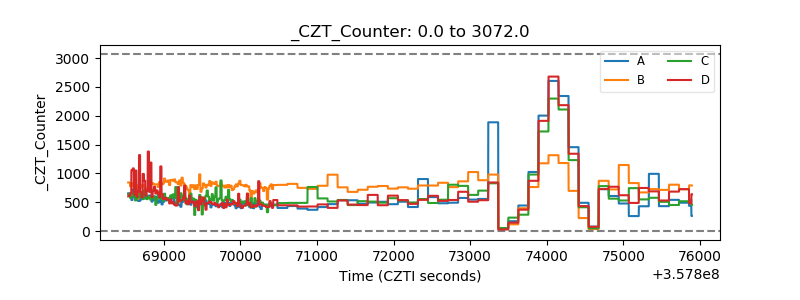 |
| +2.5 Volts monitor |  |
| +5 Volts monitor |  |
| _ROLL_ROT | 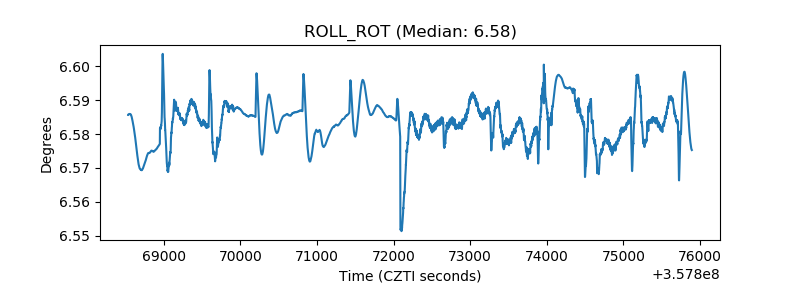 |
| _Roll_DEC | 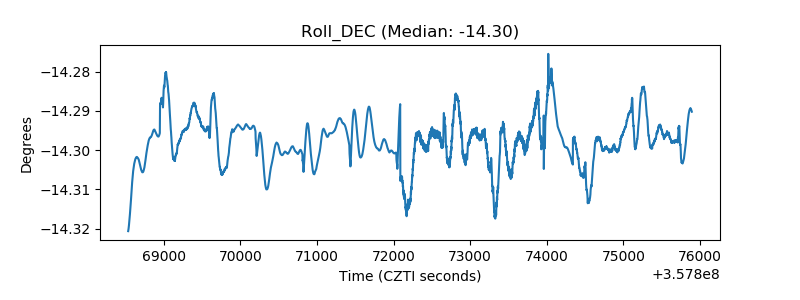 |
| _Roll_RA |  |
| Veto Counter | 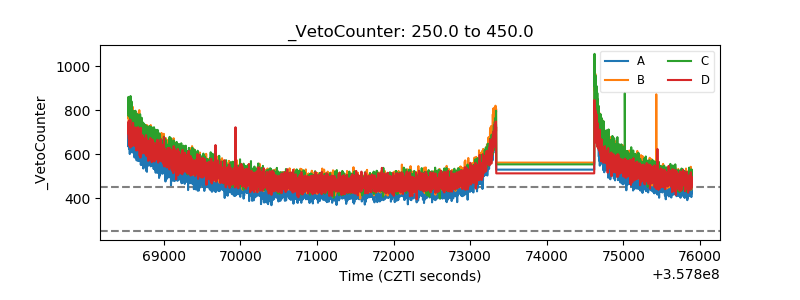 |