| Param | Original file | Final file |
|---|---|---|
| Filename | modeM0/AS1A10_007T01_9000004350_30284cztM0_level2.evt | modeM0/AS1A10_007T01_9000004350_30284cztM0_level2_quad_clean.evt |
| Size (bytes) | 646,704,000 | 103,976,640 |
| Size | 616.7 MB | 99.2 MB |
| Events in quadrant A | 3,696,805 | 672,146 |
| Events in quadrant B | 5,589,672 | 684,119 |
| Events in quadrant C | 4,058,512 | 666,733 |
| Events in quadrant D | 5,763,509 | 634,317 |
| Mode M9 | |||
|---|---|---|---|
| Quadrant | BADHDUFLAG | Total packets | Discarded packets |
| A | 0 | 23 | 0 |
| B | 0 | 23 | 0 |
| C | 0 | 23 | 0 |
| D | 0 | 23 | 0 |
| Mode SS | |||
|---|---|---|---|
| Quadrant | BADHDUFLAG | Total packets | Discarded packets |
| A | 0 | 146 | 0 |
| B | 0 | 146 | 0 |
| C | 0 | 146 | 0 |
| D | 0 | 146 | 0 |
| Mode M0 | |||
|---|---|---|---|
| Quadrant | BADHDUFLAG | Total packets | Discarded packets |
| A | 0 | 15285 | 3 |
| B | 0 | 21792 | 2 |
| C | 0 | 16347 | 2 |
| D | 0 | 22044 | 2 |
| Quadrant | Total seconds | Saturated seconds | Saturation percentage |
|---|---|---|---|
| A | 7059 | 122 | 1.728290% |
| B | 7059 | 191 | 2.705766% |
| C | 7060 | 272 | 3.852691% |
| D | 7060 | 444 | 6.288952% |
Noise dominated data is calculated using 1-second bins in cleaned event files. If a bin has >2000 counts, and if more than 50% of those come from <1% of pixels, then it is considered to be noise-dominated and hence unusable.
| Quadrant | # 1 sec bins | Bins with >0 counts | Bins with >2000 counts | High rate bins dominated by noise | Noise dominated (total time) | Noise dominated (detector-on time) | Marked lightcurve |
|---|---|---|---|---|---|---|---|
| A | 9294 | 7062 | 19 | 19 | 0.20% | 0.27% | 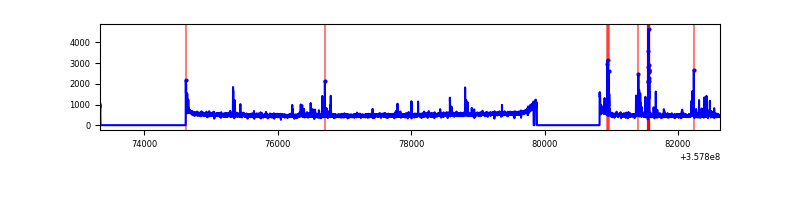 |
| B | 9294 | 7062 | 9 | 9 | 0.10% | 0.13% | 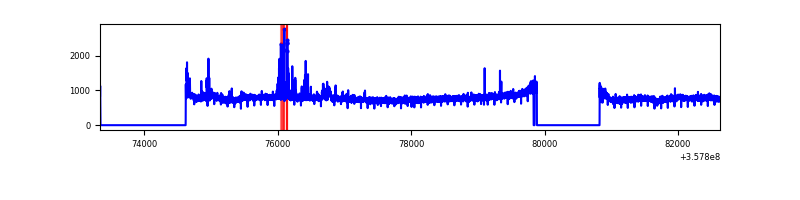 |
| C | 9295 | 7062 | 8 | 8 | 0.09% | 0.11% | 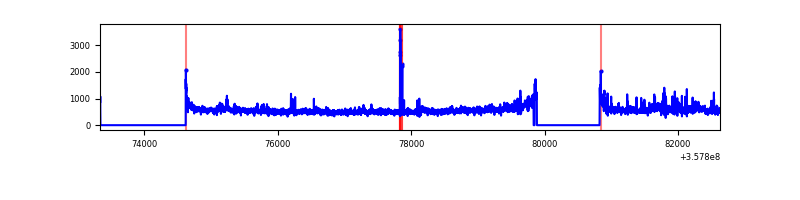 |
| D | 9295 | 7061 | 294 | 294 | 3.16% | 4.16% | 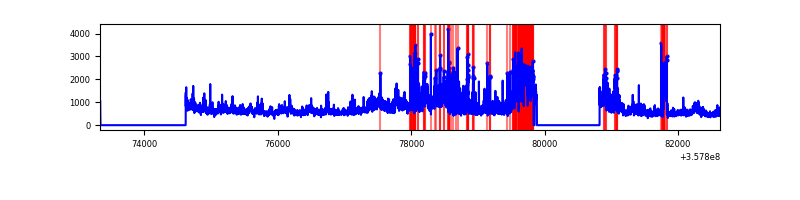 |
Top three noisy pixels from each quadrant. If the there are fewer than three noisy pixels in the level2.evt file, extra rows are filled as -1
| Pixel properties | Quadrant properties | ||||||
|---|---|---|---|---|---|---|---|
| Quadrant | DetID | PixID | Counts | Sigma | Mean | Median | Sigma |
| A | 0 | 13 | 195200 | 1075.06 | 902 | 884 | 180.7 |
| A | 8 | 192 | 21644 | 114.86 | 902 | 884 | 180.7 |
| A | 13 | 254 | 11902 | 60.96 | 902 | 884 | 180.7 |
| B | 6 | 159 | 1943519 | 11280.99 | 891 | 867 | 172.2 |
| B | 0 | 229 | 74359 | 426.77 | 891 | 867 | 172.2 |
| B | 4 | 173 | 66548 | 381.41 | 891 | 867 | 172.2 |
| C | 3 | 233 | 407234 | 1987.76 | 871 | 879 | 204.4 |
| C | 14 | 238 | 168271 | 818.83 | 871 | 879 | 204.4 |
| C | 14 | 254 | 40208 | 192.38 | 871 | 879 | 204.4 |
| D | 8 | 195 | 1039239 | 5009.03 | 858 | 839 | 207.3 |
| D | 1 | 52 | 895228 | 4314.35 | 858 | 839 | 207.3 |
| D | 2 | 250 | 526838 | 2537.31 | 858 | 839 | 207.3 |
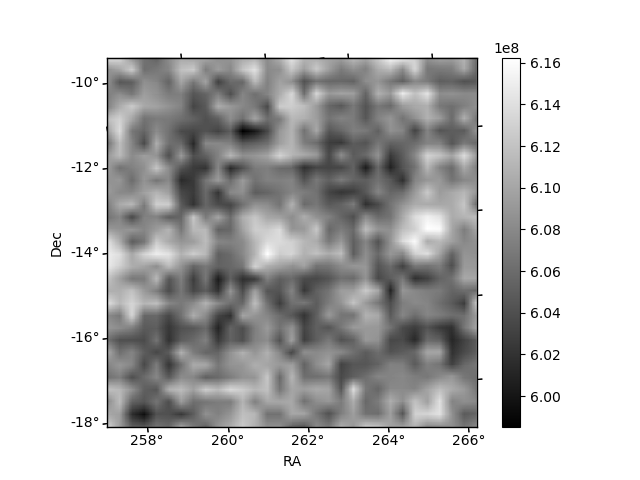
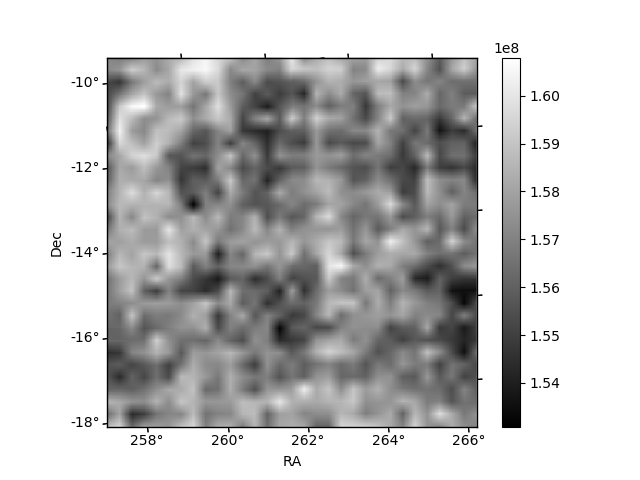
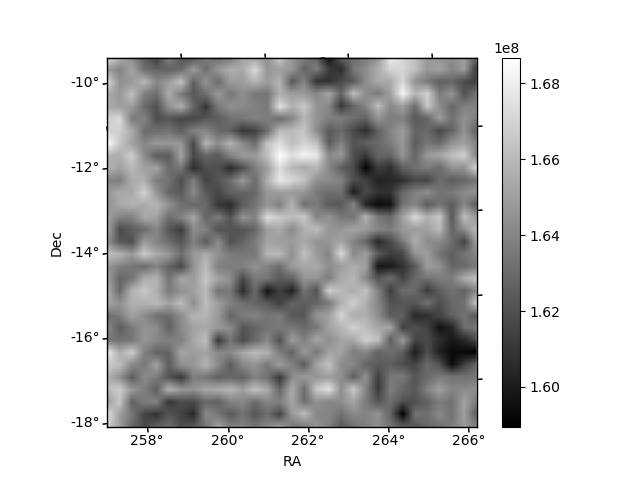
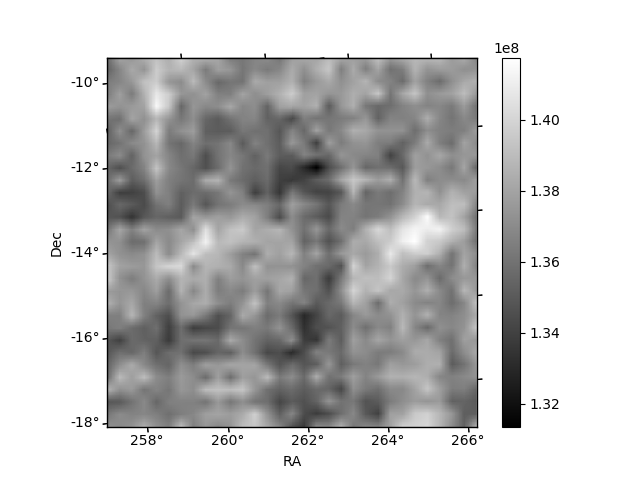
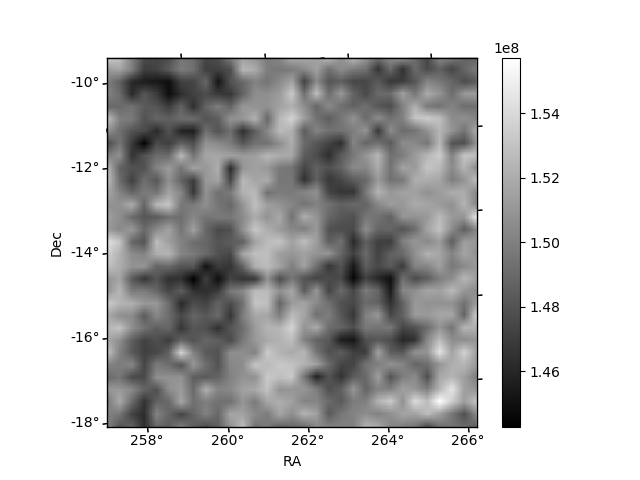
Histogram calculated using DETX and DETY for each event in the final _common_clean file
| Quadrant A | 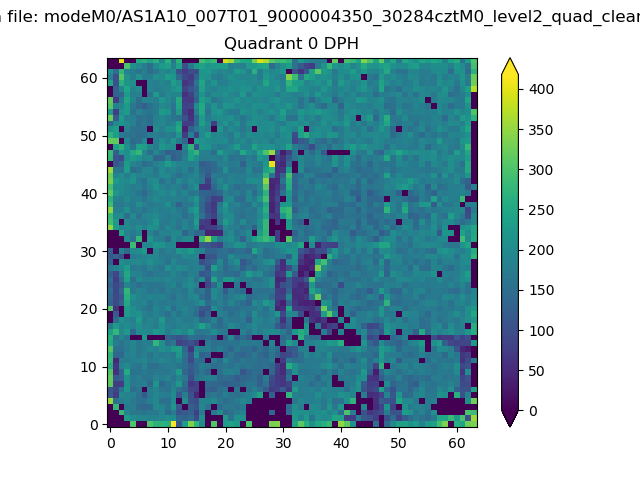 |
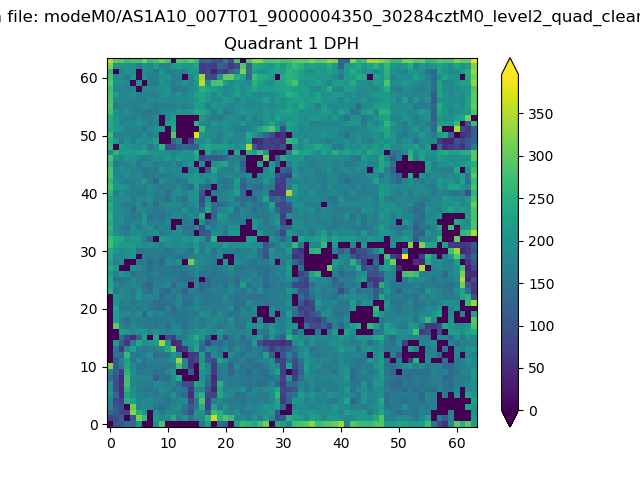 |
Quadrant B |
|---|---|---|---|
| Quadrant D | 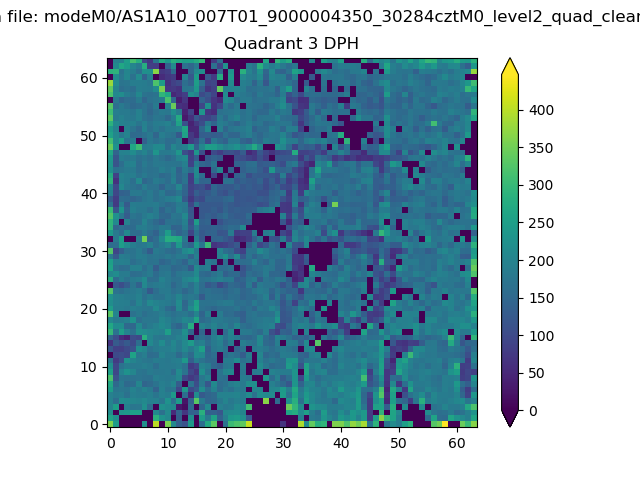 |
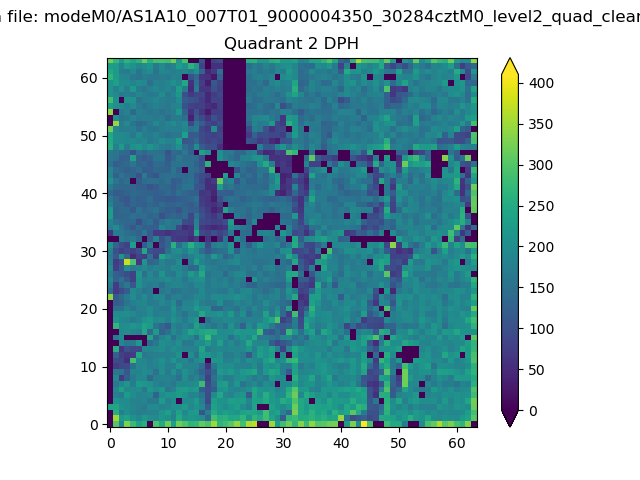 |
Quadrant C |
| Plot type | Count rate plots | Images |
|---|---|---|
| Comparison with Poisson distribution Blue bars denote a histogram of data divided into 1 sec bins. Red curve is a Poisson curve with rate = median count rate of data. |
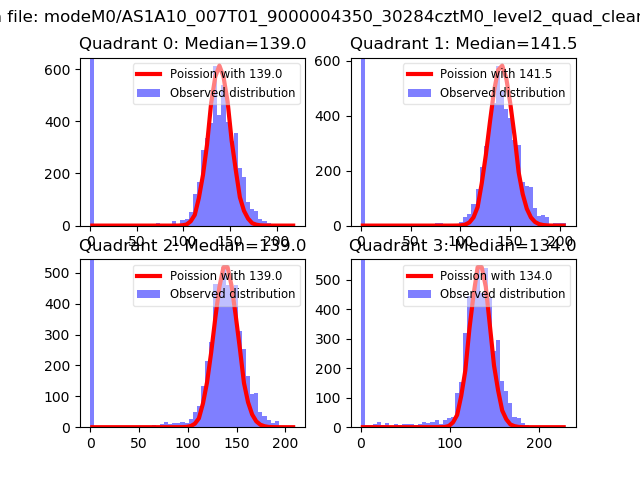 |
 |
| Quadrant-wise count rates Data is divided into 100 sec bins |
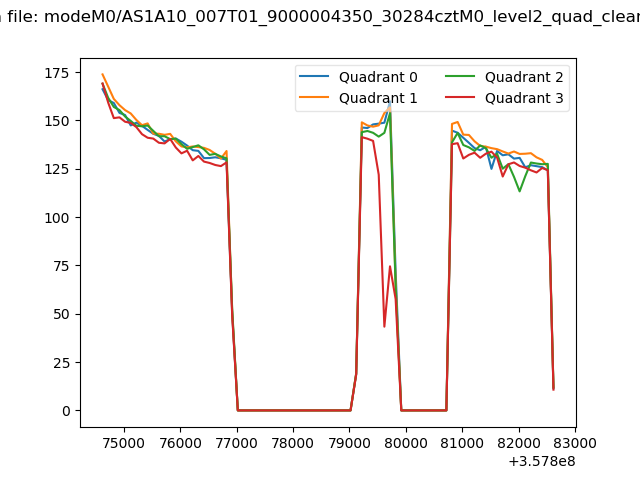 |
|
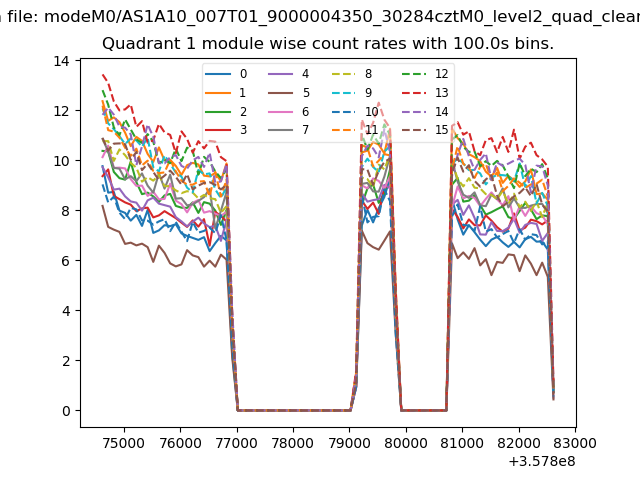
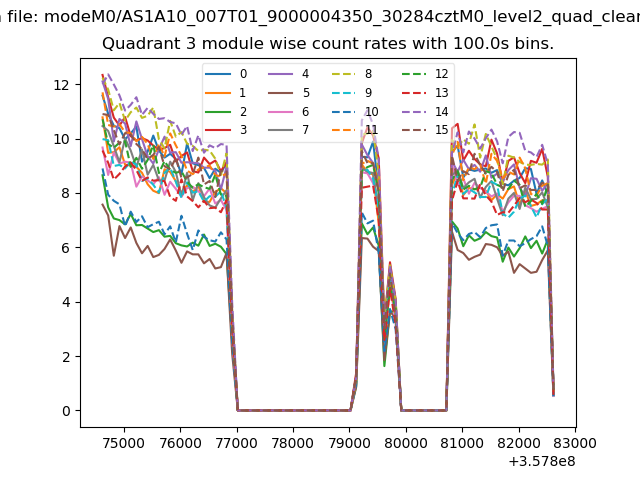
| Module-wise count rates for Quadrant A Data is divided into 100 sec bins |
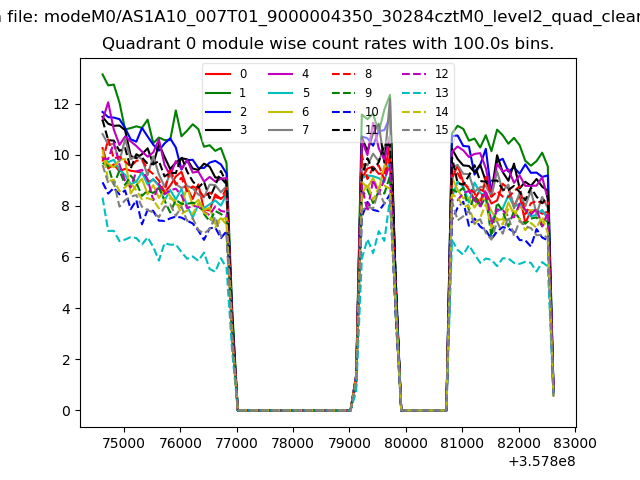 |
 |
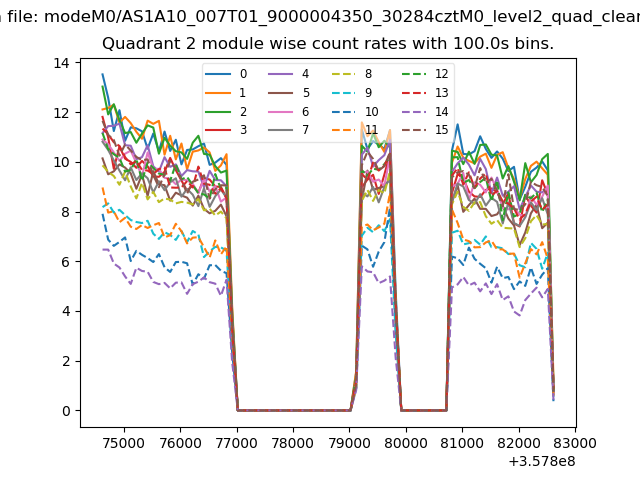
| Module-wise count rates for Quadrant B Data is divided into 100 sec bins |
 |
 |
| Module-wise count rates for Quadrant C Data is divided into 100 sec bins |
 |
 |
| Module-wise count rates for Quadrant D Data is divided into 100 sec bins |
 |
 |
| Parameter | Plot |
|---|---|
| CZT HV Monitor | 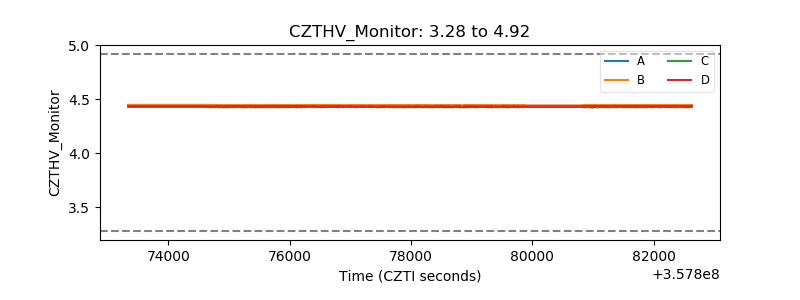 |
| D_VDD | 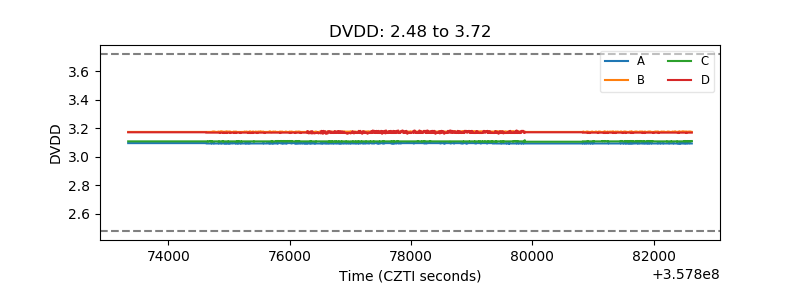 |
| Temperature 1 | 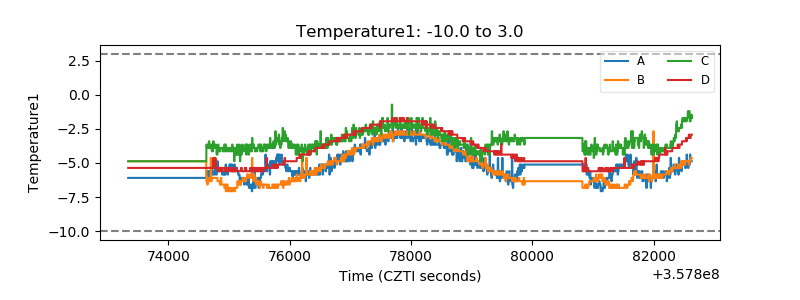 |
| Veto HV Monitor | 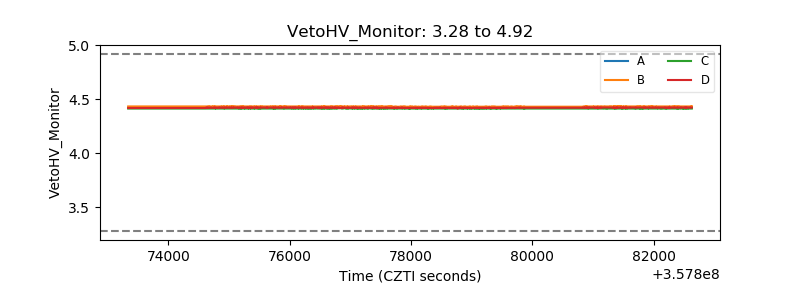 |
| Veto LLD | 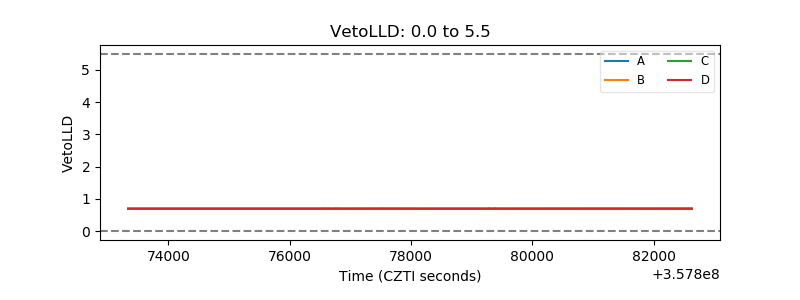 |
| Alpha Counter | 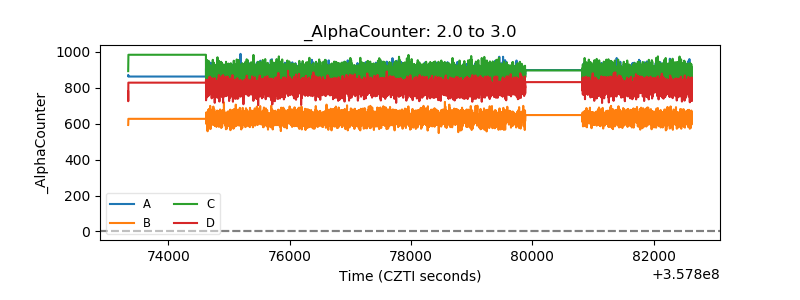 |
| _CPM_Rate |  |
| CZT Counter | 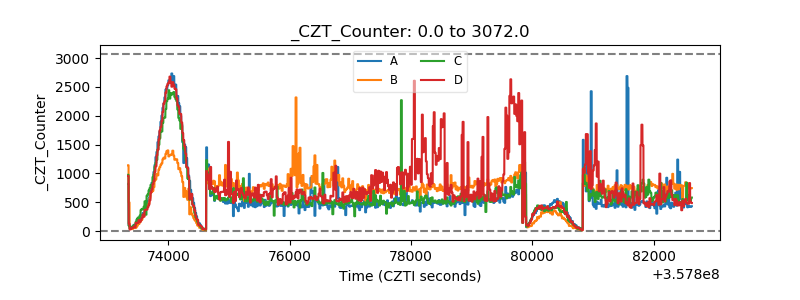 |
| +2.5 Volts monitor | 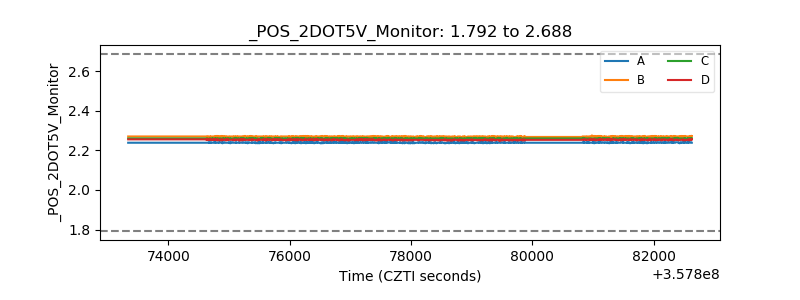 |
| +5 Volts monitor |  |
| _ROLL_ROT | 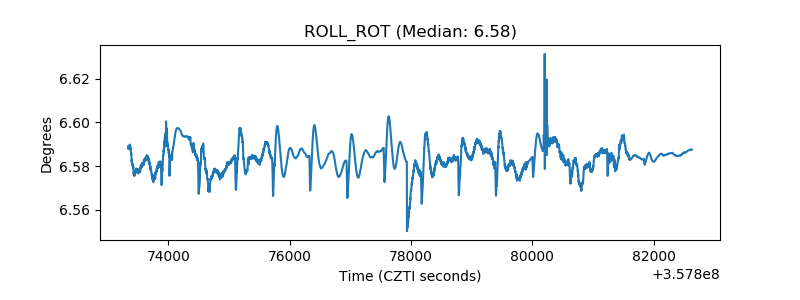 |
| _Roll_DEC | 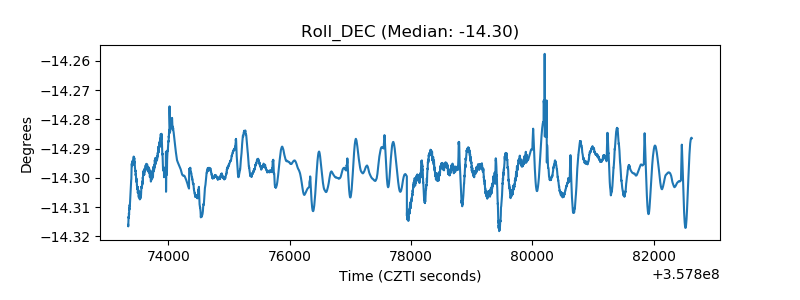 |
| _Roll_RA | 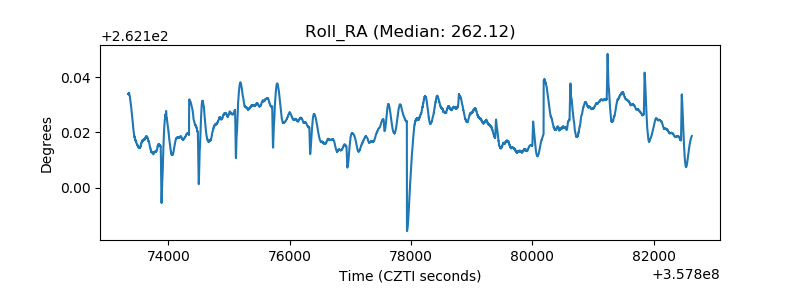 |
| Veto Counter |  |