| Param | Original file | Final file |
|---|---|---|
| Filename | modeM0/AS1A10_007T01_9000004350_30285cztM0_level2.evt | modeM0/AS1A10_007T01_9000004350_30285cztM0_level2_quad_clean.evt |
| Size (bytes) | 720,037,440 | 94,256,640 |
| Size | 686.7 MB | 89.9 MB |
| Events in quadrant A | 3,463,852 | 613,910 |
| Events in quadrant B | 5,247,199 | 625,562 |
| Events in quadrant C | 4,036,186 | 609,107 |
| Events in quadrant D | 8,590,095 | 521,628 |
| Mode M9 | |||
|---|---|---|---|
| Quadrant | BADHDUFLAG | Total packets | Discarded packets |
| A | 0 | 6 | 0 |
| B | 0 | 6 | 0 |
| C | 0 | 6 | 0 |
| D | 0 | 6 | 0 |
| Mode SS | |||
|---|---|---|---|
| Quadrant | BADHDUFLAG | Total packets | Discarded packets |
| A | 0 | 140 | 0 |
| B | 0 | 140 | 0 |
| C | 0 | 140 | 0 |
| D | 0 | 140 | 0 |
| Mode M0 | |||
|---|---|---|---|
| Quadrant | BADHDUFLAG | Total packets | Discarded packets |
| A | 0 | 14663 | 1 |
| B | 0 | 20919 | 7 |
| C | 0 | 16302 | 1 |
| D | 0 | 30207 | 5 |
| Quadrant | Total seconds | Saturated seconds | Saturation percentage |
|---|---|---|---|
| A | 6947 | 97 | 1.396286% |
| B | 6945 | 100 | 1.439885% |
| C | 6947 | 215 | 3.094861% |
| D | 6946 | 1912 | 27.526634% |
Noise dominated data is calculated using 1-second bins in cleaned event files. If a bin has >2000 counts, and if more than 50% of those come from <1% of pixels, then it is considered to be noise-dominated and hence unusable.
| Quadrant | # 1 sec bins | Bins with >0 counts | Bins with >2000 counts | High rate bins dominated by noise | Noise dominated (total time) | Noise dominated (detector-on time) | Marked lightcurve |
|---|---|---|---|---|---|---|---|
| A | 7512 | 6948 | 17 | 17 | 0.23% | 0.24% | 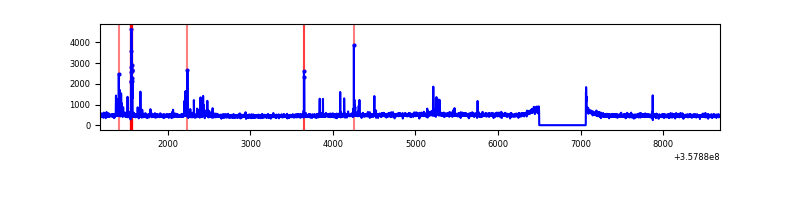 |
| B | 7512 | 6948 | 0 | 0 | 0.00% | 0.00% | 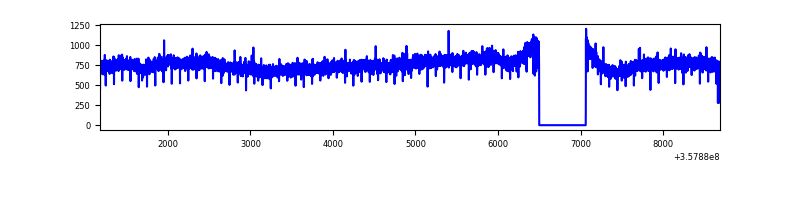 |
| C | 7512 | 6948 | 8 | 8 | 0.11% | 0.12% | 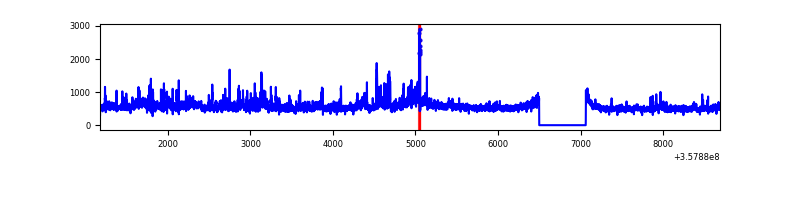 |
| D | 7513 | 6949 | 1666 | 1666 | 22.17% | 23.97% | 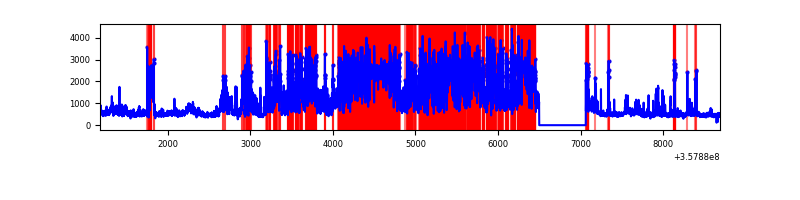 |
Top three noisy pixels from each quadrant. If the there are fewer than three noisy pixels in the level2.evt file, extra rows are filled as -1
| Pixel properties | Quadrant properties | ||||||
|---|---|---|---|---|---|---|---|
| Quadrant | DetID | PixID | Counts | Sigma | Mean | Median | Sigma |
| A | 0 | 13 | 167291 | 969.18 | 852 | 834 | 171.7 |
| A | 13 | 254 | 12147 | 65.87 | 852 | 834 | 171.7 |
| A | 8 | 192 | 10622 | 56.99 | 852 | 834 | 171.7 |
| B | 6 | 159 | 1939067 | 11862.61 | 841 | 818 | 163.4 |
| B | 12 | 111 | 19950 | 117.09 | 841 | 818 | 163.4 |
| B | 11 | 111 | 18834 | 110.26 | 841 | 818 | 163.4 |
| C | 3 | 233 | 604941 | 3112.58 | 823 | 828 | 194.1 |
| C | 14 | 238 | 163188 | 836.53 | 823 | 828 | 194.1 |
| C | 14 | 254 | 43741 | 221.1 | 823 | 828 | 194.1 |
| D | 1 | 52 | 3882210 | 22490.66 | 717 | 700 | 172.6 |
| D | 2 | 250 | 1803603 | 10446.57 | 717 | 700 | 172.6 |
| D | 13 | 104 | 135466 | 780.88 | 717 | 700 | 172.6 |
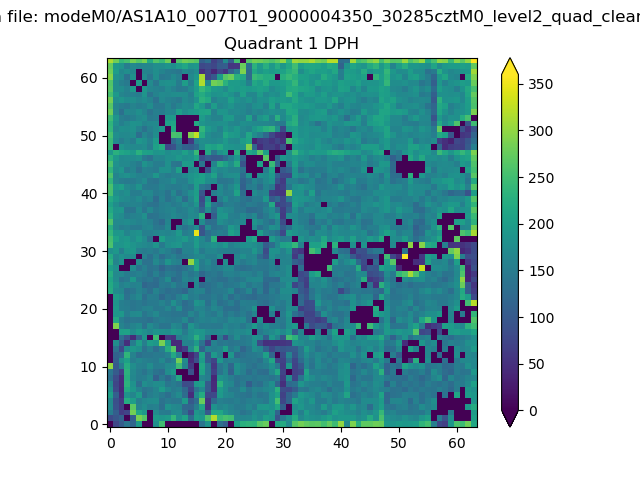
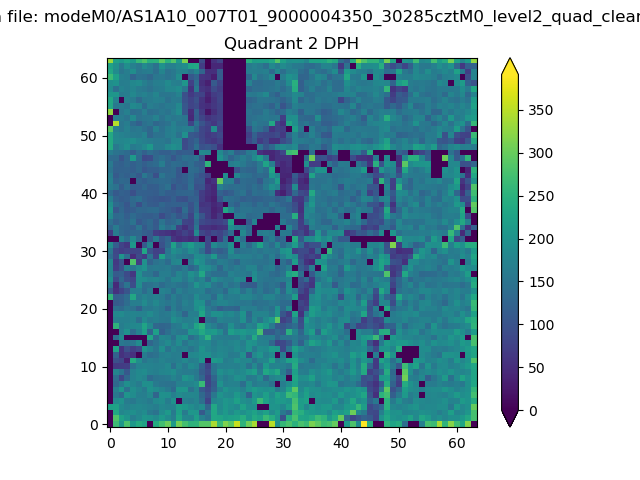
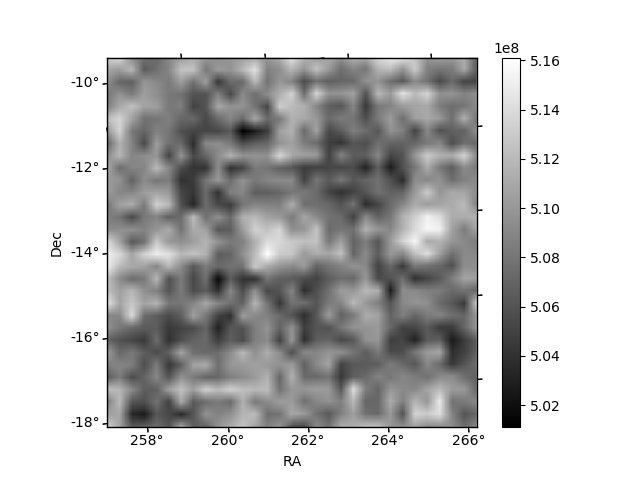
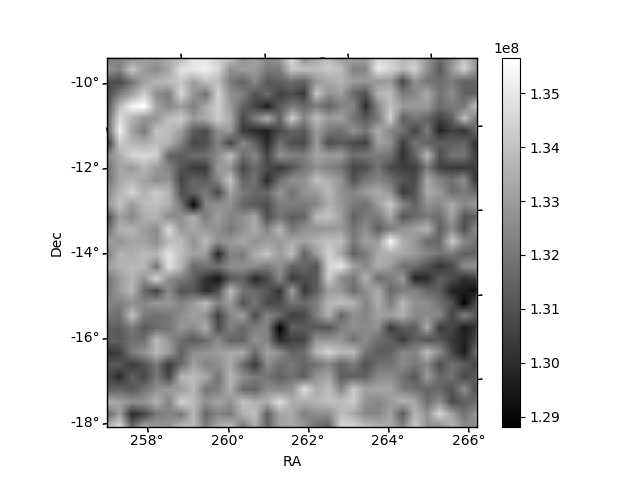
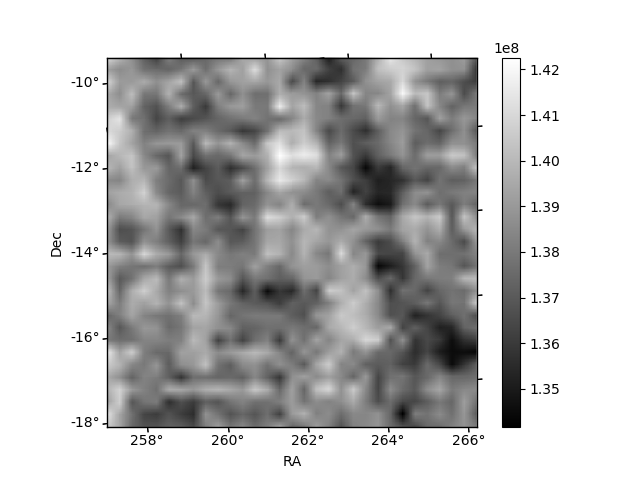
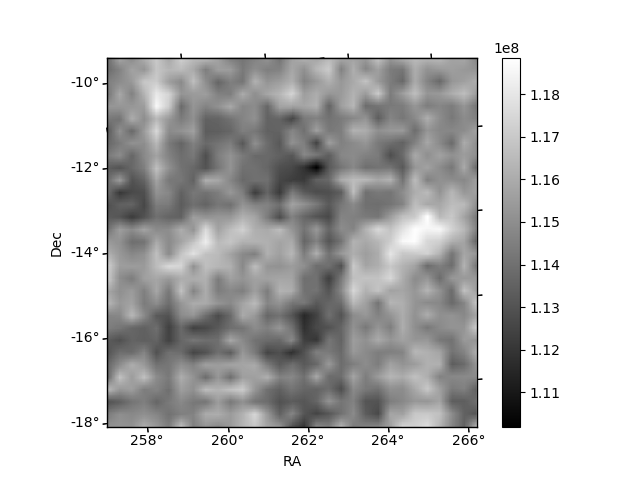
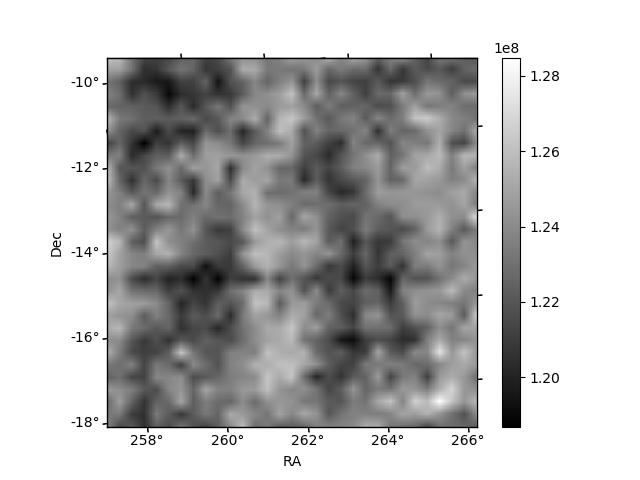
Histogram calculated using DETX and DETY for each event in the final _common_clean file
| Quadrant A |  |
 |
Quadrant B |
|---|---|---|---|
| Quadrant D | 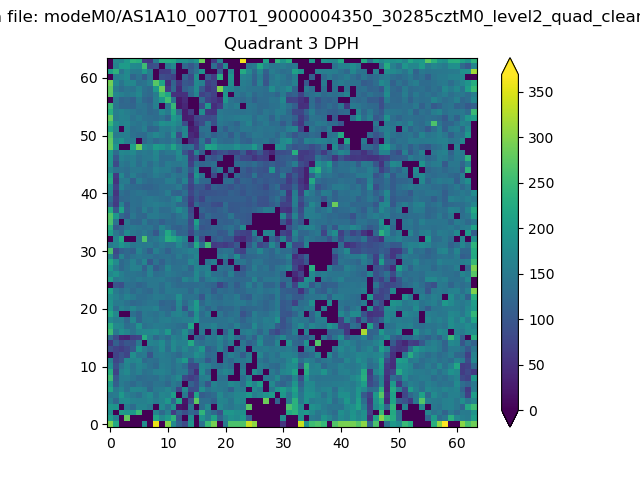 |
 |
Quadrant C |
| Plot type | Count rate plots | Images |
|---|---|---|
| Comparison with Poisson distribution Blue bars denote a histogram of data divided into 1 sec bins. Red curve is a Poisson curve with rate = median count rate of data. |
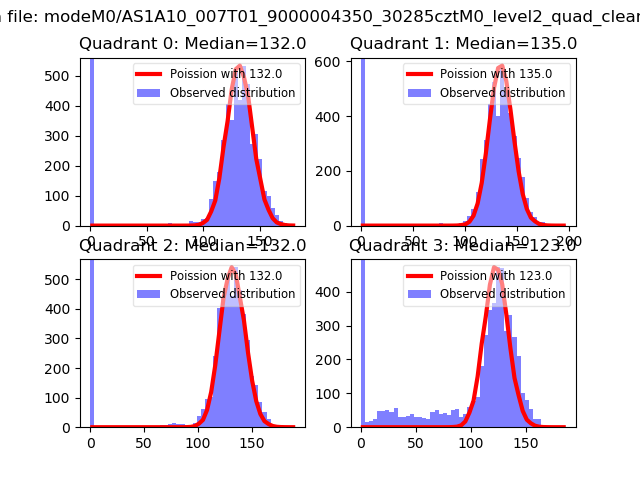 |
 |
| Quadrant-wise count rates Data is divided into 100 sec bins |
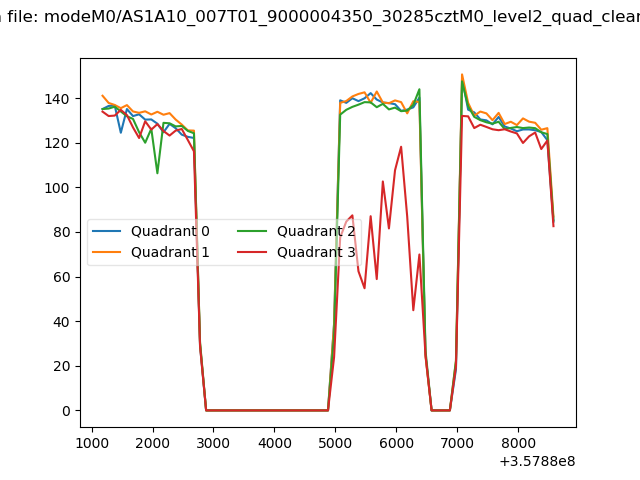 |
|
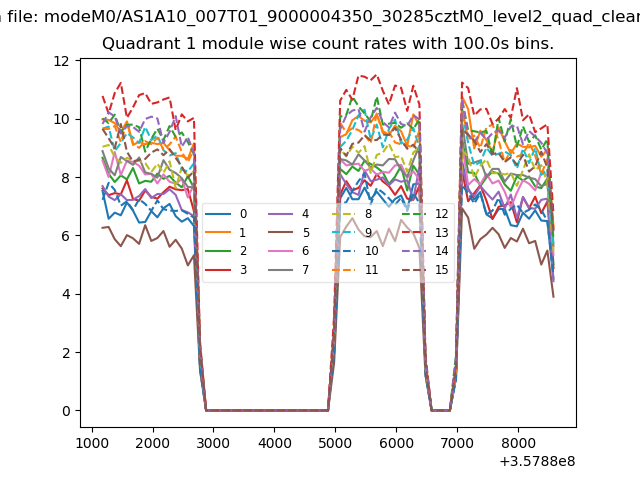
| Module-wise count rates for Quadrant A Data is divided into 100 sec bins |
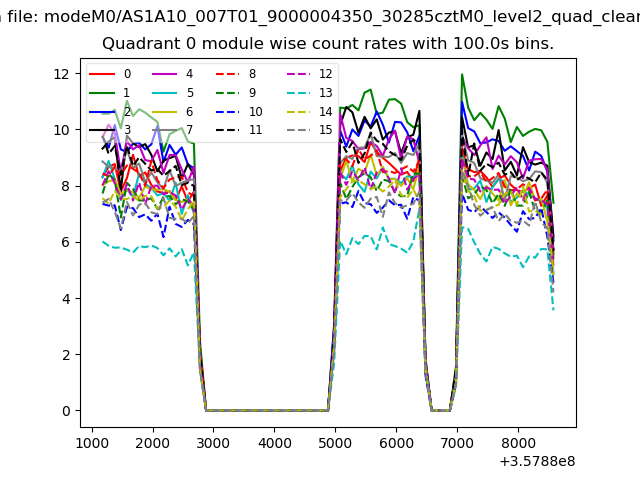 |
 |
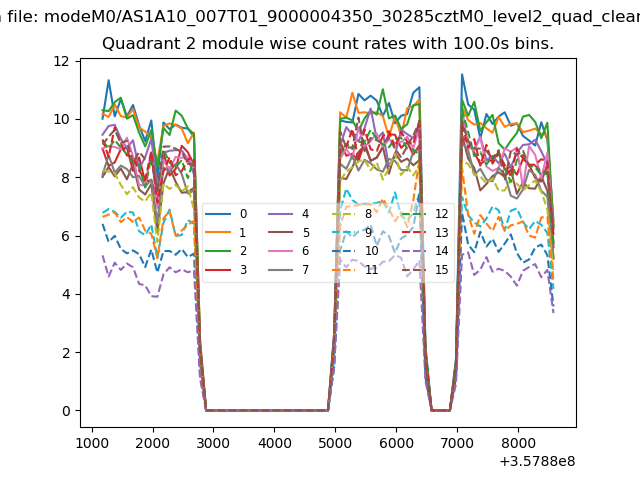
| Module-wise count rates for Quadrant B Data is divided into 100 sec bins |
 |
 |
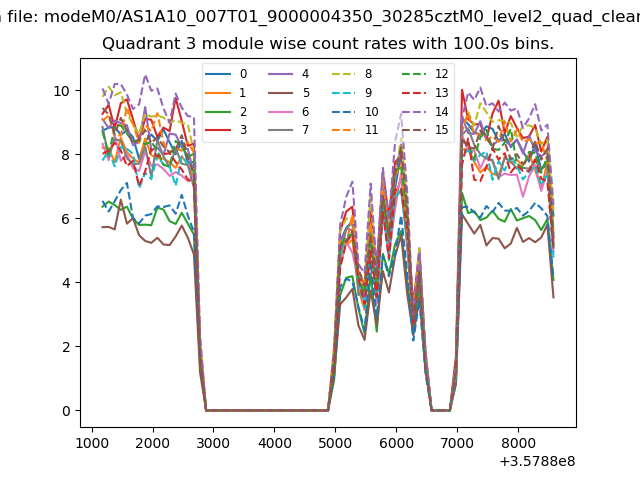
| Module-wise count rates for Quadrant C Data is divided into 100 sec bins |
 |
 |
| Module-wise count rates for Quadrant D Data is divided into 100 sec bins |
 |
 |
| Parameter | Plot |
|---|---|
| CZT HV Monitor | 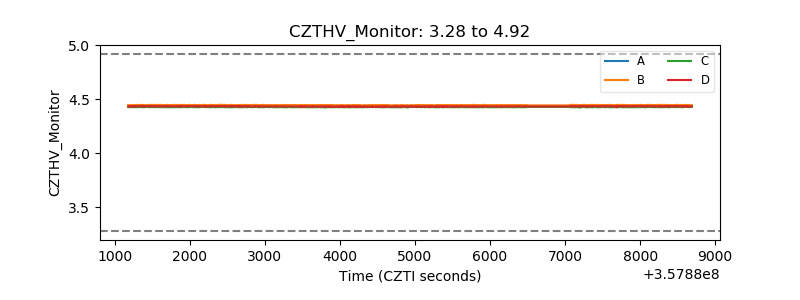 |
| D_VDD | 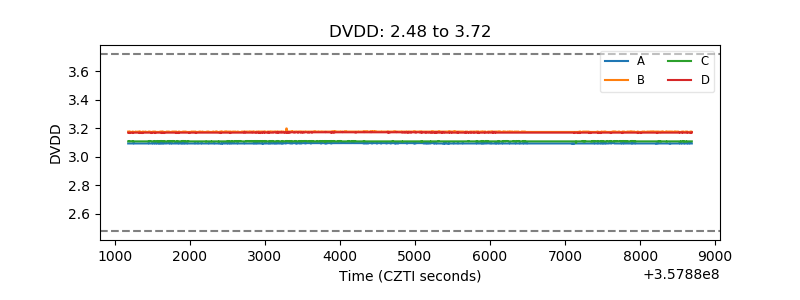 |
| Temperature 1 | 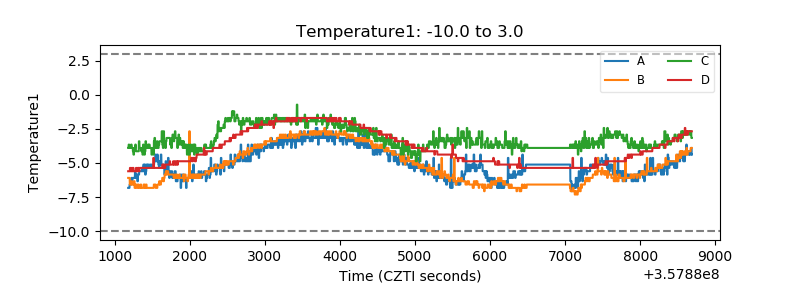 |
| Veto HV Monitor | 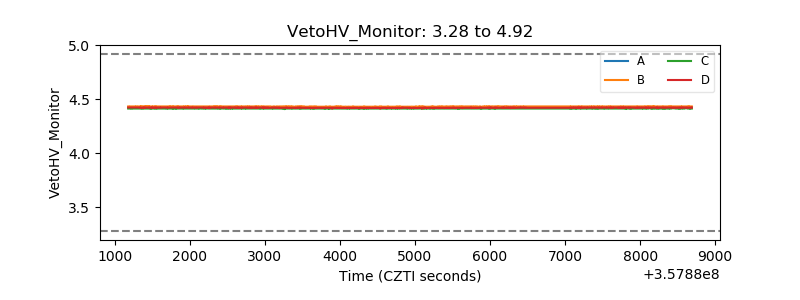 |
| Veto LLD | 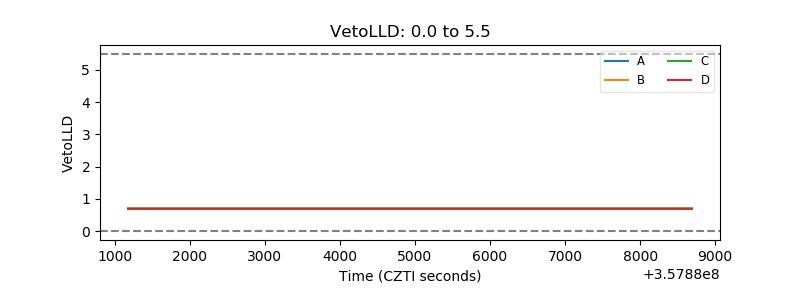 |
| Alpha Counter | 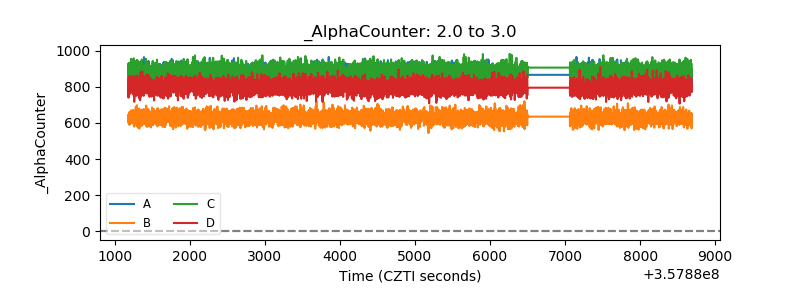 |
| _CPM_Rate |  |
| CZT Counter | 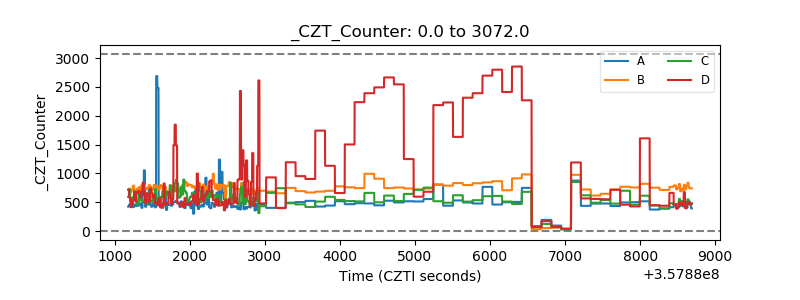 |
| +2.5 Volts monitor | 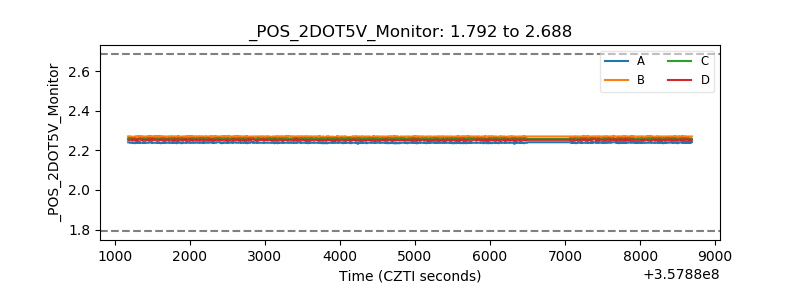 |
| +5 Volts monitor |  |
| _ROLL_ROT | 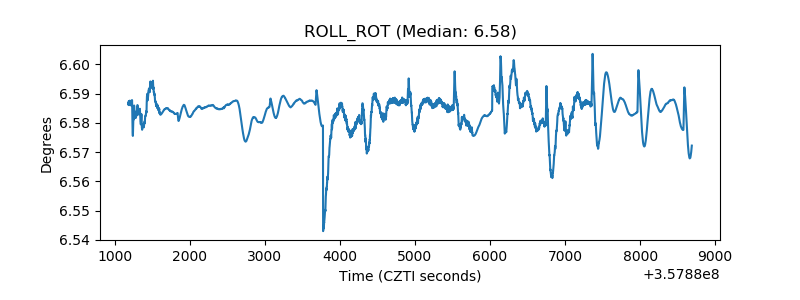 |
| _Roll_DEC | 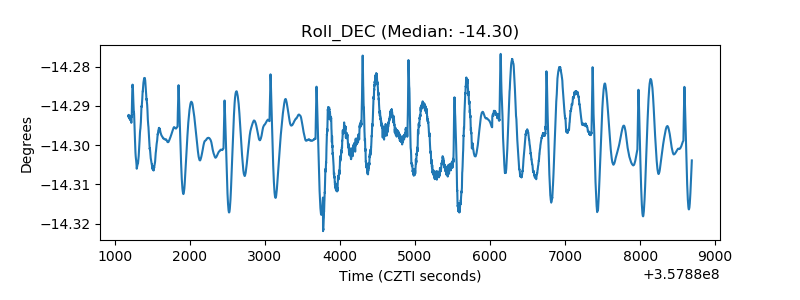 |
| _Roll_RA | 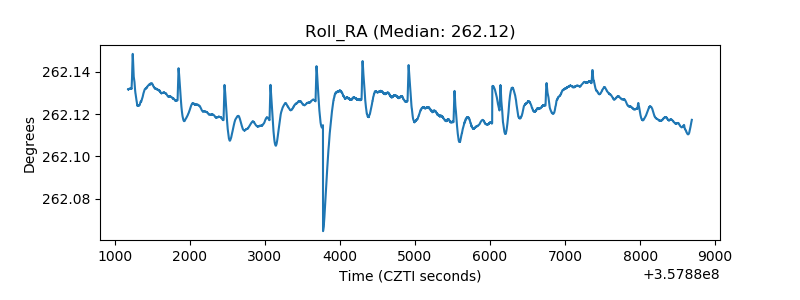 |
| Veto Counter | 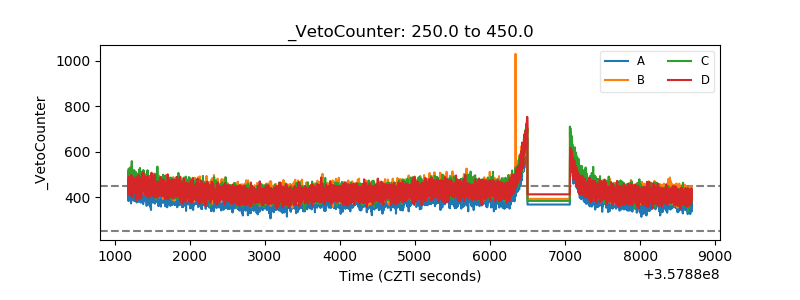 |