| Param | Original file | Final file |
|---|---|---|
| Filename | modeM0/AS1A10_007T01_9000004350_30286cztM0_level2.evt | modeM0/AS1A10_007T01_9000004350_30286cztM0_level2_quad_clean.evt |
| Size (bytes) | 727,686,720 | 106,404,480 |
| Size | 694.0 MB | 101.5 MB |
| Events in quadrant A | 3,838,144 | 679,122 |
| Events in quadrant B | 6,050,073 | 685,644 |
| Events in quadrant C | 4,137,354 | 677,480 |
| Events in quadrant D | 7,475,834 | 628,082 |
| Mode M9 | |||
|---|---|---|---|
| Quadrant | BADHDUFLAG | Total packets | Discarded packets |
| A | 0 | 1 | 0 |
| B | 0 | 2 | 0 |
| C | 0 | 2 | 0 |
| D | 0 | 2 | 0 |
| Mode SS | |||
|---|---|---|---|
| Quadrant | BADHDUFLAG | Total packets | Discarded packets |
| A | 0 | 158 | 0 |
| B | 0 | 158 | 0 |
| C | 0 | 158 | 0 |
| D | 0 | 158 | 0 |
| Mode M0 | |||
|---|---|---|---|
| Quadrant | BADHDUFLAG | Total packets | Discarded packets |
| A | 0 | 16513 | 1 |
| B | 0 | 24135 | 1 |
| C | 0 | 16966 | 1 |
| D | 0 | 27448 | 3 |
| Quadrant | Total seconds | Saturated seconds | Saturation percentage |
|---|---|---|---|
| A | 7935 | 294 | 3.705104% |
| B | 7935 | 377 | 4.751103% |
| C | 7935 | 363 | 4.574669% |
| D | 7934 | 1344 | 16.939753% |
Noise dominated data is calculated using 1-second bins in cleaned event files. If a bin has >2000 counts, and if more than 50% of those come from <1% of pixels, then it is considered to be noise-dominated and hence unusable.
| Quadrant | # 1 sec bins | Bins with >0 counts | Bins with >2000 counts | High rate bins dominated by noise | Noise dominated (total time) | Noise dominated (detector-on time) | Marked lightcurve |
|---|---|---|---|---|---|---|---|
| A | 7935 | 7935 | 0 | 0 | 0.00% | 0.00% | 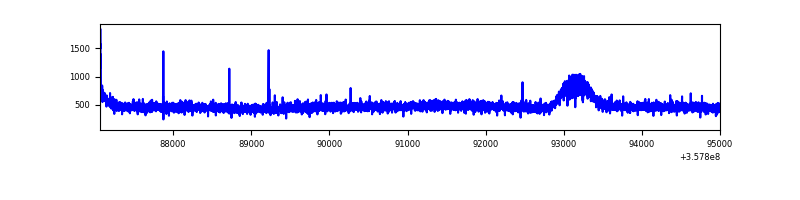 |
| B | 7935 | 7935 | 1 | 1 | 0.01% | 0.01% | 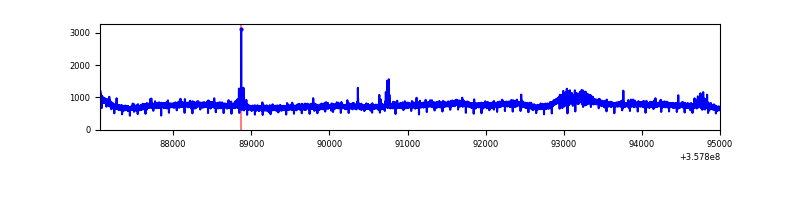 |
| C | 7935 | 7935 | 0 | 0 | 0.00% | 0.00% | 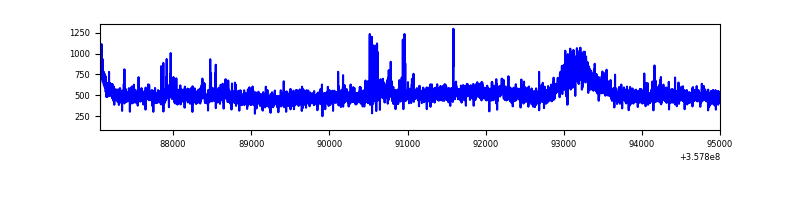 |
| D | 7934 | 7934 | 982 | 982 | 12.38% | 12.38% | 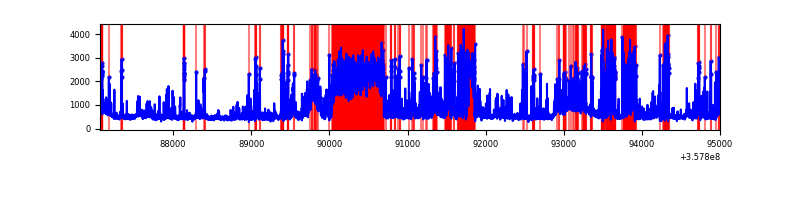 |
Top three noisy pixels from each quadrant. If the there are fewer than three noisy pixels in the level2.evt file, extra rows are filled as -1
| Pixel properties | Quadrant properties | ||||||
|---|---|---|---|---|---|---|---|
| Quadrant | DetID | PixID | Counts | Sigma | Mean | Median | Sigma |
| A | 13 | 254 | 14052 | 64.76 | 990 | 968 | 202.0 |
| A | 8 | 192 | 10801 | 48.67 | 990 | 968 | 202.0 |
| A | 3 | 137 | 10477 | 47.07 | 990 | 968 | 202.0 |
| B | 6 | 159 | 2179492 | 11396.03 | 974 | 948 | 191.2 |
| B | 0 | 190 | 28878 | 146.1 | 974 | 948 | 191.2 |
| B | 12 | 111 | 23808 | 119.58 | 974 | 948 | 191.2 |
| C | 3 | 233 | 175758 | 768.4 | 961 | 963 | 227.5 |
| C | 14 | 238 | 166156 | 726.19 | 961 | 963 | 227.5 |
| C | 14 | 254 | 20410 | 85.49 | 961 | 963 | 227.5 |
| D | 1 | 52 | 2345356 | 10525.8 | 918 | 895 | 222.7 |
| D | 13 | 104 | 1202987 | 5396.97 | 918 | 895 | 222.7 |
| D | 2 | 250 | 391723 | 1754.68 | 918 | 895 | 222.7 |
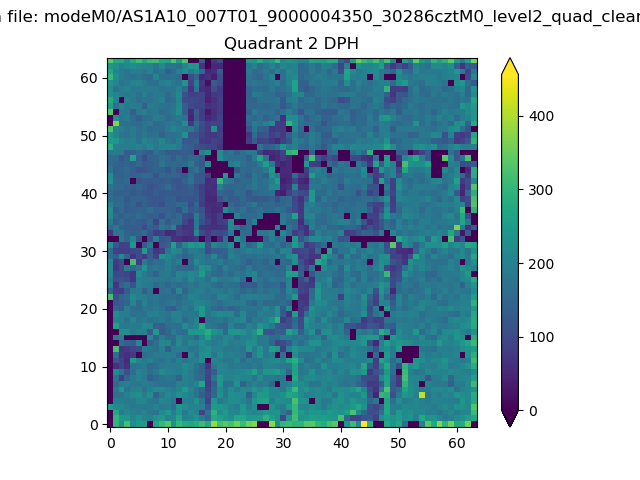
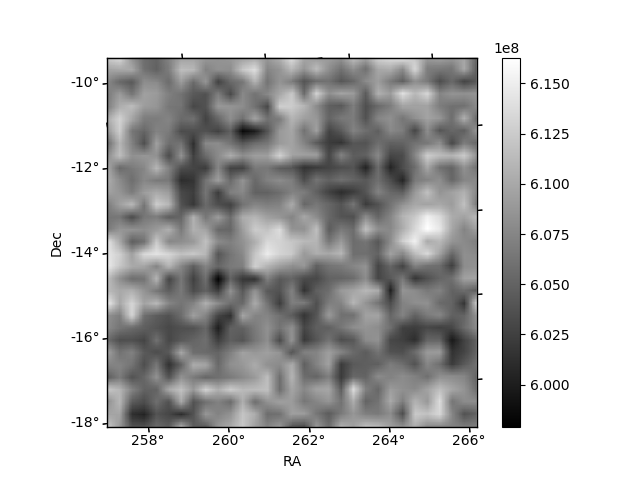
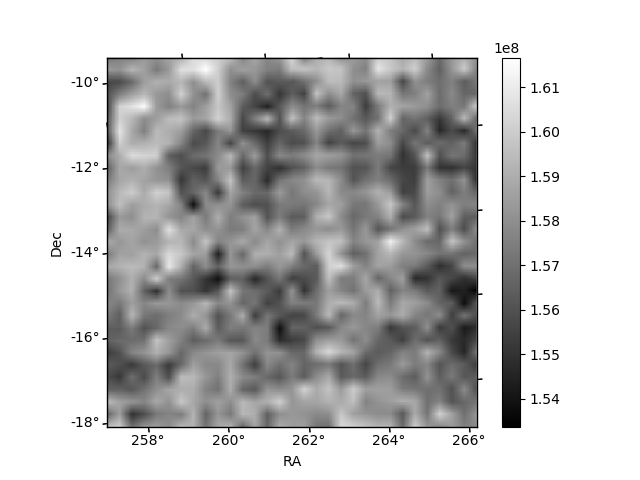
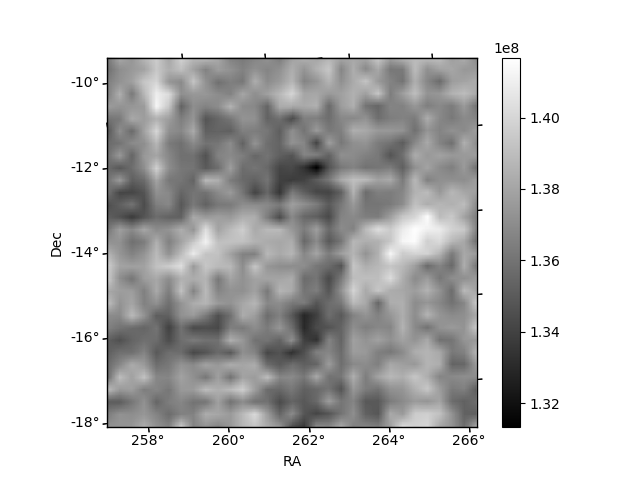
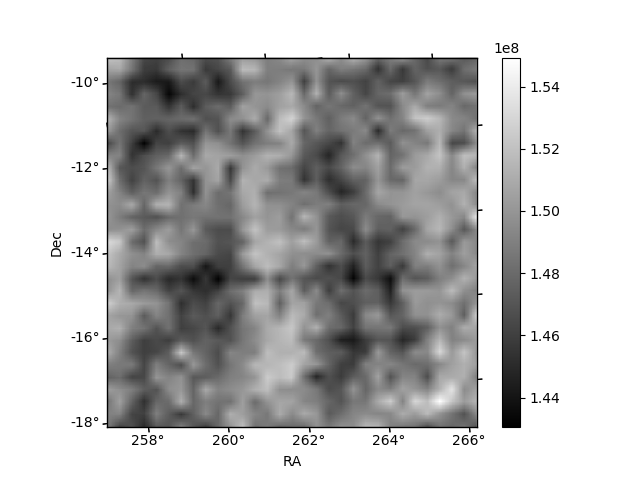
Histogram calculated using DETX and DETY for each event in the final _common_clean file
| Quadrant A | 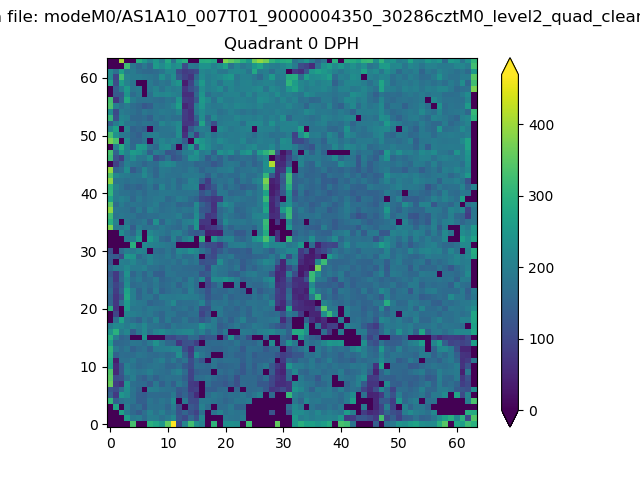 |
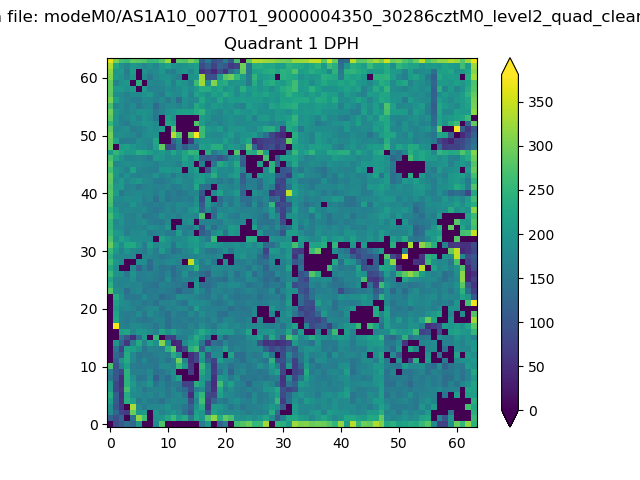 |
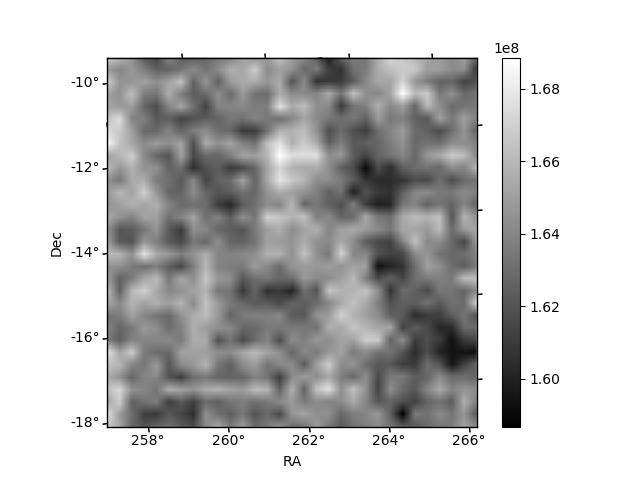
Quadrant B |
|---|---|---|---|
| Quadrant D | 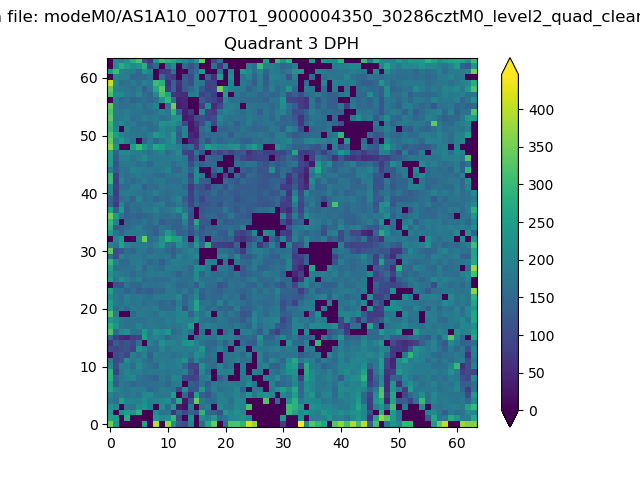 |
 |
Quadrant C |
| Plot type | Count rate plots | Images |
|---|---|---|
| Comparison with Poisson distribution Blue bars denote a histogram of data divided into 1 sec bins. Red curve is a Poisson curve with rate = median count rate of data. |
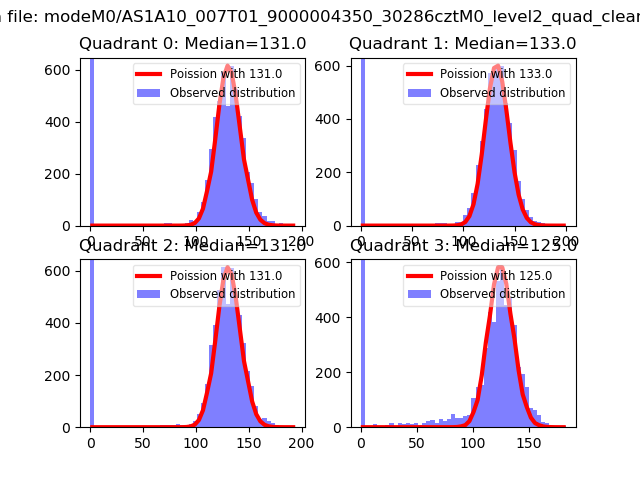 |
 |
| Quadrant-wise count rates Data is divided into 100 sec bins |
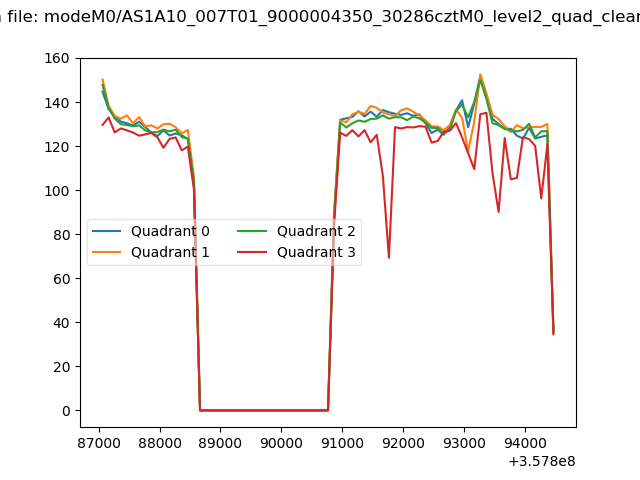 |
|
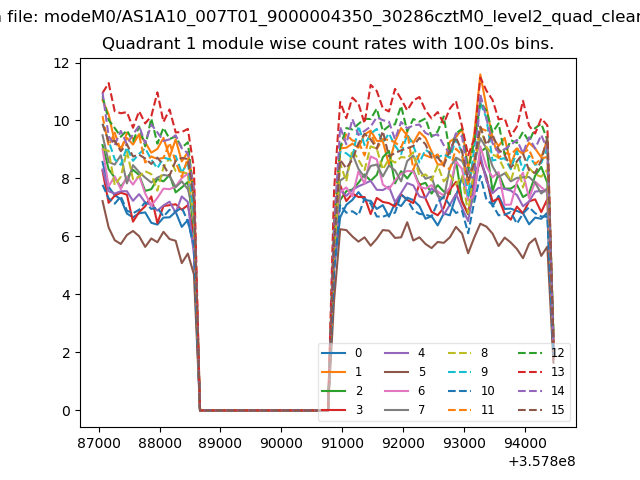
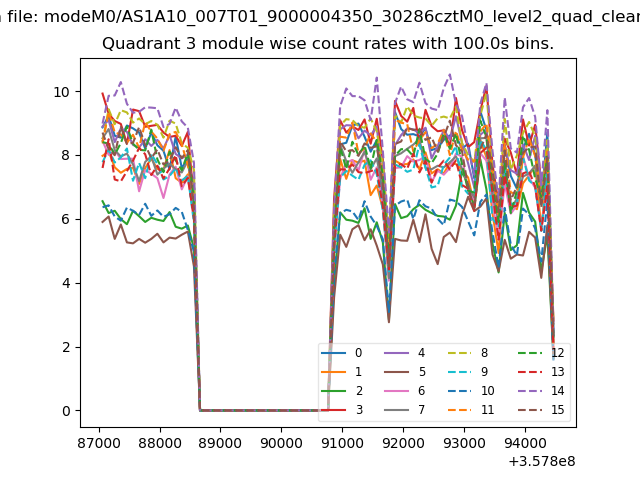
| Module-wise count rates for Quadrant A Data is divided into 100 sec bins |
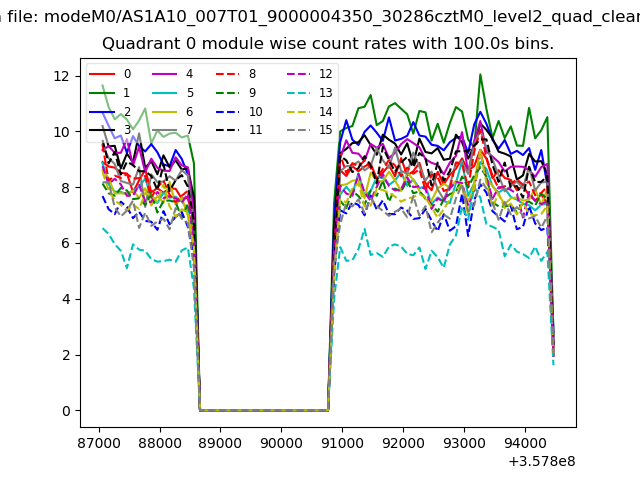 |
 |
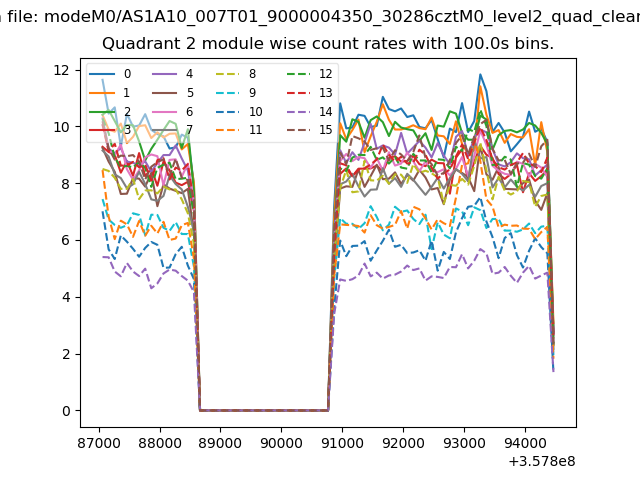
| Module-wise count rates for Quadrant B Data is divided into 100 sec bins |
 |
 |
| Module-wise count rates for Quadrant C Data is divided into 100 sec bins |
 |
 |
| Module-wise count rates for Quadrant D Data is divided into 100 sec bins |
 |
 |
| Parameter | Plot |
|---|---|
| CZT HV Monitor | 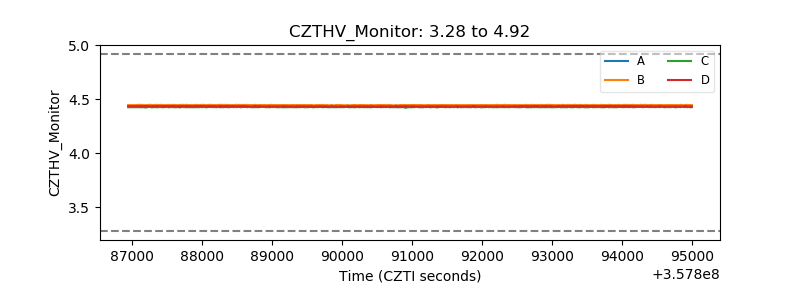 |
| D_VDD | 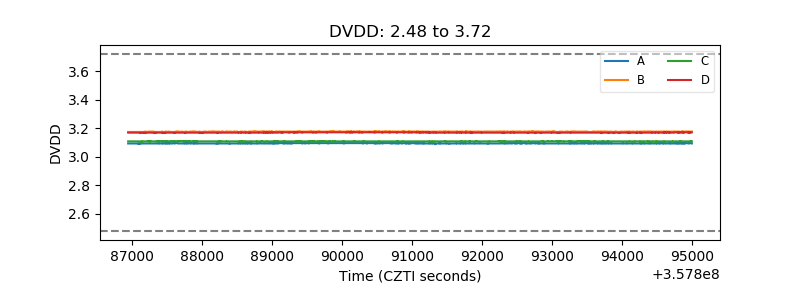 |
| Temperature 1 | 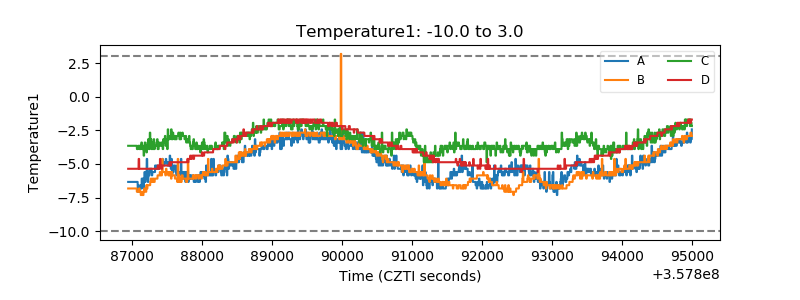 |
| Veto HV Monitor | 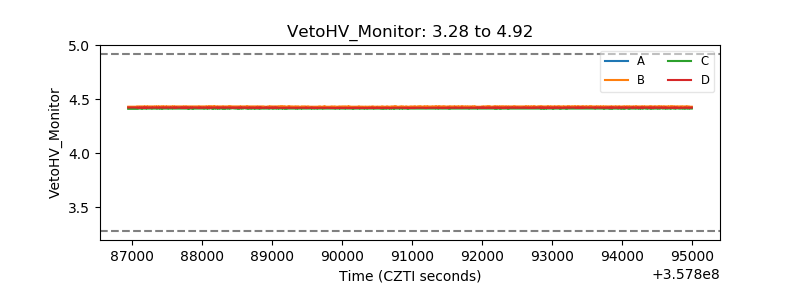 |
| Veto LLD | 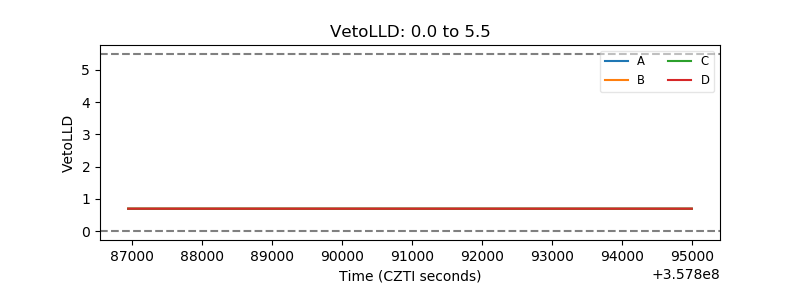 |
| Alpha Counter | 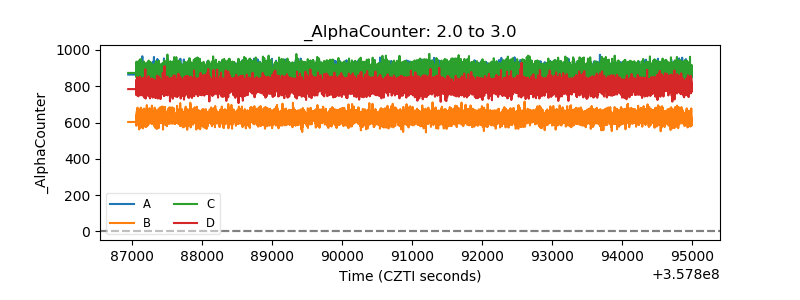 |
| _CPM_Rate | 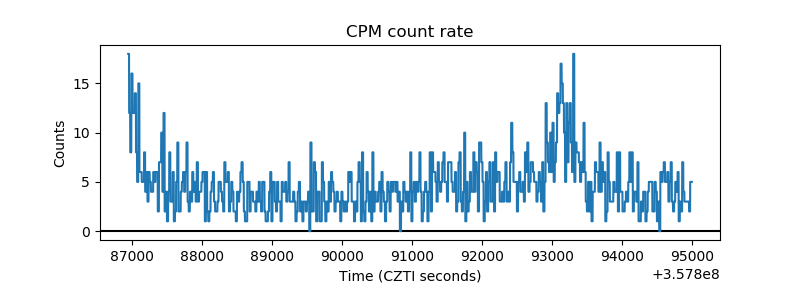 |
| CZT Counter | 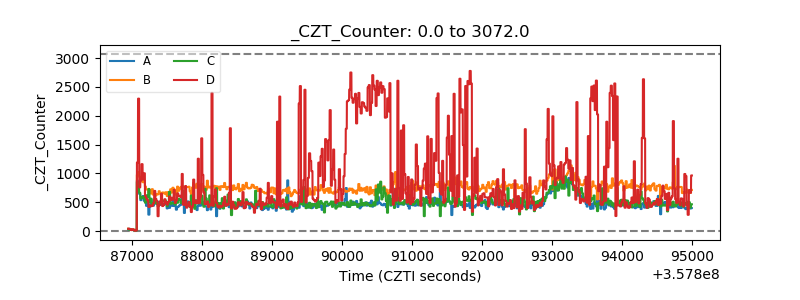 |
| +2.5 Volts monitor |  |
| +5 Volts monitor |  |
| _ROLL_ROT | 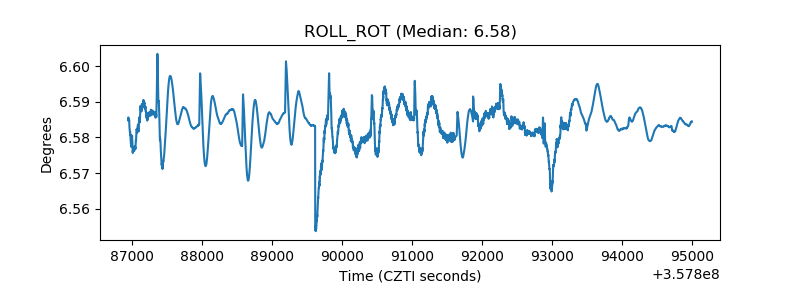 |
| _Roll_DEC | 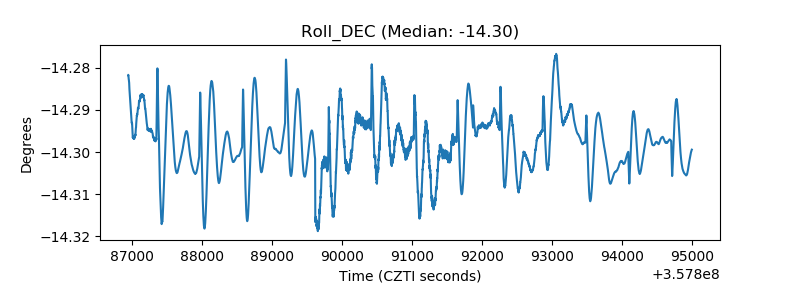 |
| _Roll_RA | 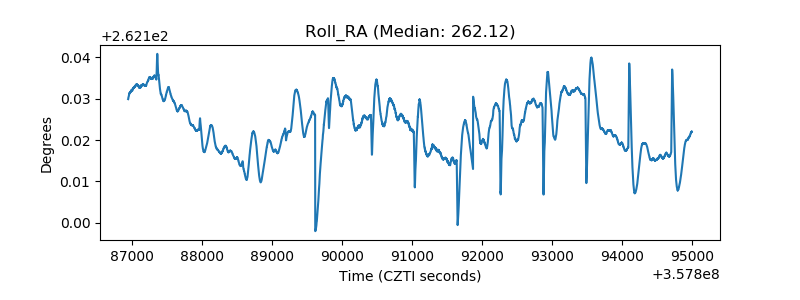 |
| Veto Counter | 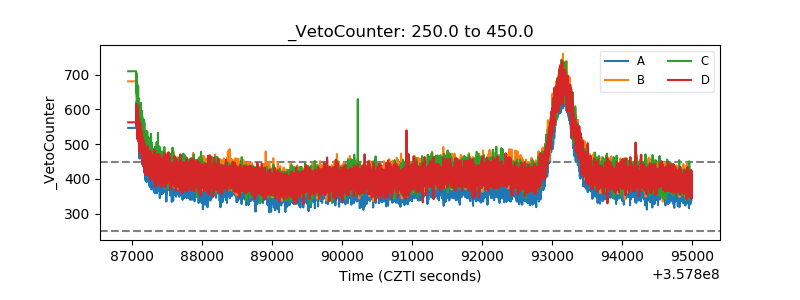 |