| Param | Original file | Final file |
|---|---|---|
| Filename | modeM0/AS1A10_007T01_9000004350_30287cztM0_level2.evt | modeM0/AS1A10_007T01_9000004350_30287cztM0_level2_quad_clean.evt |
| Size (bytes) | 644,834,880 | 85,538,880 |
| Size | 615.0 MB | 81.6 MB |
| Events in quadrant A | 3,503,639 | 526,741 |
| Events in quadrant B | 5,605,293 | 530,314 |
| Events in quadrant C | 3,931,642 | 524,590 |
| Events in quadrant D | 5,997,505 | 503,439 |
| Mode SS | |||
|---|---|---|---|
| Quadrant | BADHDUFLAG | Total packets | Discarded packets |
| A | 0 | 146 | 0 |
| B | 0 | 146 | 0 |
| C | 0 | 146 | 0 |
| D | 0 | 146 | 0 |
| Mode M0 | |||
|---|---|---|---|
| Quadrant | BADHDUFLAG | Total packets | Discarded packets |
| A | 0 | 15103 | 2 |
| B | 0 | 22322 | 2 |
| C | 0 | 15968 | 2 |
| D | 0 | 22675 | 2 |
| Quadrant | Total seconds | Saturated seconds | Saturation percentage |
|---|---|---|---|
| A | 7245 | 279 | 3.850932% |
| B | 7245 | 347 | 4.789510% |
| C | 7246 | 303 | 4.181617% |
| D | 7246 | 714 | 9.853712% |
Noise dominated data is calculated using 1-second bins in cleaned event files. If a bin has >2000 counts, and if more than 50% of those come from <1% of pixels, then it is considered to be noise-dominated and hence unusable.
| Quadrant | # 1 sec bins | Bins with >0 counts | Bins with >2000 counts | High rate bins dominated by noise | Noise dominated (total time) | Noise dominated (detector-on time) | Marked lightcurve |
|---|---|---|---|---|---|---|---|
| A | 7275 | 7246 | 0 | 0 | 0.00% | 0.00% | 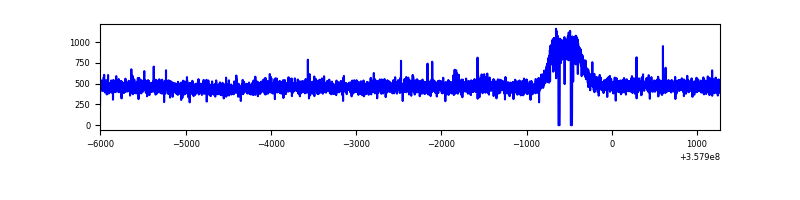 |
| B | 7275 | 7247 | 1 | 1 | 0.01% | 0.01% | 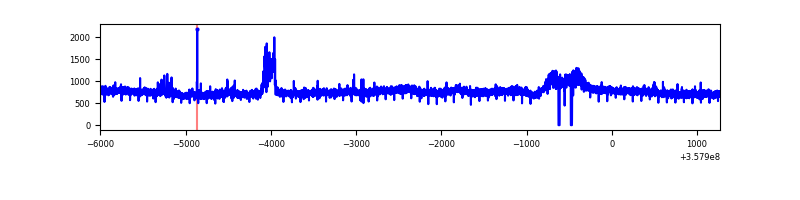 |
| C | 7276 | 7248 | 0 | 0 | 0.00% | 0.00% | 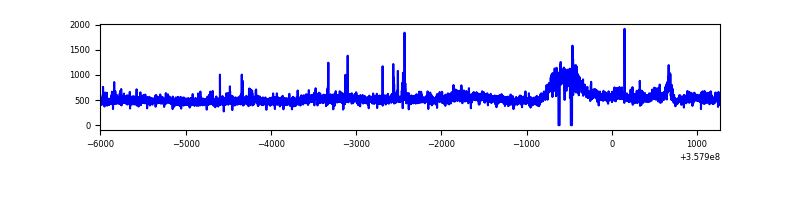 |
| D | 7276 | 7248 | 366 | 366 | 5.03% | 5.05% | 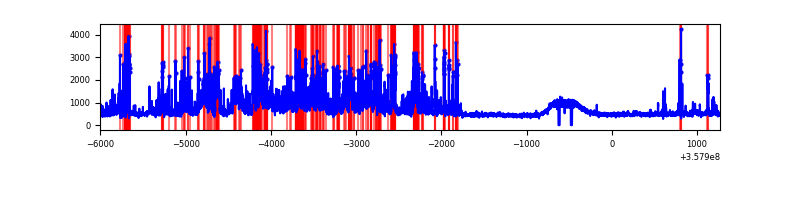 |
Top three noisy pixels from each quadrant. If the there are fewer than three noisy pixels in the level2.evt file, extra rows are filled as -1
| Pixel properties | Quadrant properties | ||||||
|---|---|---|---|---|---|---|---|
| Quadrant | DetID | PixID | Counts | Sigma | Mean | Median | Sigma |
| A | 13 | 254 | 12242 | 61.32 | 908 | 886 | 185.2 |
| A | 3 | 137 | 9711 | 47.66 | 908 | 886 | 185.2 |
| A | 0 | 226 | 7434 | 35.36 | 908 | 886 | 185.2 |
| B | 6 | 159 | 1986049 | 11272.42 | 886 | 862 | 176.1 |
| B | 0 | 229 | 107373 | 604.8 | 886 | 862 | 176.1 |
| B | 0 | 190 | 23555 | 128.86 | 886 | 862 | 176.1 |
| C | 3 | 233 | 334241 | 1603.57 | 874 | 879 | 207.9 |
| C | 14 | 238 | 140893 | 673.51 | 874 | 879 | 207.9 |
| C | 10 | 22 | 35947 | 168.69 | 874 | 879 | 207.9 |
| D | 1 | 52 | 1791740 | 8363.54 | 873 | 852 | 214.1 |
| D | 13 | 104 | 637679 | 2974.01 | 873 | 852 | 214.1 |
| D | 8 | 195 | 168838 | 784.5 | 873 | 852 | 214.1 |
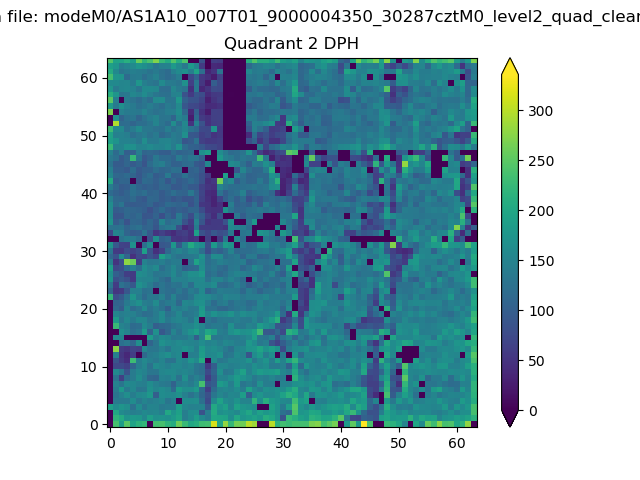
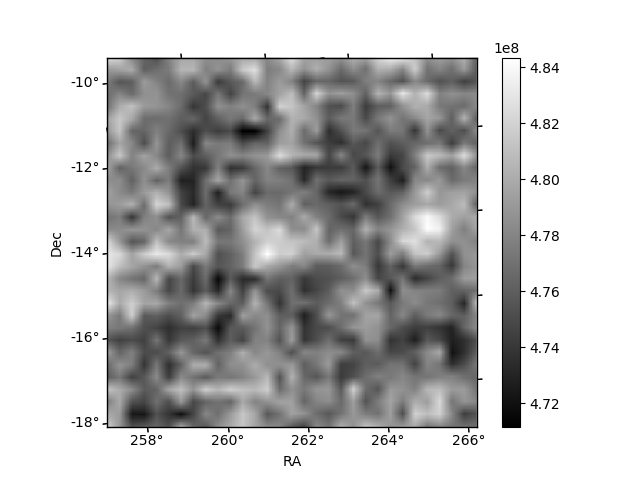
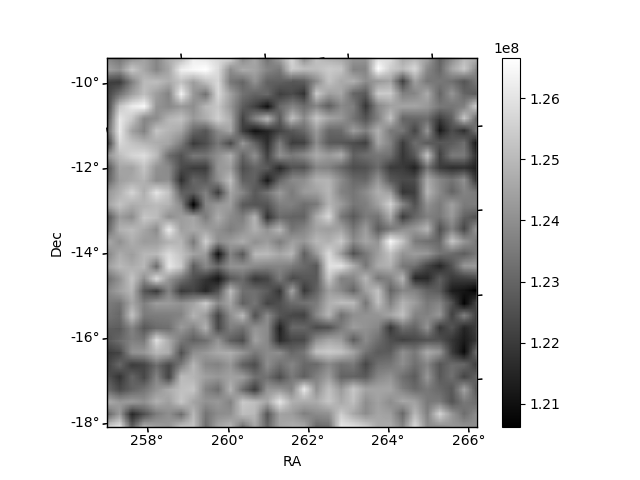
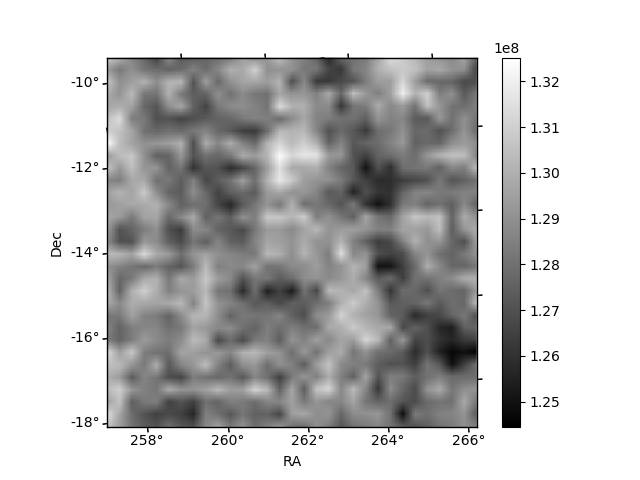
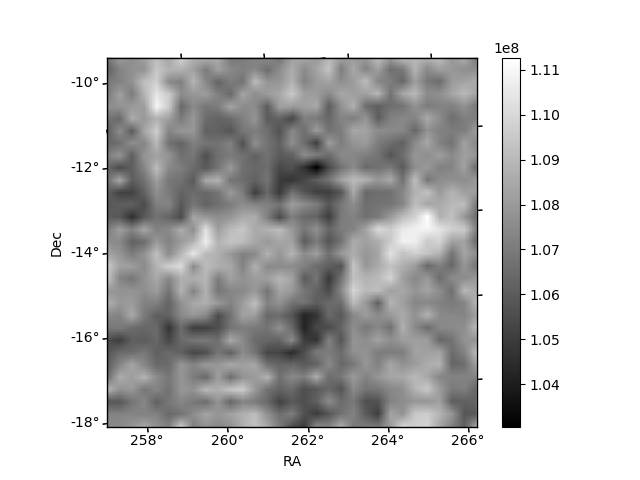
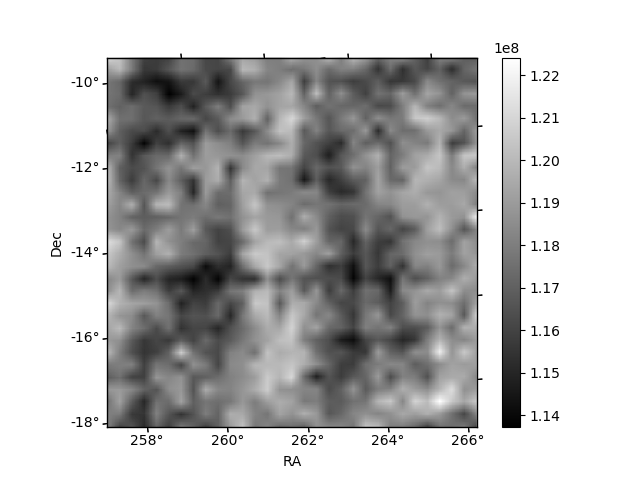
Histogram calculated using DETX and DETY for each event in the final _common_clean file
| Quadrant A | 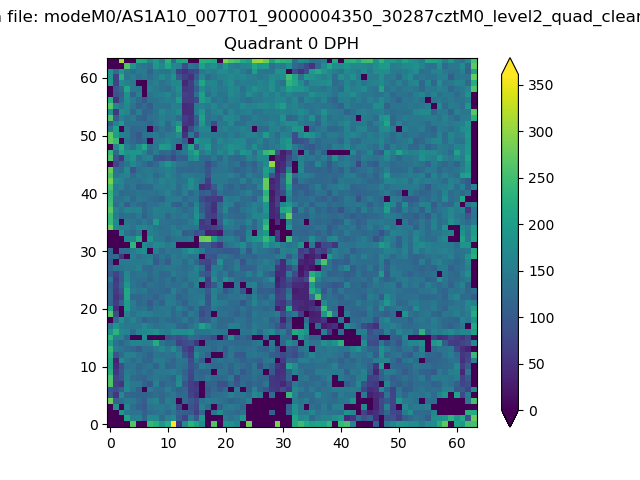 |
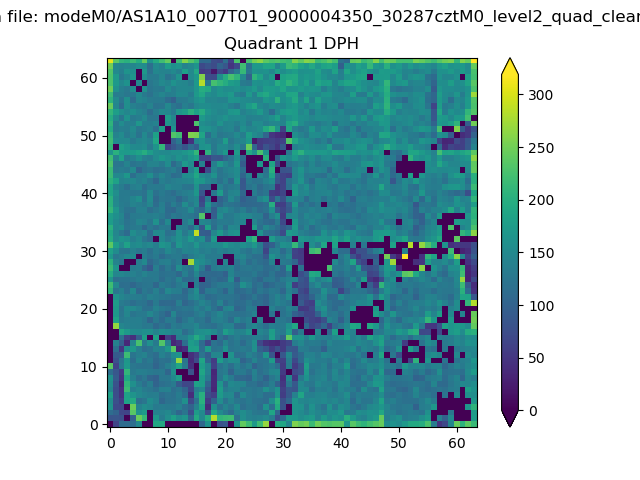 |
Quadrant B |
|---|---|---|---|
| Quadrant D | 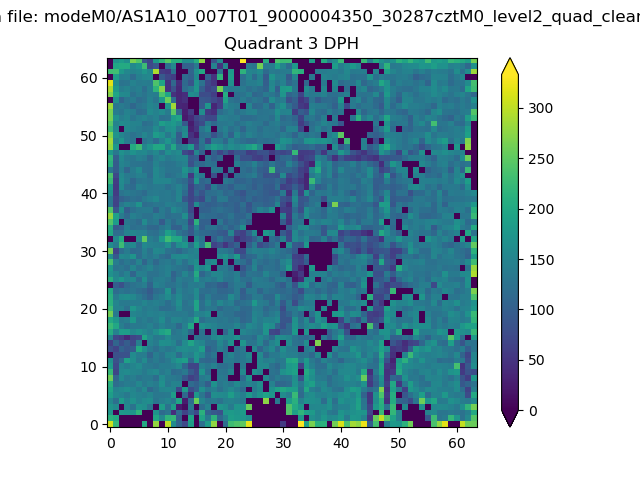 |
 |
Quadrant C |
| Plot type | Count rate plots | Images |
|---|---|---|
| Comparison with Poisson distribution Blue bars denote a histogram of data divided into 1 sec bins. Red curve is a Poisson curve with rate = median count rate of data. |
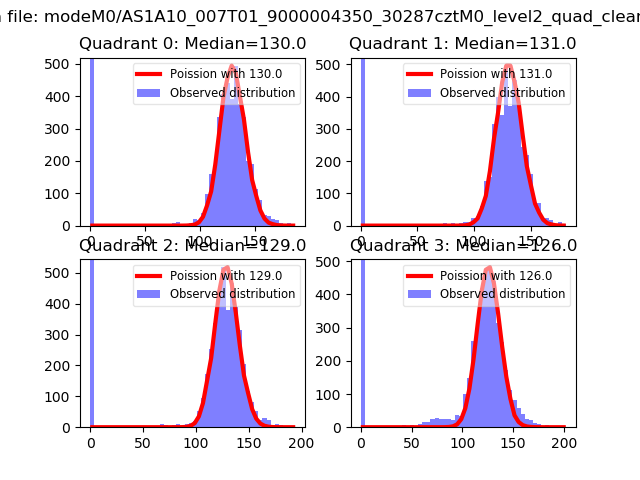 |
 |
| Quadrant-wise count rates Data is divided into 100 sec bins |
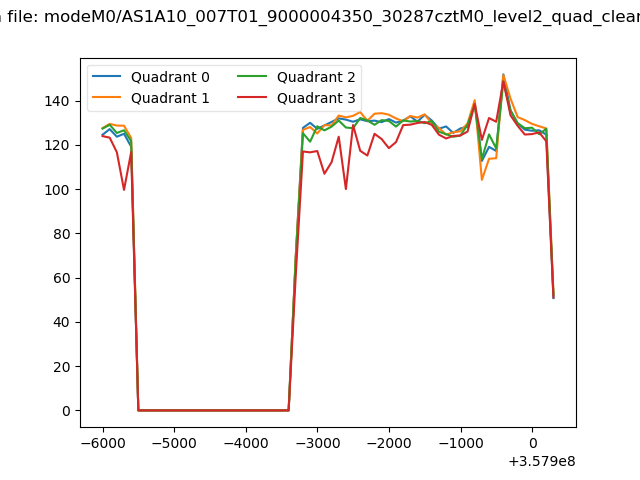 |
|
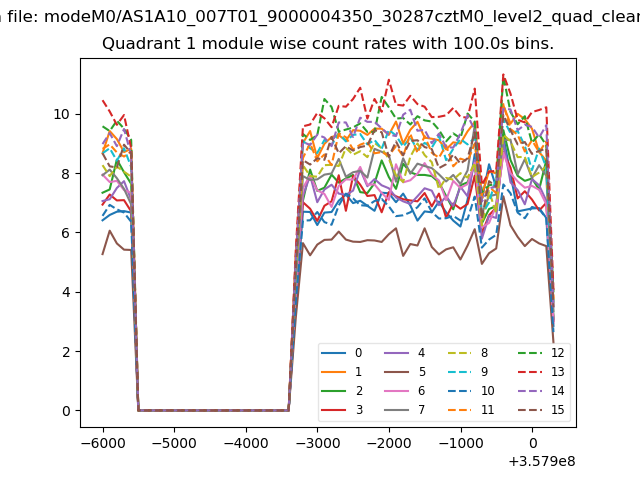
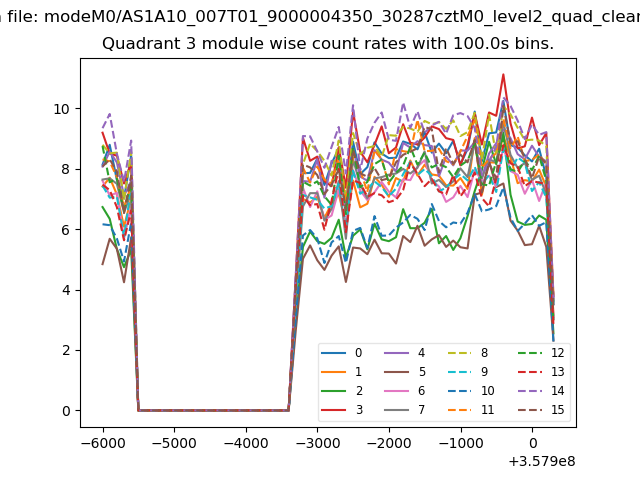
| Module-wise count rates for Quadrant A Data is divided into 100 sec bins |
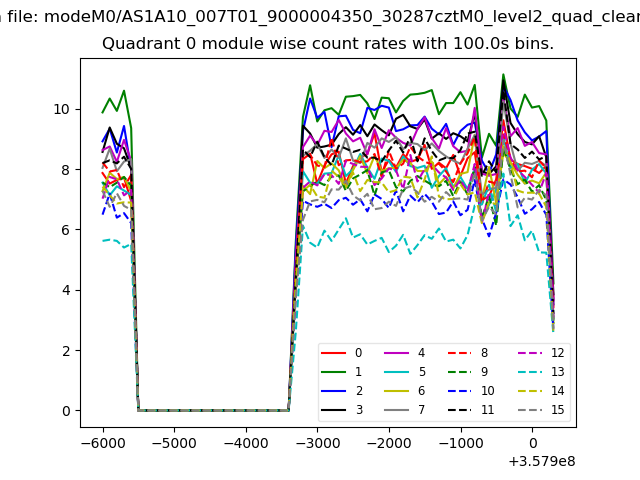 |
 |
| Module-wise count rates for Quadrant B Data is divided into 100 sec bins |
 |
 |
| Module-wise count rates for Quadrant C Data is divided into 100 sec bins |
 |
 |
| Module-wise count rates for Quadrant D Data is divided into 100 sec bins |
 |
 |
| Parameter | Plot |
|---|---|
| CZT HV Monitor | 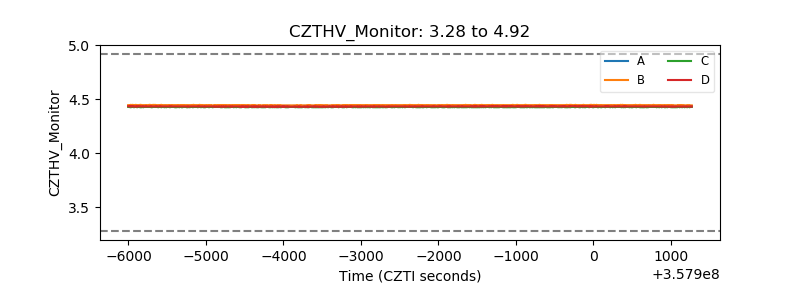 |
| D_VDD | 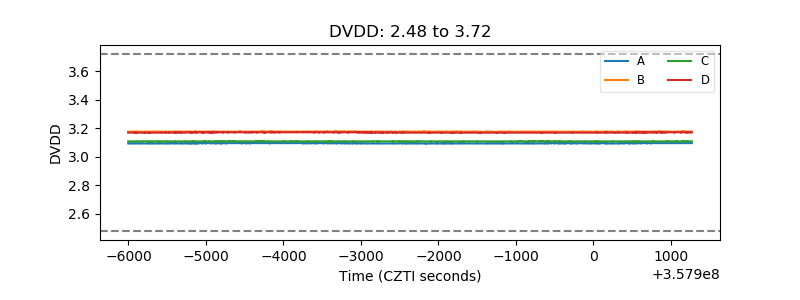 |
| Temperature 1 | 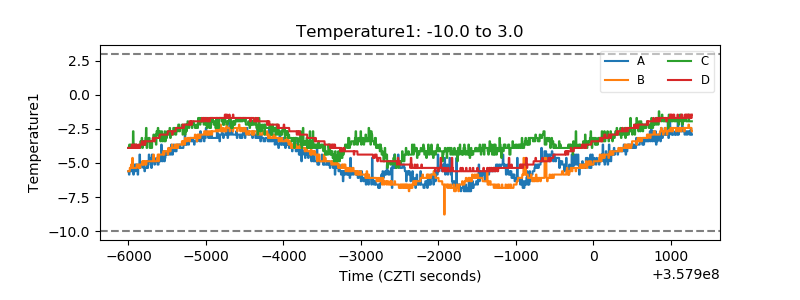 |
| Veto HV Monitor | 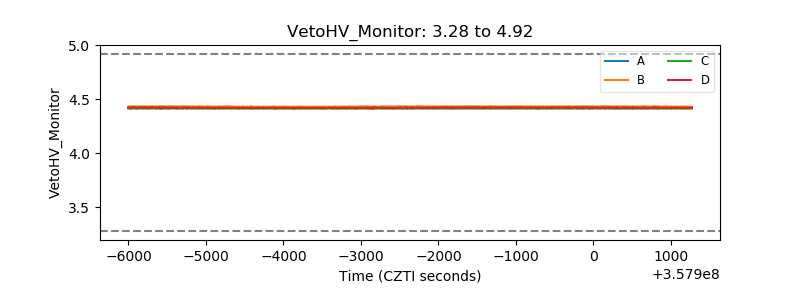 |
| Veto LLD | 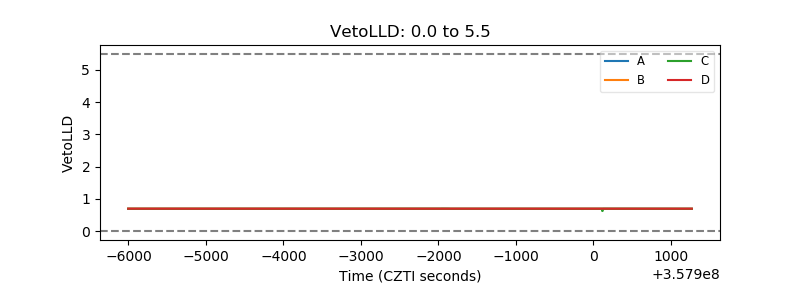 |
| Alpha Counter | 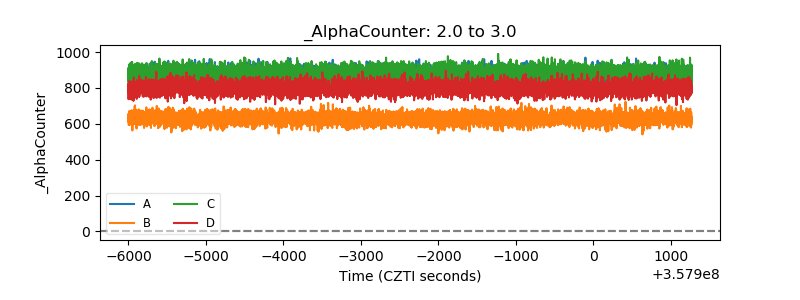 |
| _CPM_Rate | 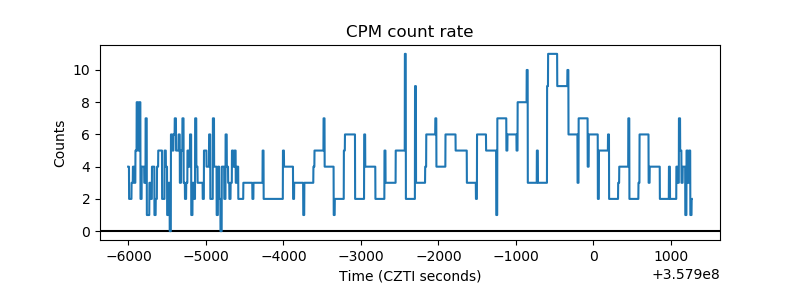 |
| CZT Counter | 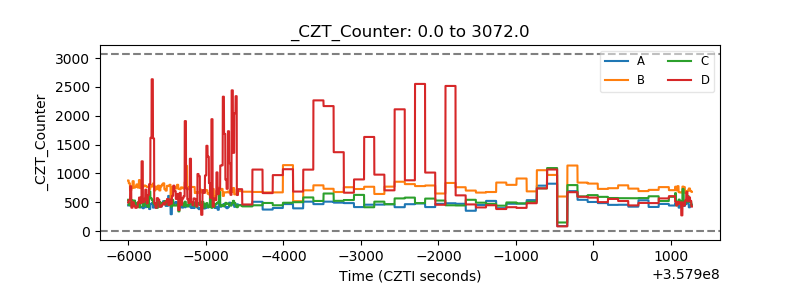 |
| +2.5 Volts monitor | 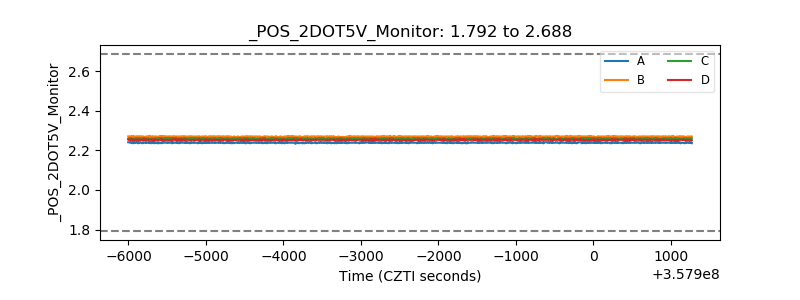 |
| +5 Volts monitor | 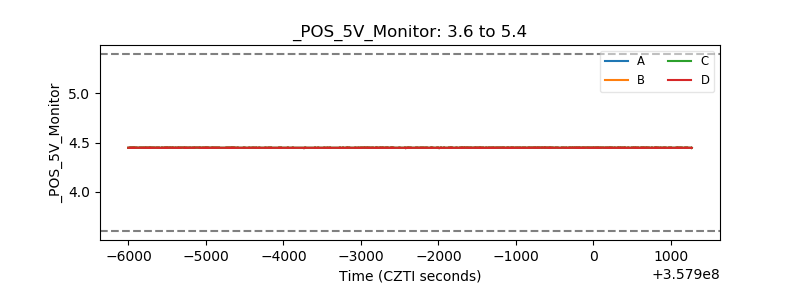 |
| _ROLL_ROT | 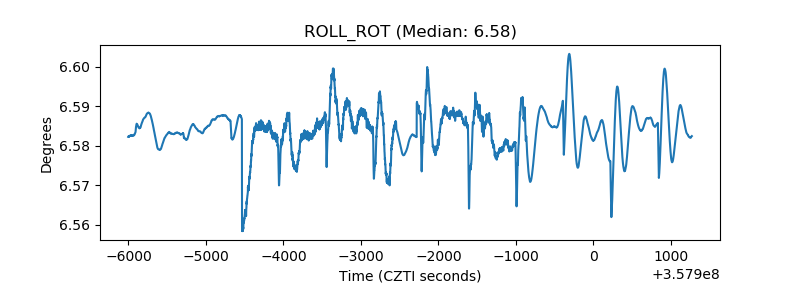 |
| _Roll_DEC | 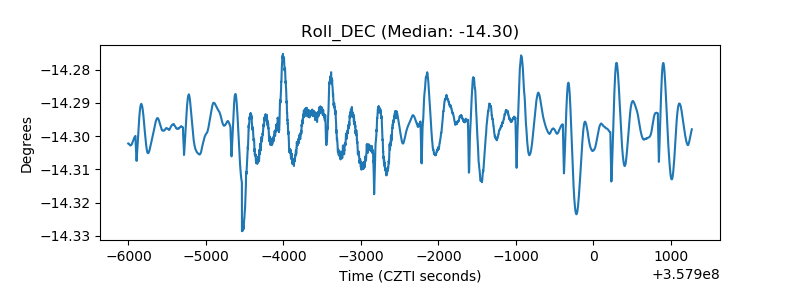 |
| _Roll_RA | 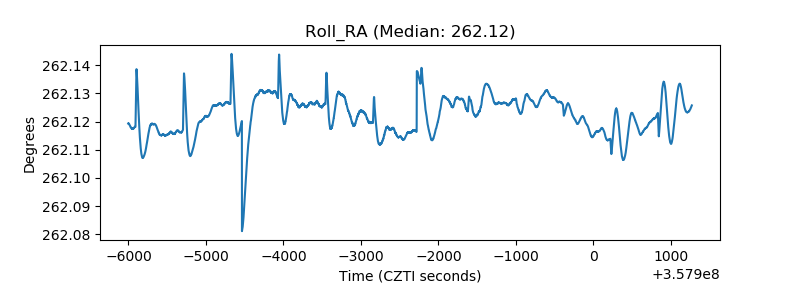 |
| Veto Counter | 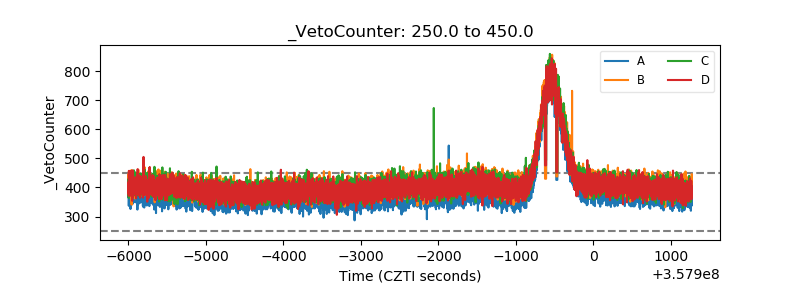 |