| Param | Original file | Final file |
|---|---|---|
| Filename | modeM0/AS1A10_007T01_9000004350_30290cztM0_level2.evt | modeM0/AS1A10_007T01_9000004350_30290cztM0_level2_quad_clean.evt |
| Size (bytes) | 1,493,196,480 | 214,064,640 |
| Size | 1.4 GB | 204.1 MB |
| Events in quadrant A | 8,691,040 | 1,318,708 |
| Events in quadrant B | 13,870,553 | 1,325,953 |
| Events in quadrant C | 9,842,485 | 1,291,914 |
| Events in quadrant D | 11,578,724 | 1,280,181 |
| Mode M9 | |||
|---|---|---|---|
| Quadrant | BADHDUFLAG | Total packets | Discarded packets |
| A | 0 | 17 | 0 |
| B | 0 | 17 | 0 |
| C | 0 | 17 | 0 |
| D | 0 | 17 | 0 |
| Mode SS | |||
|---|---|---|---|
| Quadrant | BADHDUFLAG | Total packets | Discarded packets |
| A | 0 | 374 | 0 |
| B | 0 | 374 | 0 |
| C | 0 | 374 | 0 |
| D | 0 | 374 | 0 |
| Mode M0 | |||
|---|---|---|---|
| Quadrant | BADHDUFLAG | Total packets | Discarded packets |
| A | 0 | 37672 | 3 |
| B | 0 | 55411 | 3 |
| C | 0 | 40262 | 3 |
| D | 0 | 46150 | 3 |
| Quadrant | Total seconds | Saturated seconds | Saturation percentage |
|---|---|---|---|
| A | 18371 | 222 | 1.208426% |
| B | 18371 | 350 | 1.905177% |
| C | 18370 | 663 | 3.609145% |
| D | 18371 | 607 | 3.304121% |
Noise dominated data is calculated using 1-second bins in cleaned event files. If a bin has >2000 counts, and if more than 50% of those come from <1% of pixels, then it is considered to be noise-dominated and hence unusable.
| Quadrant | # 1 sec bins | Bins with >0 counts | Bins with >2000 counts | High rate bins dominated by noise | Noise dominated (total time) | Noise dominated (detector-on time) | Marked lightcurve |
|---|---|---|---|---|---|---|---|
| A | 20096 | 18372 | 0 | 0 | 0.00% | 0.00% | 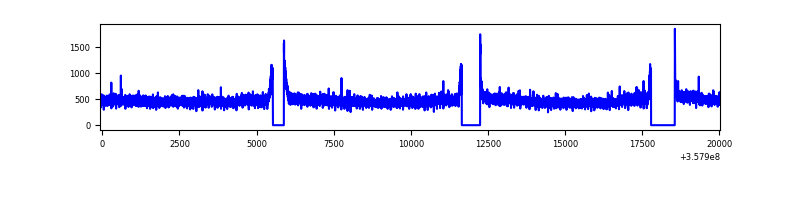 |
| B | 20096 | 18371 | 1 | 1 | 0.00% | 0.01% | 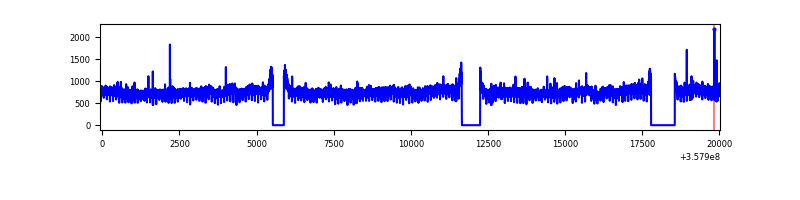 |
| C | 20095 | 18370 | 0 | 0 | 0.00% | 0.00% | 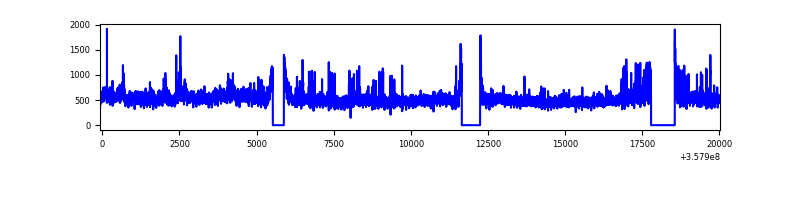 |
| D | 20096 | 18373 | 383 | 383 | 1.91% | 2.08% | 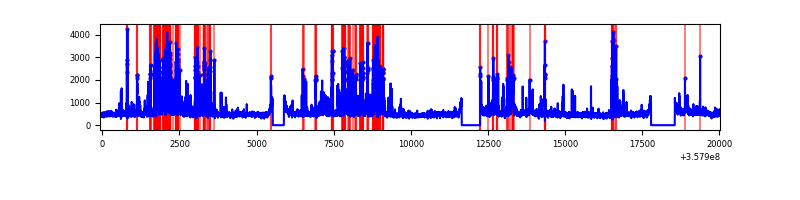 |
Top three noisy pixels from each quadrant. If the there are fewer than three noisy pixels in the level2.evt file, extra rows are filled as -1
| Pixel properties | Quadrant properties | ||||||
|---|---|---|---|---|---|---|---|
| Quadrant | DetID | PixID | Counts | Sigma | Mean | Median | Sigma |
| A | 13 | 254 | 32355 | 66.68 | 2241 | 2191 | 452.3 |
| A | 8 | 192 | 31621 | 65.06 | 2241 | 2191 | 452.3 |
| A | 3 | 137 | 23290 | 46.64 | 2241 | 2191 | 452.3 |
| B | 6 | 159 | 5124890 | 11959.79 | 2212 | 2150 | 428.3 |
| B | 12 | 111 | 54487 | 122.19 | 2212 | 2150 | 428.3 |
| B | 11 | 111 | 50381 | 112.6 | 2212 | 2150 | 428.3 |
| C | 3 | 233 | 815596 | 1622.1 | 2141 | 2153 | 501.5 |
| C | 14 | 238 | 456303 | 905.63 | 2141 | 2153 | 501.5 |
| C | 14 | 254 | 161787 | 318.33 | 2141 | 2153 | 501.5 |
| D | 2 | 250 | 1373967 | 2562.9 | 2163 | 2113 | 535.3 |
| D | 13 | 104 | 856493 | 1596.15 | 2163 | 2113 | 535.3 |
| D | 8 | 195 | 401337 | 745.83 | 2163 | 2113 | 535.3 |
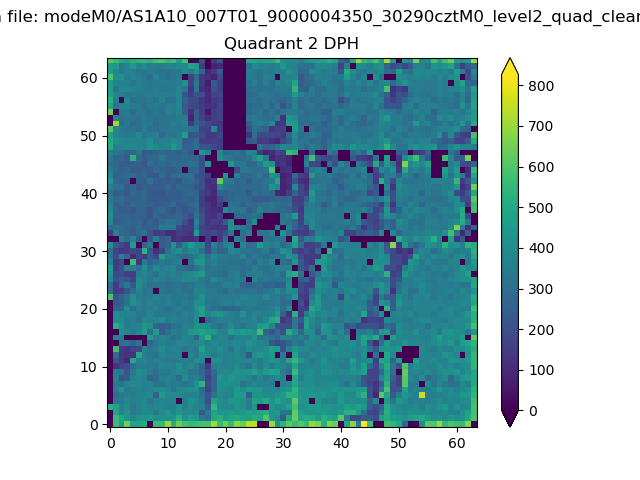
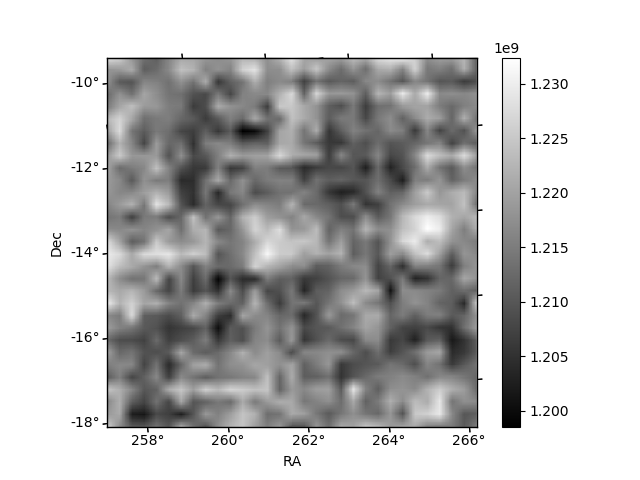
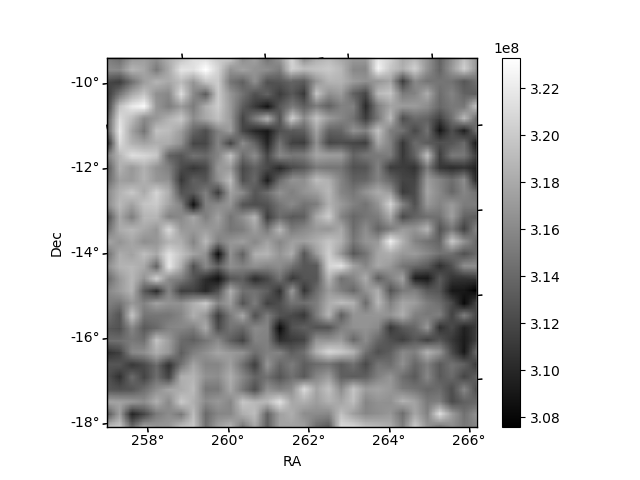
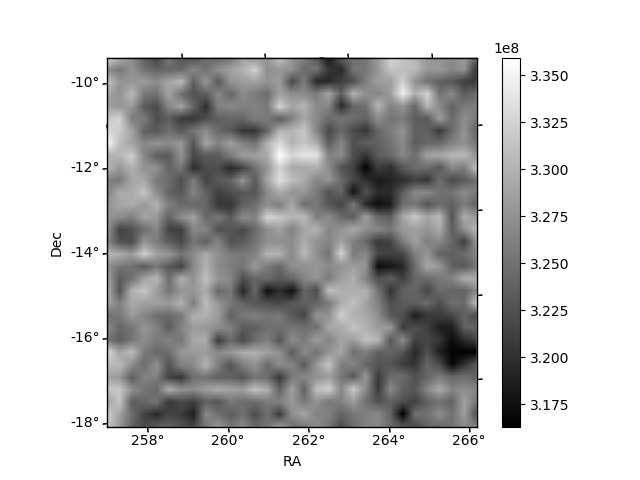
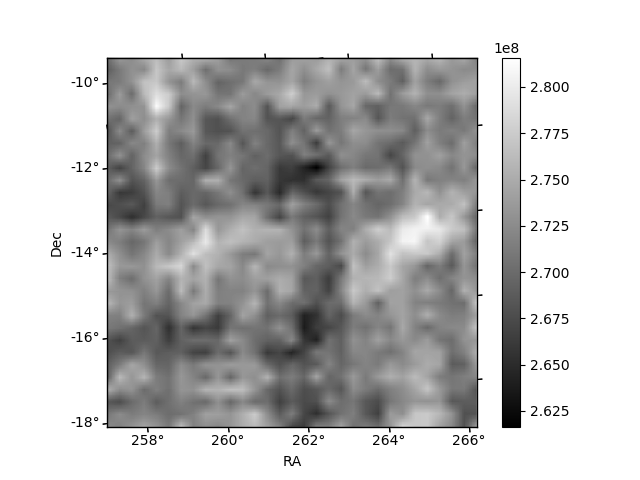
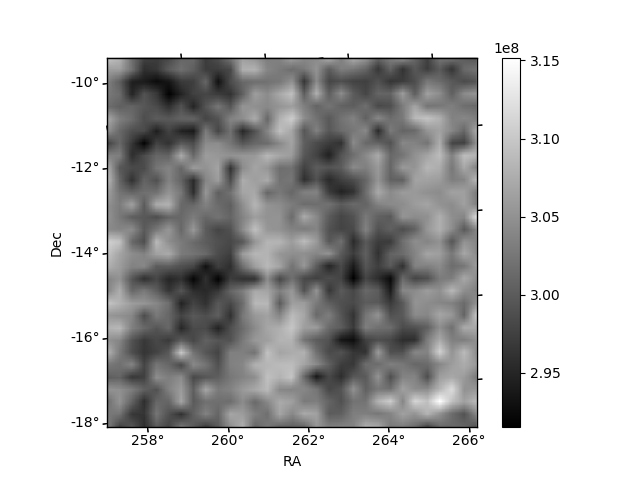
Histogram calculated using DETX and DETY for each event in the final _common_clean file
| Quadrant A | 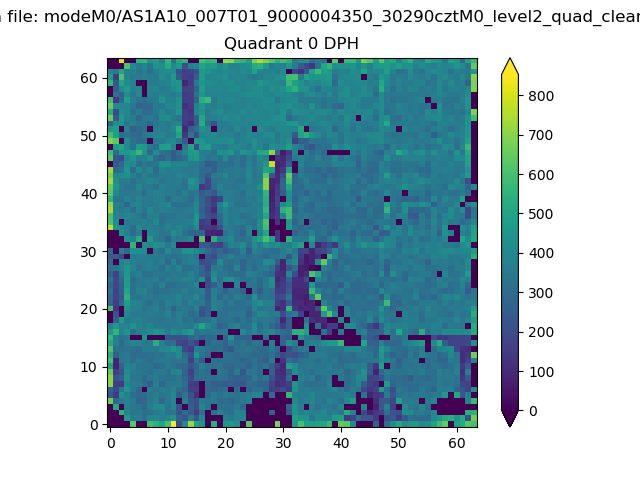 |
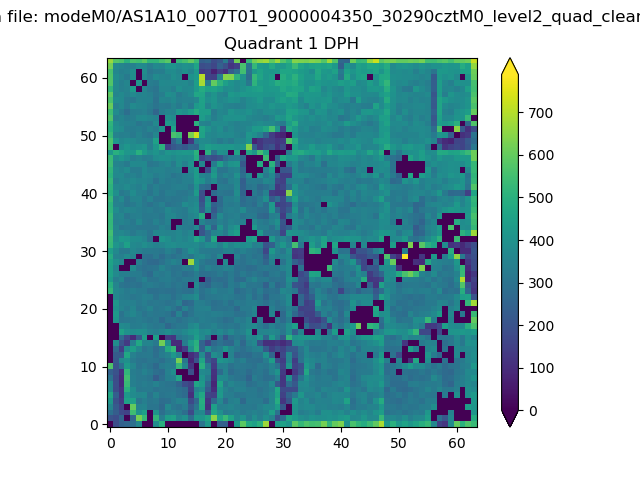 |
Quadrant B |
|---|---|---|---|
| Quadrant D | 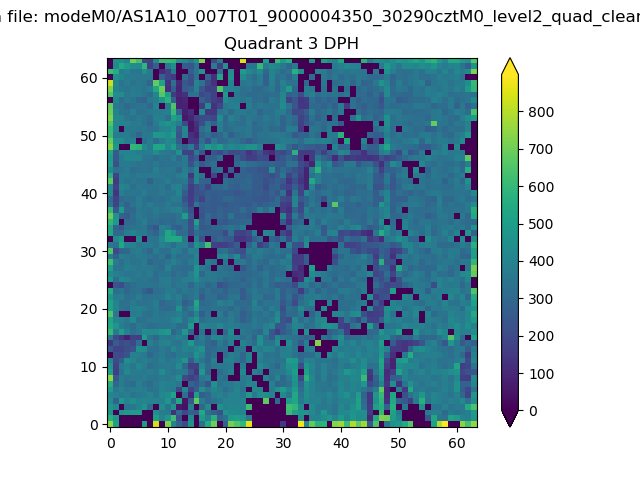 |
 |
Quadrant C |
| Plot type | Count rate plots | Images |
|---|---|---|
| Comparison with Poisson distribution Blue bars denote a histogram of data divided into 1 sec bins. Red curve is a Poisson curve with rate = median count rate of data. |
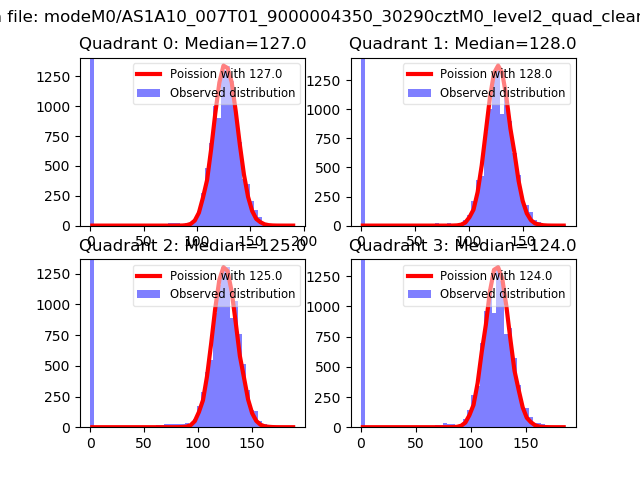 |
 |
| Quadrant-wise count rates Data is divided into 100 sec bins |
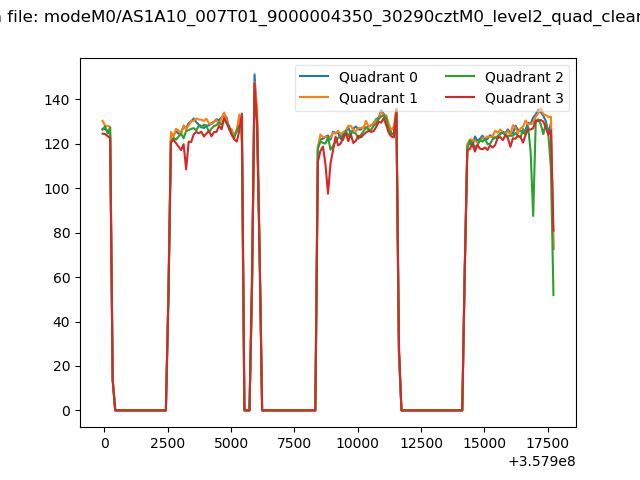 |
|
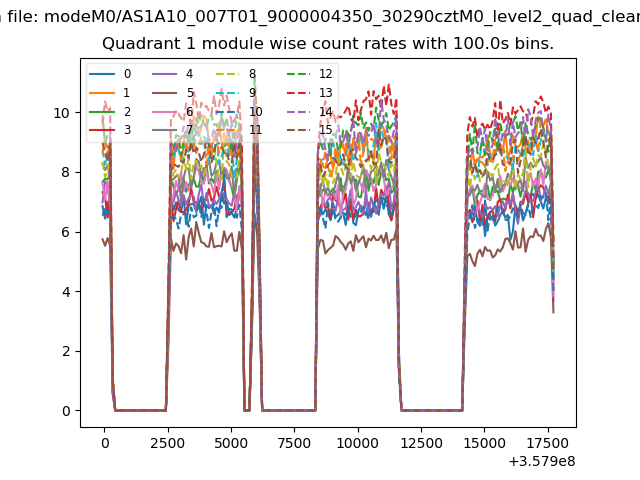
| Module-wise count rates for Quadrant A Data is divided into 100 sec bins |
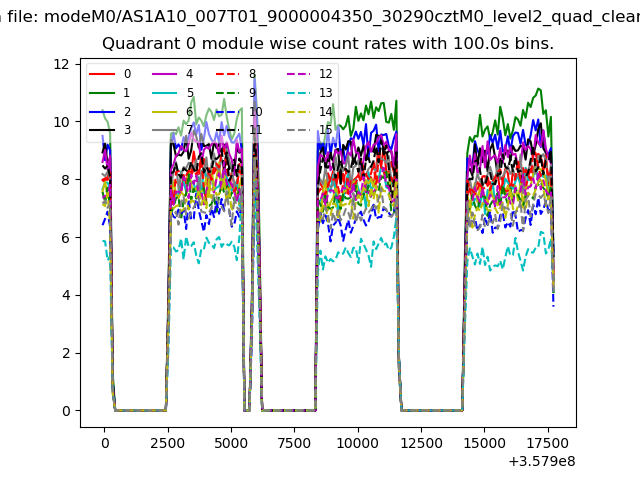 |
 |
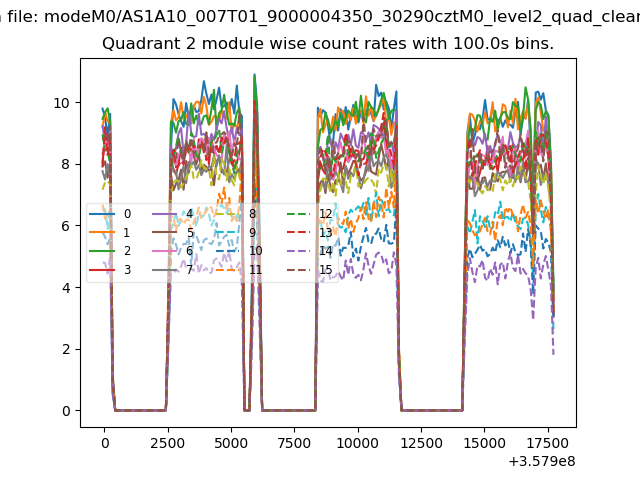
| Module-wise count rates for Quadrant B Data is divided into 100 sec bins |
 |
 |
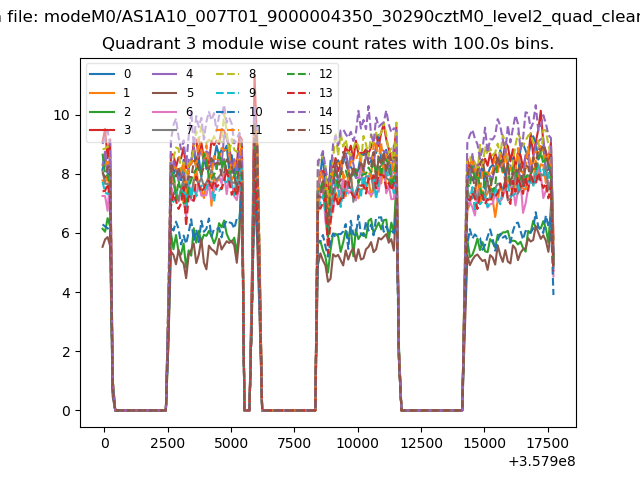
| Module-wise count rates for Quadrant C Data is divided into 100 sec bins |
 |
 |
| Module-wise count rates for Quadrant D Data is divided into 100 sec bins |
 |
 |
| Parameter | Plot |
|---|---|
| CZT HV Monitor | 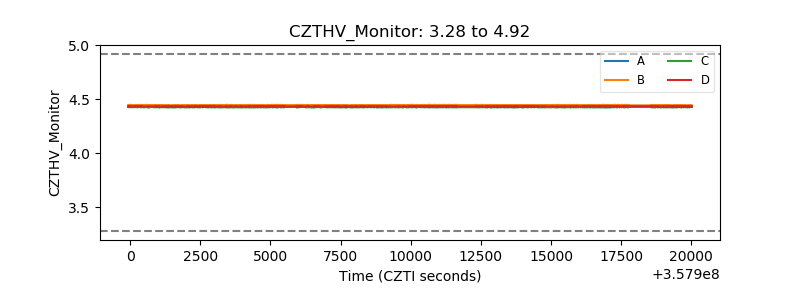 |
| D_VDD | 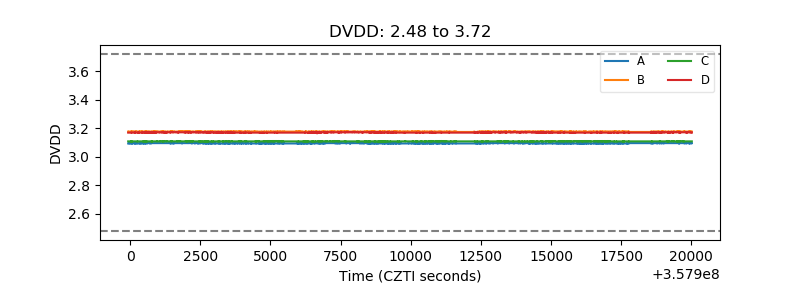 |
| Temperature 1 | 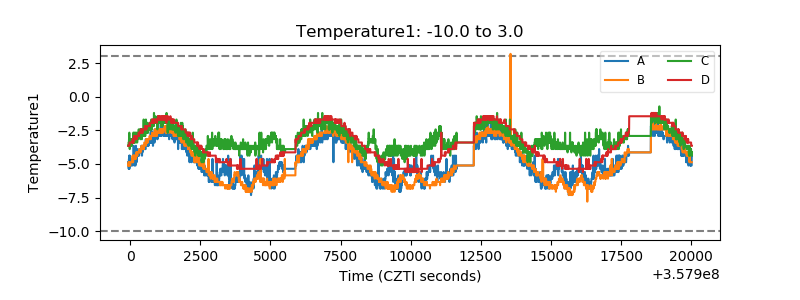 |
| Veto HV Monitor |  |
| Veto LLD | 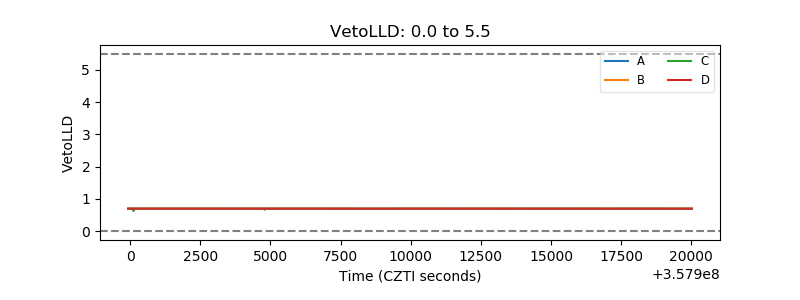 |
| Alpha Counter | 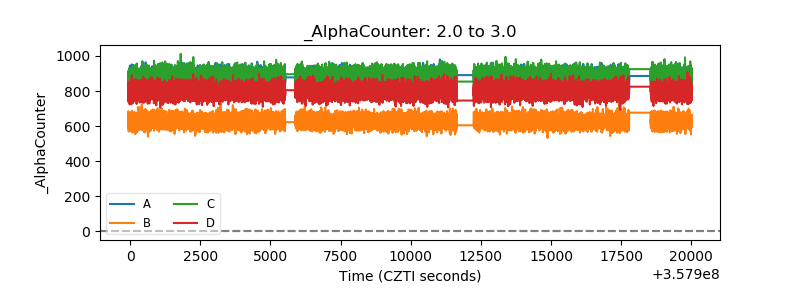 |
| _CPM_Rate |  |
| CZT Counter | 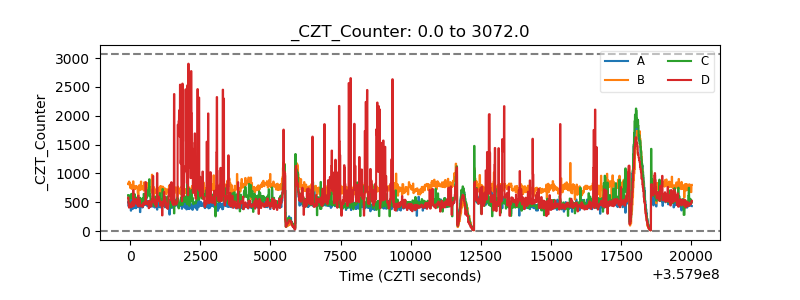 |
| +2.5 Volts monitor |  |
| +5 Volts monitor |  |
| _ROLL_ROT |  |
| _Roll_DEC | 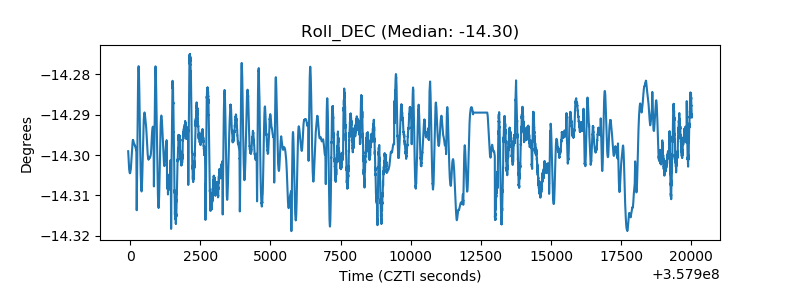 |
| _Roll_RA | 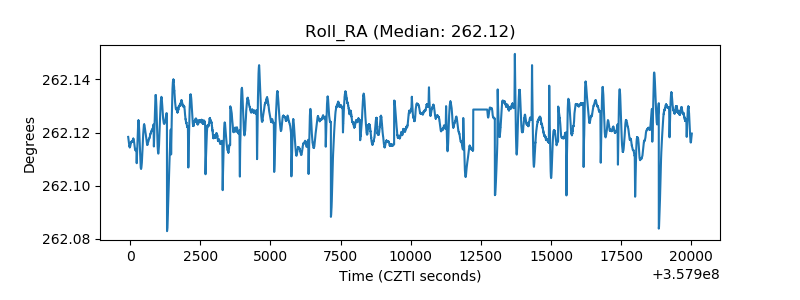 |
| Veto Counter |  |