| Param | Original file | Final file |
|---|---|---|
| Filename | modeM0/AS1A10_007T01_9000004350_30293cztM0_level2.evt | modeM0/AS1A10_007T01_9000004350_30293cztM0_level2_quad_clean.evt |
| Size (bytes) | 601,871,040 | 88,349,760 |
| Size | 574.0 MB | 84.3 MB |
| Events in quadrant A | 3,254,710 | 563,939 |
| Events in quadrant B | 5,158,461 | 566,558 |
| Events in quadrant C | 4,577,872 | 549,792 |
| Events in quadrant D | 4,797,552 | 542,237 |
| Mode M9 | |||
|---|---|---|---|
| Quadrant | BADHDUFLAG | Total packets | Discarded packets |
| A | 0 | 17 | 0 |
| B | 0 | 18 | 0 |
| C | 0 | 18 | 0 |
| D | 0 | 18 | 0 |
| Mode SS | |||
|---|---|---|---|
| Quadrant | BADHDUFLAG | Total packets | Discarded packets |
| A | 0 | 132 | 0 |
| B | 0 | 132 | 0 |
| C | 0 | 132 | 0 |
| D | 0 | 132 | 0 |
| Mode M0 | |||
|---|---|---|---|
| Quadrant | BADHDUFLAG | Total packets | Discarded packets |
| A | 0 | 13830 | 2 |
| B | 0 | 19802 | 2 |
| C | 0 | 18056 | 2 |
| D | 0 | 18595 | 2 |
| Quadrant | Total seconds | Saturated seconds | Saturation percentage |
|---|---|---|---|
| A | 6494 | 62 | 0.954727% |
| B | 6494 | 118 | 1.817062% |
| C | 6494 | 191 | 2.941176% |
| D | 6493 | 326 | 5.020792% |
Noise dominated data is calculated using 1-second bins in cleaned event files. If a bin has >2000 counts, and if more than 50% of those come from <1% of pixels, then it is considered to be noise-dominated and hence unusable.
| Quadrant | # 1 sec bins | Bins with >0 counts | Bins with >2000 counts | High rate bins dominated by noise | Noise dominated (total time) | Noise dominated (detector-on time) | Marked lightcurve |
|---|---|---|---|---|---|---|---|
| A | 7594 | 6495 | 0 | 0 | 0.00% | 0.00% | 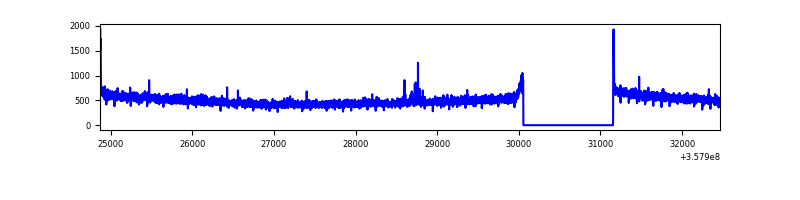 |
| B | 7594 | 6494 | 0 | 0 | 0.00% | 0.00% | 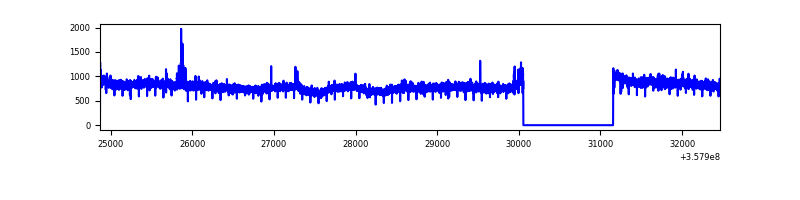 |
| C | 7594 | 6495 | 24 | 24 | 0.32% | 0.37% | 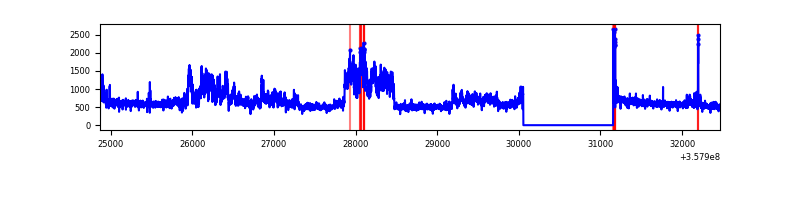 |
| D | 7593 | 6493 | 195 | 195 | 2.57% | 3.00% | 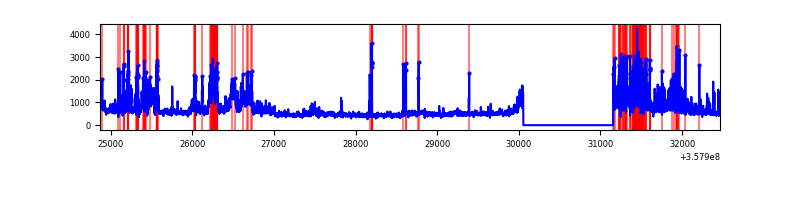 |
Top three noisy pixels from each quadrant. If the there are fewer than three noisy pixels in the level2.evt file, extra rows are filled as -1
| Pixel properties | Quadrant properties | ||||||
|---|---|---|---|---|---|---|---|
| Quadrant | DetID | PixID | Counts | Sigma | Mean | Median | Sigma |
| A | 8 | 192 | 22820 | 131.19 | 833 | 818 | 167.7 |
| A | 14 | 239 | 17555 | 99.8 | 833 | 818 | 167.7 |
| A | 13 | 254 | 12359 | 68.82 | 833 | 818 | 167.7 |
| B | 6 | 159 | 1864992 | 11721.85 | 831 | 811 | 159.0 |
| B | 12 | 111 | 19293 | 116.21 | 831 | 811 | 159.0 |
| B | 11 | 111 | 17770 | 106.64 | 831 | 811 | 159.0 |
| C | 3 | 233 | 1221453 | 6490.56 | 805 | 811 | 188.1 |
| C | 14 | 238 | 133838 | 707.35 | 805 | 811 | 188.1 |
| C | 0 | 10 | 63090 | 331.16 | 805 | 811 | 188.1 |
| D | 1 | 52 | 503191 | 2482.6 | 798 | 781 | 202.4 |
| D | 13 | 104 | 448267 | 2211.2 | 798 | 781 | 202.4 |
| D | 8 | 195 | 321102 | 1582.83 | 798 | 781 | 202.4 |
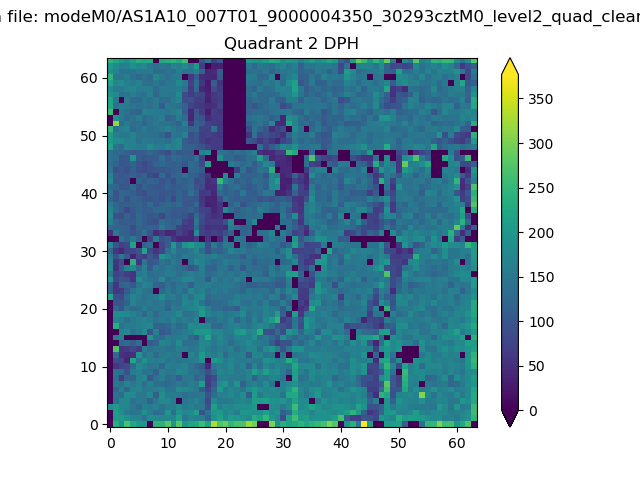
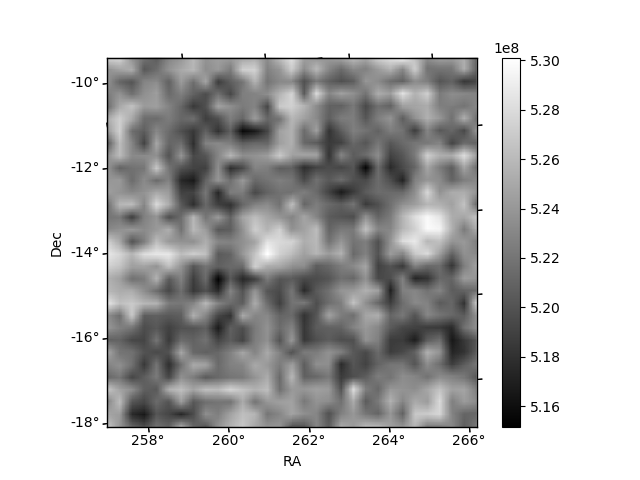
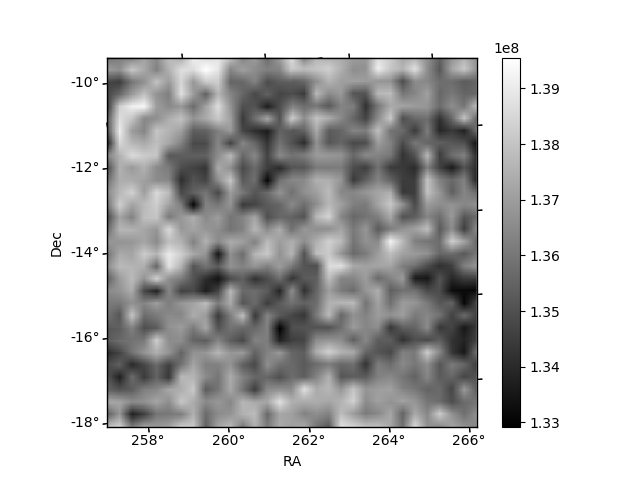
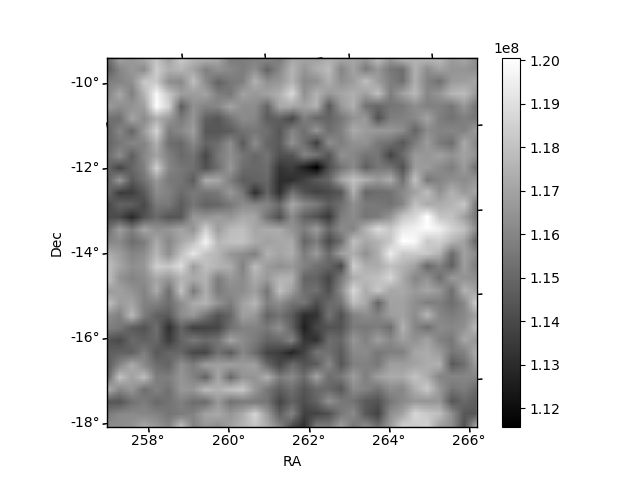
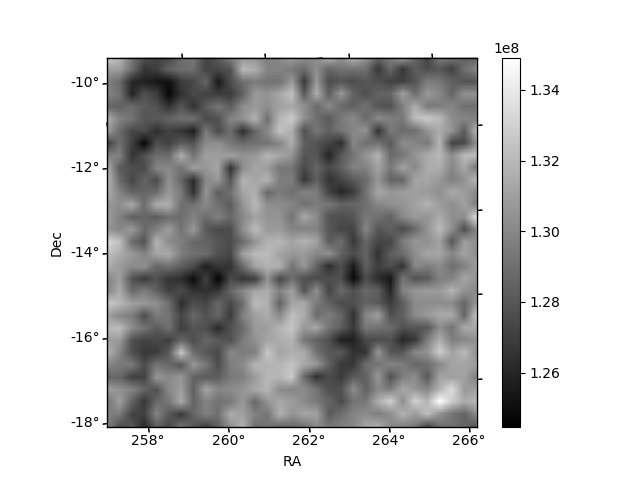
Histogram calculated using DETX and DETY for each event in the final _common_clean file
| Quadrant A | 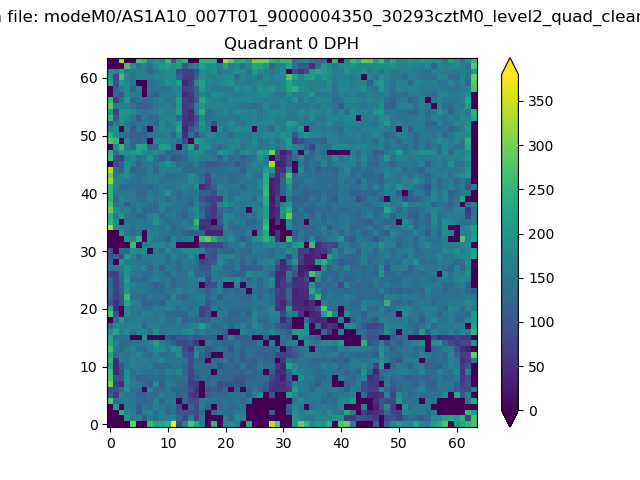 |
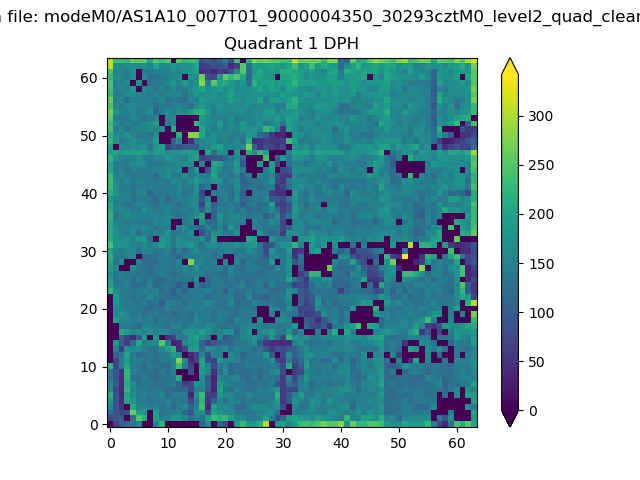 |
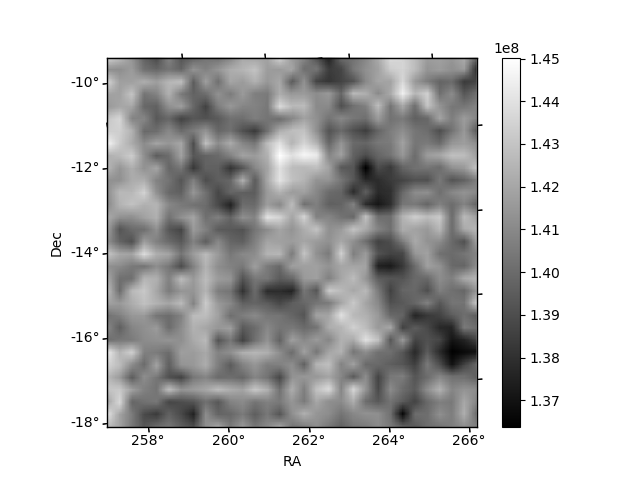
Quadrant B |
|---|---|---|---|
| Quadrant D | 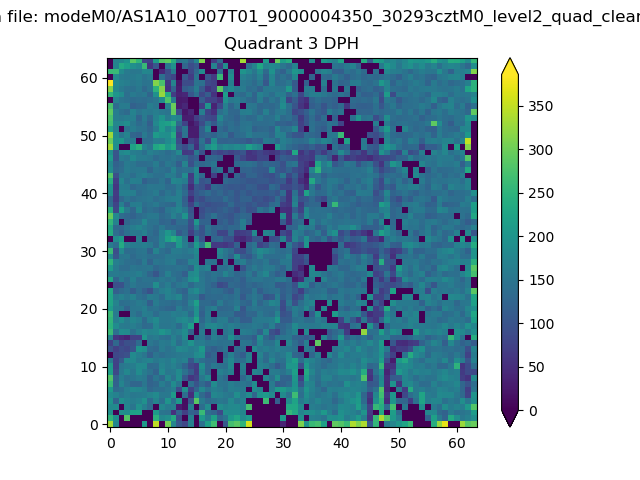 |
 |
Quadrant C |
| Plot type | Count rate plots | Images |
|---|---|---|
| Comparison with Poisson distribution Blue bars denote a histogram of data divided into 1 sec bins. Red curve is a Poisson curve with rate = median count rate of data. |
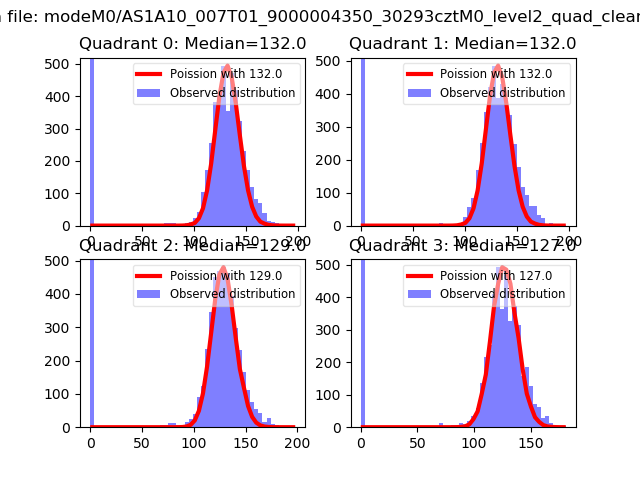 |
 |
| Quadrant-wise count rates Data is divided into 100 sec bins |
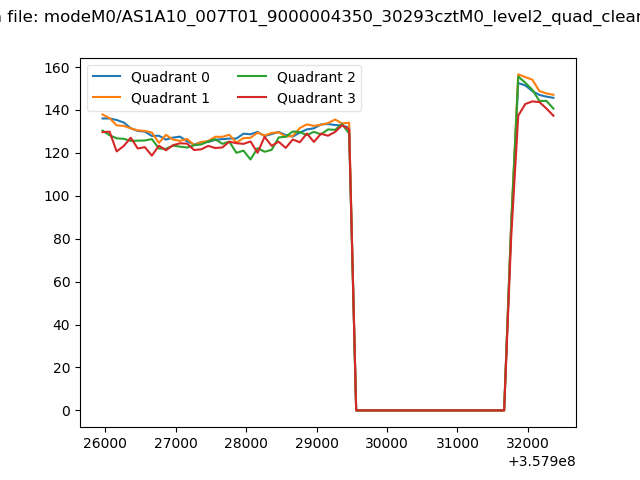 |
|
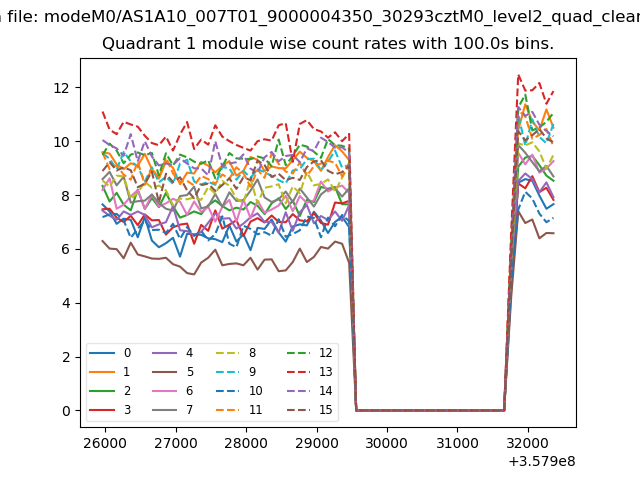
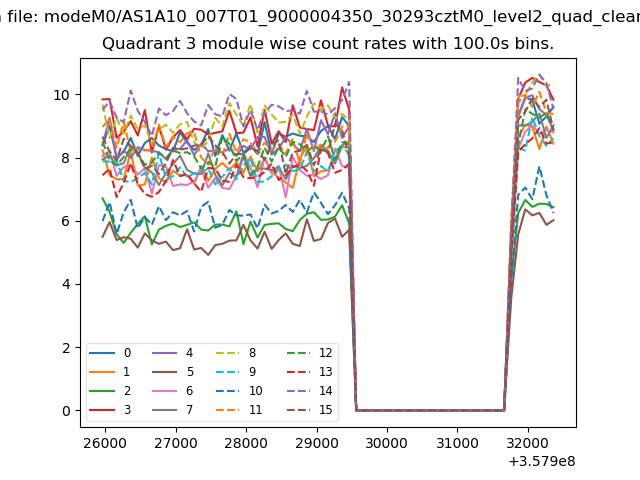
| Module-wise count rates for Quadrant A Data is divided into 100 sec bins |
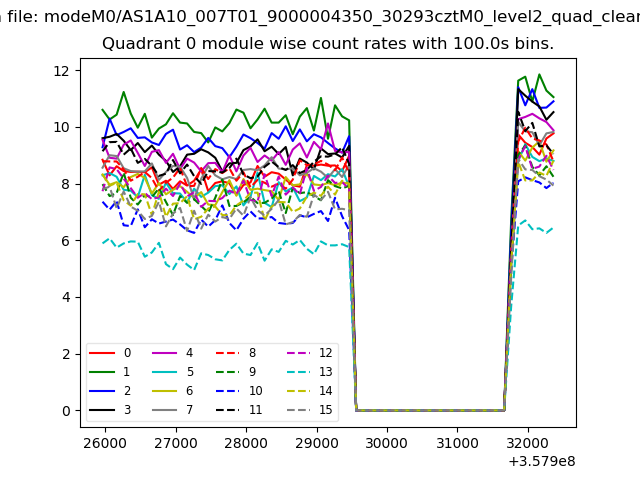 |
 |
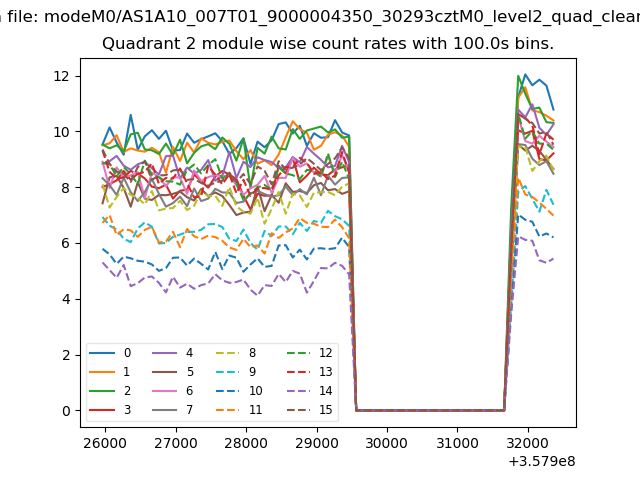
| Module-wise count rates for Quadrant B Data is divided into 100 sec bins |
 |
 |
| Module-wise count rates for Quadrant C Data is divided into 100 sec bins |
 |
 |
| Module-wise count rates for Quadrant D Data is divided into 100 sec bins |
 |
 |
| Parameter | Plot |
|---|---|
| CZT HV Monitor | 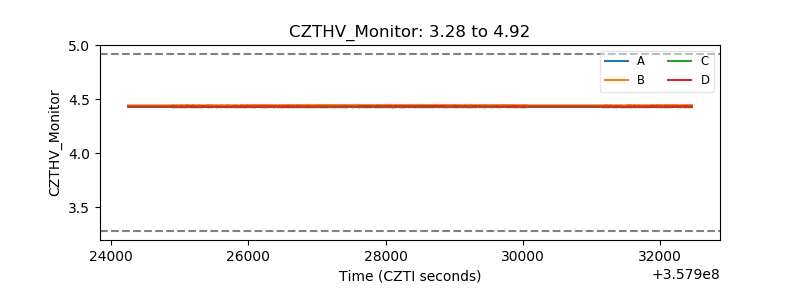 |
| D_VDD | 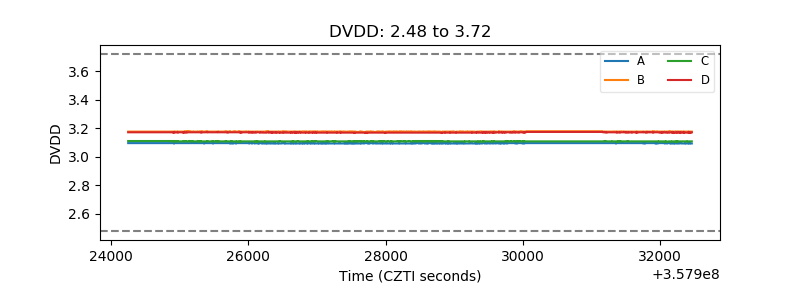 |
| Temperature 1 | 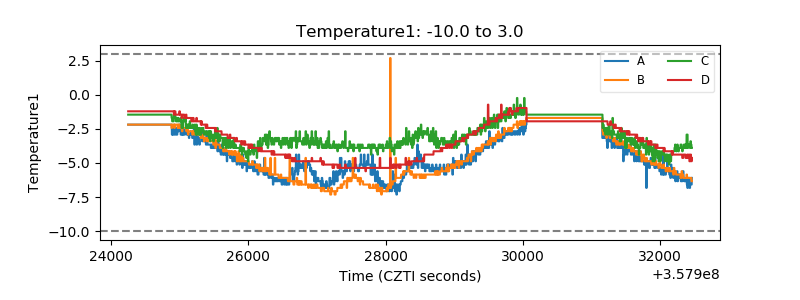 |
| Veto HV Monitor | 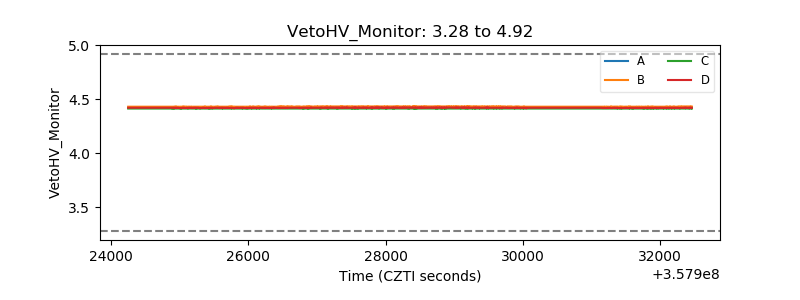 |
| Veto LLD | 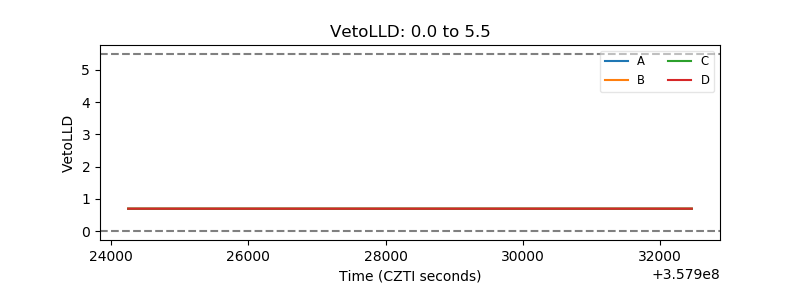 |
| Alpha Counter |  |
| _CPM_Rate | 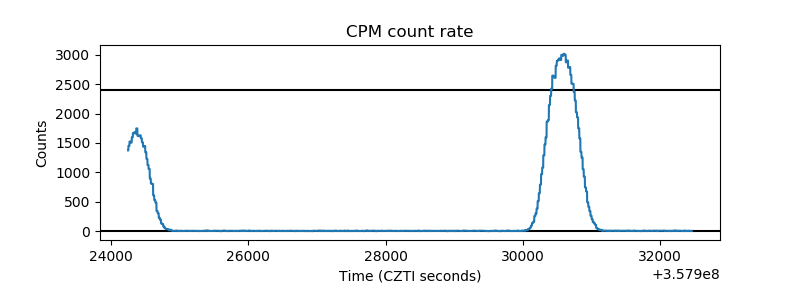 |
| CZT Counter | 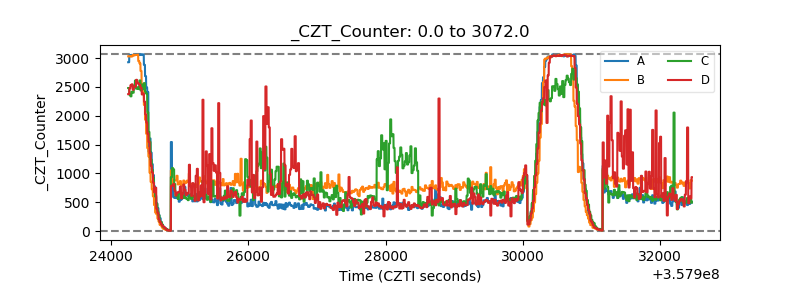 |
| +2.5 Volts monitor | 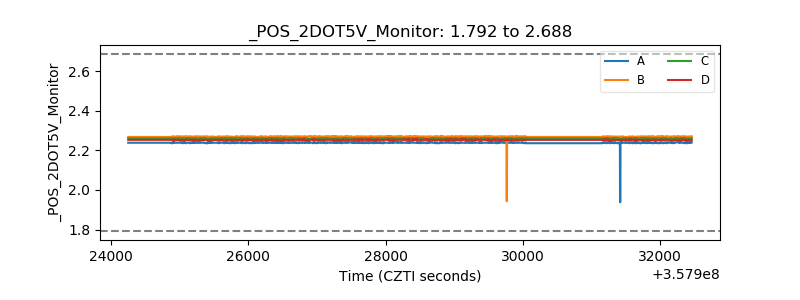 |
| +5 Volts monitor | 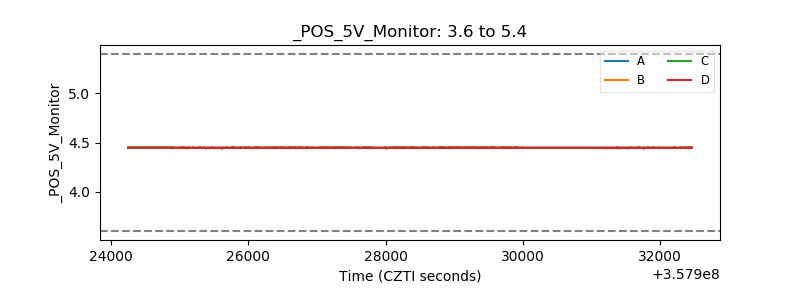 |
| _ROLL_ROT | 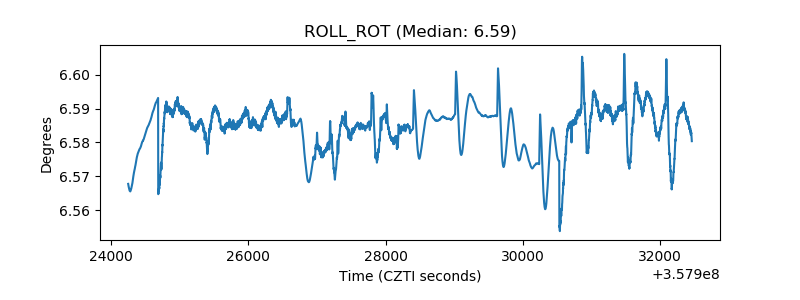 |
| _Roll_DEC | 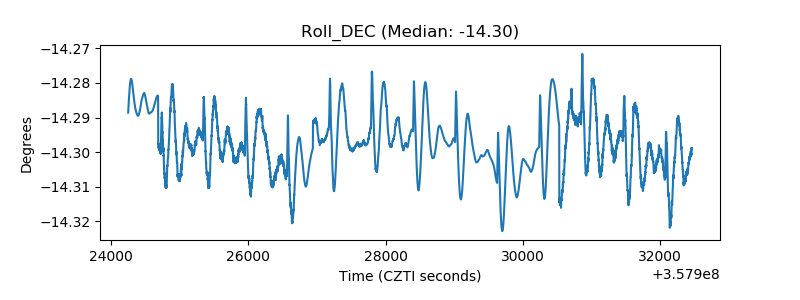 |
| _Roll_RA | 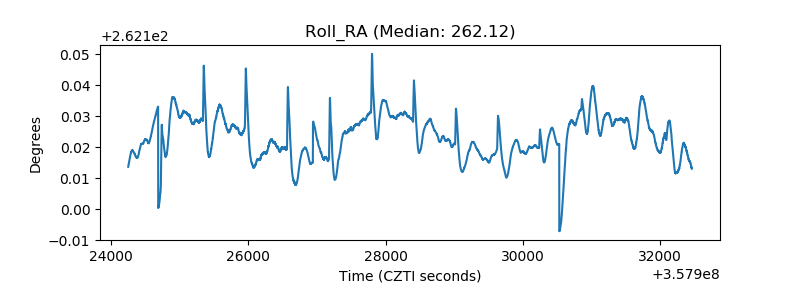 |
| Veto Counter | 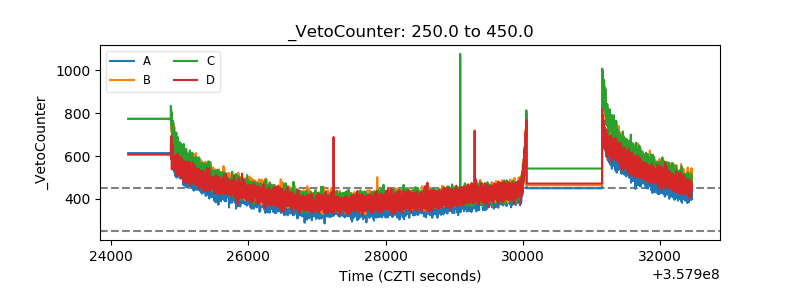 |