| Param | Original file | Final file |
|---|---|---|
| Filename | modeM0/AS1A10_007T01_9000004350_30295cztM0_level2.evt | modeM0/AS1A10_007T01_9000004350_30295cztM0_level2_quad_clean.evt |
| Size (bytes) | 580,423,680 | 101,206,080 |
| Size | 553.5 MB | 96.5 MB |
| Events in quadrant A | 3,161,153 | 666,324 |
| Events in quadrant B | 5,076,212 | 679,983 |
| Events in quadrant C | 3,725,700 | 663,155 |
| Events in quadrant D | 5,194,648 | 621,760 |
| Mode M9 | |||
|---|---|---|---|
| Quadrant | BADHDUFLAG | Total packets | Discarded packets |
| A | 0 | 12 | 0 |
| B | 0 | 12 | 0 |
| C | 0 | 12 | 0 |
| D | 0 | 12 | 0 |
| Mode SS | |||
|---|---|---|---|
| Quadrant | BADHDUFLAG | Total packets | Discarded packets |
| A | 0 | 126 | 0 |
| B | 0 | 126 | 0 |
| C | 0 | 126 | 0 |
| D | 0 | 126 | 0 |
| Mode M0 | |||
|---|---|---|---|
| Quadrant | BADHDUFLAG | Total packets | Discarded packets |
| A | 0 | 13399 | 1 |
| B | 0 | 19234 | 1 |
| C | 0 | 14965 | 1 |
| D | 0 | 19660 | 1 |
| Quadrant | Total seconds | Saturated seconds | Saturation percentage |
|---|---|---|---|
| A | 6216 | 37 | 0.595238% |
| B | 6216 | 109 | 1.753539% |
| C | 6216 | 132 | 2.123552% |
| D | 6216 | 548 | 8.815959% |
Noise dominated data is calculated using 1-second bins in cleaned event files. If a bin has >2000 counts, and if more than 50% of those come from <1% of pixels, then it is considered to be noise-dominated and hence unusable.
| Quadrant | # 1 sec bins | Bins with >0 counts | Bins with >2000 counts | High rate bins dominated by noise | Noise dominated (total time) | Noise dominated (detector-on time) | Marked lightcurve |
|---|---|---|---|---|---|---|---|
| A | 7446 | 6217 | 2 | 2 | 0.03% | 0.03% | 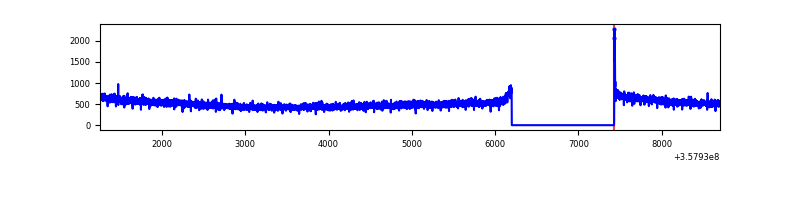 |
| B | 7446 | 6217 | 1 | 1 | 0.01% | 0.02% | 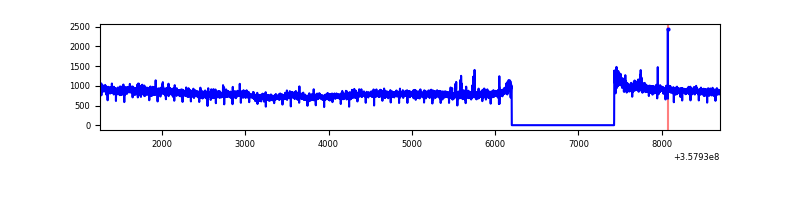 |
| C | 7446 | 6217 | 8 | 8 | 0.11% | 0.13% | 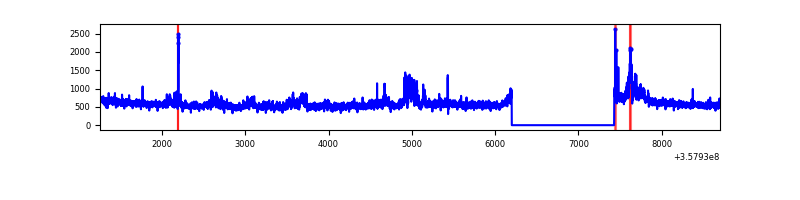 |
| D | 7446 | 6217 | 397 | 397 | 5.33% | 6.39% | 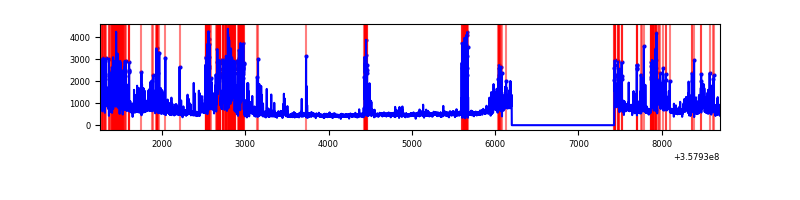 |
Top three noisy pixels from each quadrant. If the there are fewer than three noisy pixels in the level2.evt file, extra rows are filled as -1
| Pixel properties | Quadrant properties | ||||||
|---|---|---|---|---|---|---|---|
| Quadrant | DetID | PixID | Counts | Sigma | Mean | Median | Sigma |
| A | 8 | 192 | 13540 | 78.36 | 814 | 798 | 162.6 |
| A | 13 | 254 | 11856 | 68.01 | 814 | 798 | 162.6 |
| A | 14 | 239 | 8410 | 46.81 | 814 | 798 | 162.6 |
| B | 6 | 159 | 1812915 | 11720.34 | 819 | 798 | 154.6 |
| B | 0 | 190 | 27722 | 174.14 | 819 | 798 | 154.6 |
| B | 6 | 36 | 25187 | 157.74 | 819 | 798 | 154.6 |
| C | 3 | 233 | 414831 | 2213.2 | 799 | 807 | 187.1 |
| C | 14 | 238 | 138322 | 735.1 | 799 | 807 | 187.1 |
| C | 0 | 10 | 31353 | 163.29 | 799 | 807 | 187.1 |
| D | 1 | 52 | 1090699 | 5713.31 | 766 | 752 | 190.8 |
| D | 13 | 104 | 620914 | 3250.78 | 766 | 752 | 190.8 |
| D | 8 | 195 | 164376 | 857.69 | 766 | 752 | 190.8 |
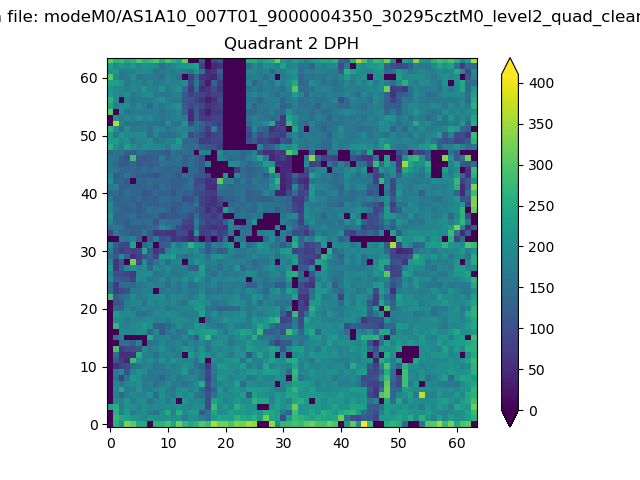
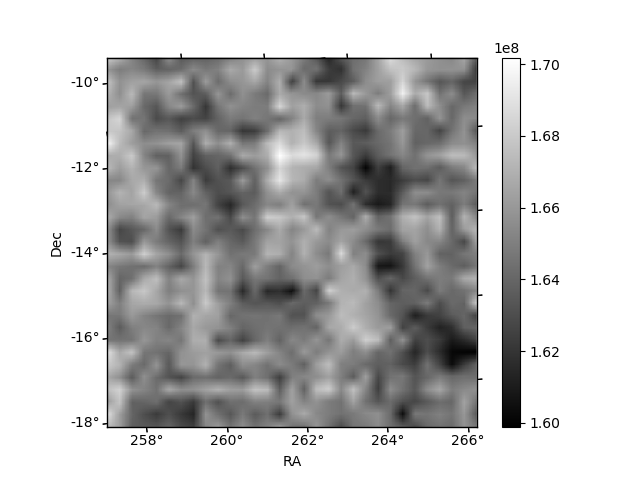
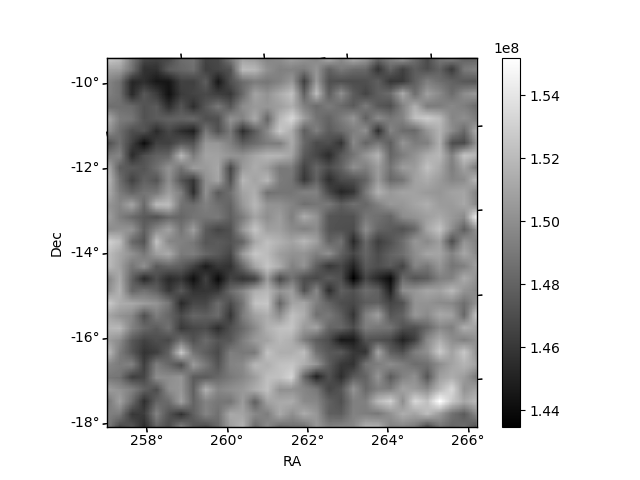
Histogram calculated using DETX and DETY for each event in the final _common_clean file
| Quadrant A | 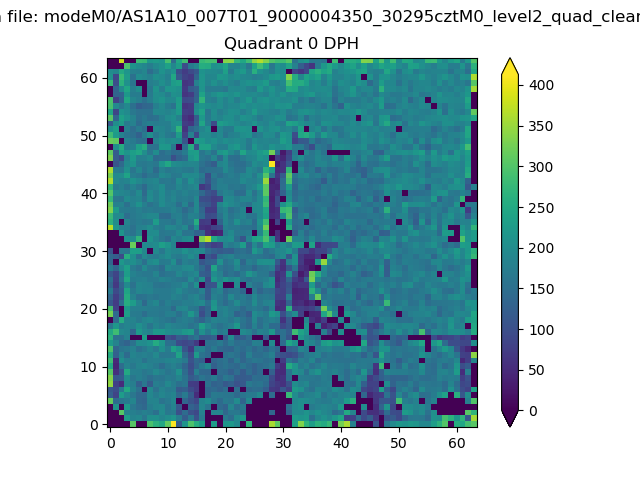 |
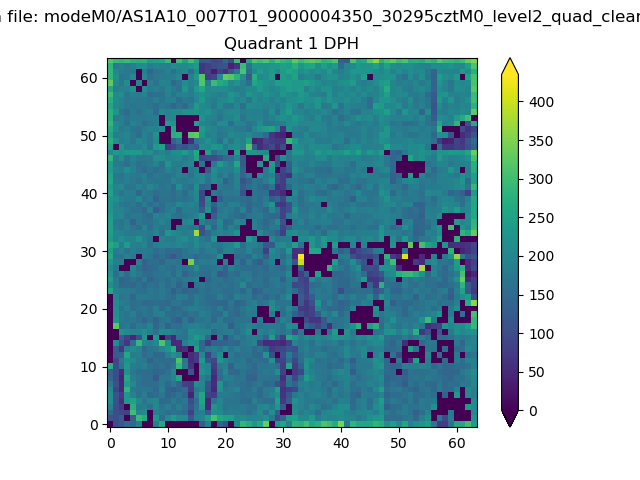 |
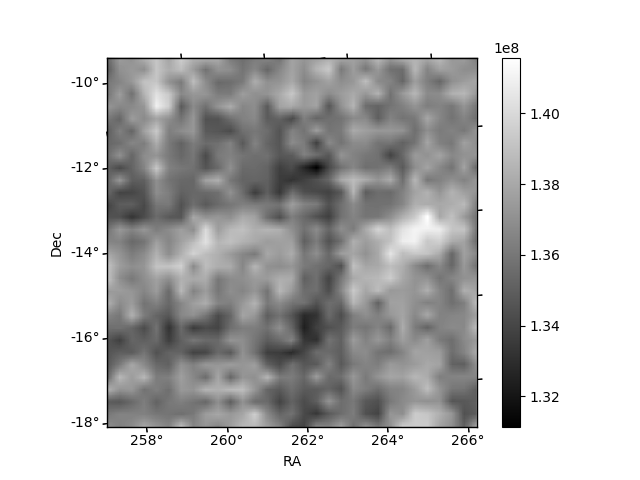
Quadrant B |
|---|---|---|---|
| Quadrant D | 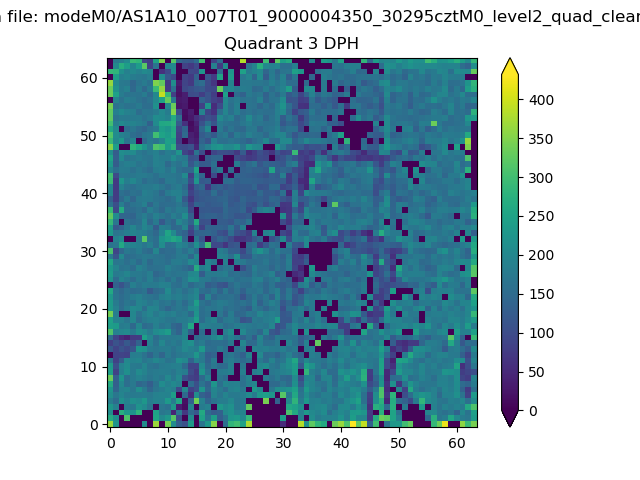 |
 |
Quadrant C |
| Plot type | Count rate plots | Images |
|---|---|---|
| Comparison with Poisson distribution Blue bars denote a histogram of data divided into 1 sec bins. Red curve is a Poisson curve with rate = median count rate of data. |
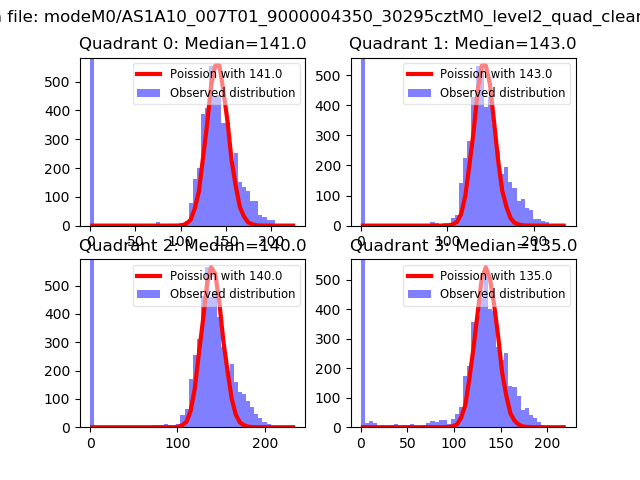 |
 |
| Quadrant-wise count rates Data is divided into 100 sec bins |
 |
|
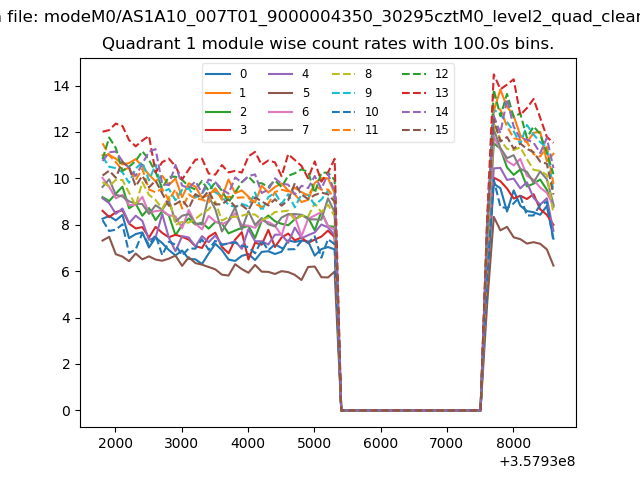
| Module-wise count rates for Quadrant A Data is divided into 100 sec bins |
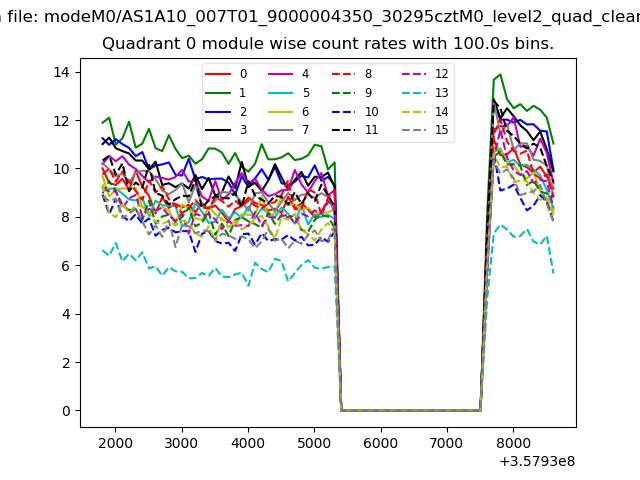 |
 |
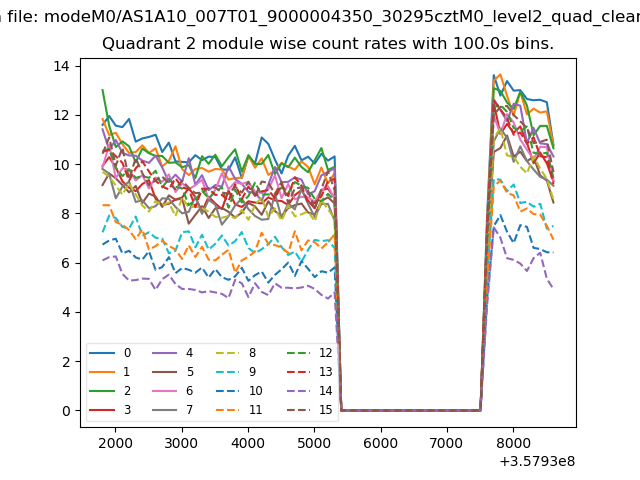
| Module-wise count rates for Quadrant B Data is divided into 100 sec bins |
 |
 |
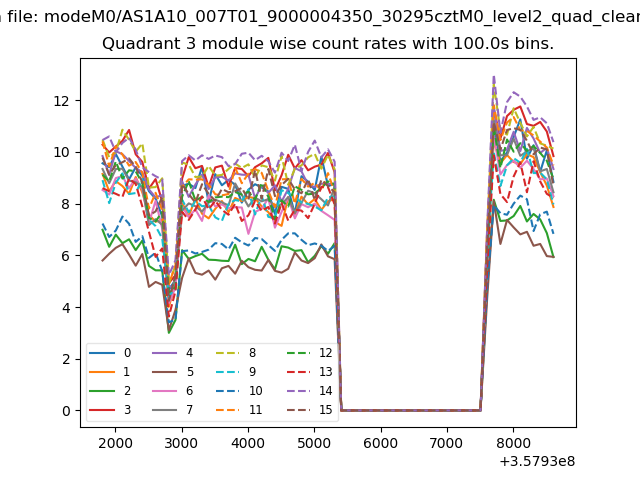
| Module-wise count rates for Quadrant C Data is divided into 100 sec bins |
 |
 |
| Module-wise count rates for Quadrant D Data is divided into 100 sec bins |
 |
 |
| Parameter | Plot |
|---|---|
| CZT HV Monitor | 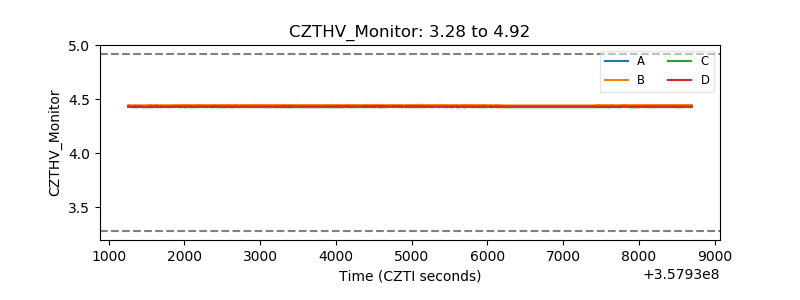 |
| D_VDD | 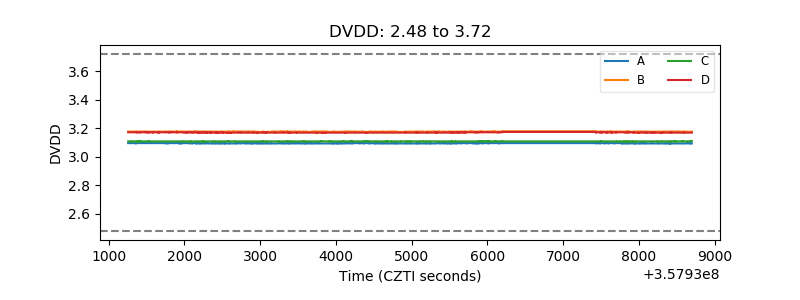 |
| Temperature 1 | 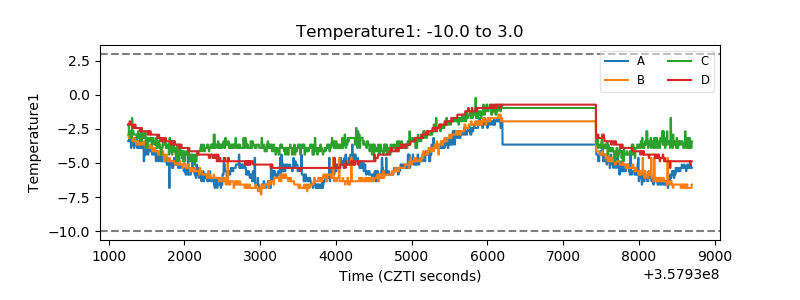 |
| Veto HV Monitor |  |
| Veto LLD | 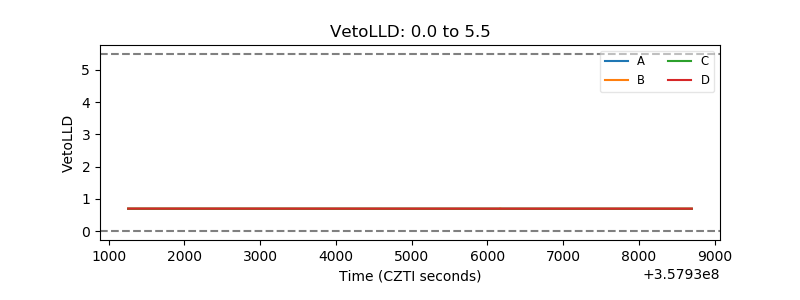 |
| Alpha Counter |  |
| _CPM_Rate | 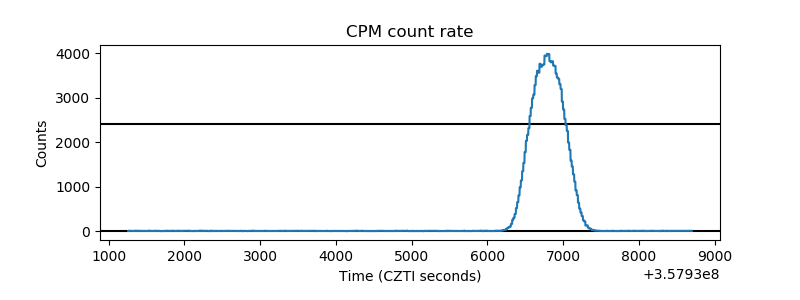 |
| CZT Counter | 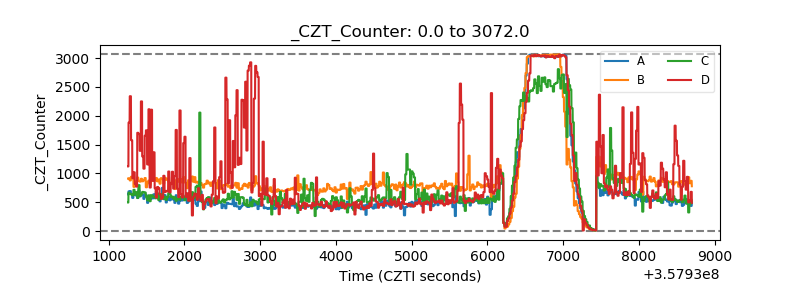 |
| +2.5 Volts monitor | 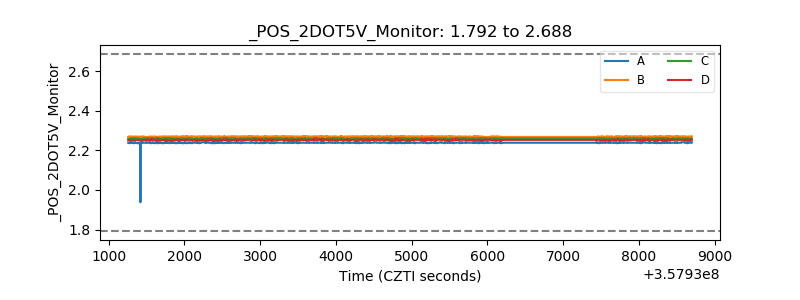 |
| +5 Volts monitor |  |
| _ROLL_ROT | 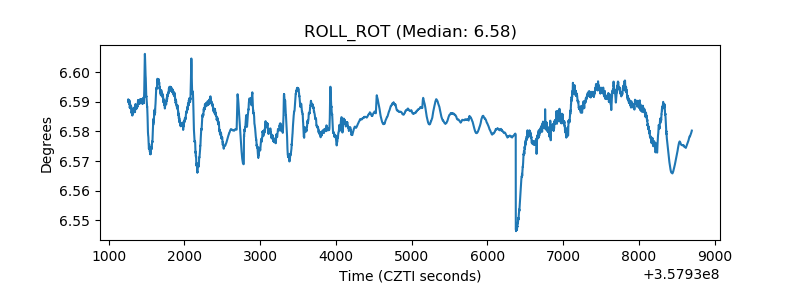 |
| _Roll_DEC | 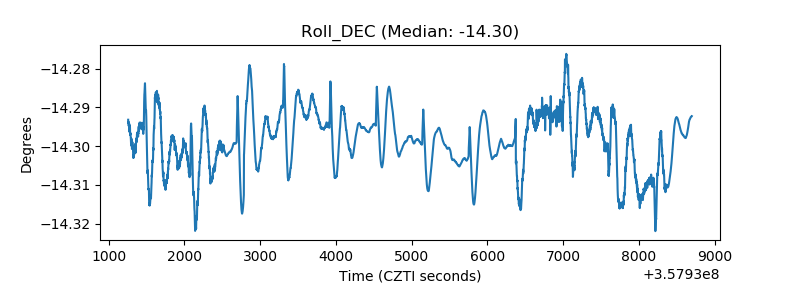 |
| _Roll_RA | 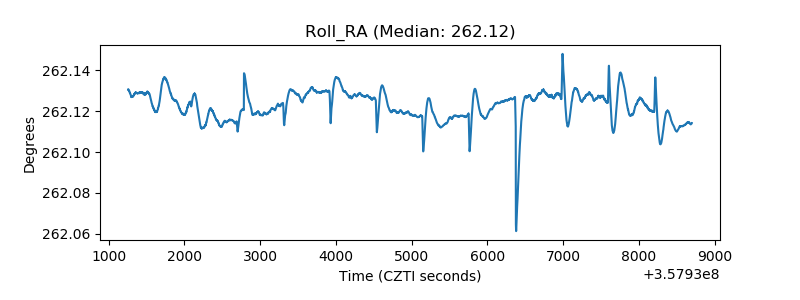 |
| Veto Counter | 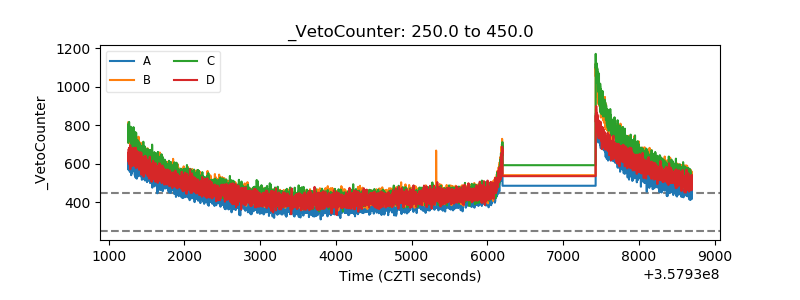 |