| Param | Original file | Final file |
|---|---|---|
| Filename | modeM0/AS1A10_071T16_9000004348cztM0_level2.fits | modeM0/AS1A10_071T16_9000004348cztM0_level2_quad_clean.evt |
| Size (bytes) | 355,648,320 | 279,014,400 |
| Size | 339.2 MB | 266.1 MB |
| Events in quadrant A | 2,206,988 | 1,576,471 |
| Events in quadrant B | 2,085,012 | 1,554,240 |
| Events in quadrant C | 2,129,000 | 1,479,586 |
| Events in quadrant D | 1,849,324 | 1,338,427 |
| Mode M0 | |||
|---|---|---|---|
| Quadrant | BADHDUFLAG | Total packets | Discarded packets |
| A | 0 | 75670 | 0 |
| B | 0 | 109916 | 0 |
| C | 0 | 80148 | 0 |
| D | 0 | 99373 | 0 |
| Mode M9 | |||
|---|---|---|---|
| Quadrant | BADHDUFLAG | Total packets | Discarded packets |
| A | 0 | 57 | 0 |
| B | 0 | 57 | 0 |
| C | 0 | 57 | 0 |
| D | 0 | 57 | 0 |
| Mode SS | |||
|---|---|---|---|
| Quadrant | BADHDUFLAG | Total packets | Discarded packets |
| A | 0 | 742 | 0 |
| B | 0 | 742 | 0 |
| C | 0 | 742 | 0 |
| D | 0 | 742 | 0 |
| Quadrant | Total seconds | Saturated seconds | Saturation percentage |
|---|---|---|---|
| A | 36405 | 535 | 1.469578% |
| B | 36405 | 817 | 2.244197% |
| C | 36405 | 784 | 2.153550% |
| D | 36405 | 1486 | 4.081857% |
Noise dominated data is calculated using 1-second bins in cleaned event files. If a bin has >2000 counts, and if more than 50% of those come from <1% of pixels, then it is considered to be noise-dominated and hence unusable.
| Quadrant | # 1 sec bins | Bins with >0 counts | Bins with >2000 counts | High rate bins dominated by noise | Noise dominated (total time) | Noise dominated (detector-on time) | Marked lightcurve |
|---|---|---|---|---|---|---|---|
| A | 42040 | 36401 | 0 | 0 | 0.00% | 0.00% |  |
| B | 42040 | 36399 | 0 | 0 | 0.00% | 0.00% |  |
| C | 42040 | 36399 | 0 | 0 | 0.00% | 0.00% |  |
| D | 42040 | 36393 | 0 | 0 | 0.00% | 0.00% |  |
Top three noisy pixels from each quadrant. If the there are fewer than three noisy pixels in the level2.evt file, extra rows are filled as -1
| Pixel properties | Quadrant properties | ||||||
|---|---|---|---|---|---|---|---|
| Quadrant | DetID | PixID | Counts | Sigma | Mean | Median | Sigma |
| A | 0 | 29 | 2143 | 11.13 | 575 | 538 | 144.3 |
| A | 7 | 110 | 1698 | 8.04 | 575 | 538 | 144.3 |
| A | 0 | 30 | 1674 | 7.87 | 575 | 538 | 144.3 |
| B | 2 | 9 | 1723 | 10.51 | 550 | 523 | 114.2 |
| B | 2 | 8 | 1404 | 7.72 | 550 | 523 | 114.2 |
| B | 5 | 225 | 1396 | 7.65 | 550 | 523 | 114.2 |
| C | 1 | 80 | 1693 | 8.16 | 562 | 525 | 143.1 |
| C | 1 | 81 | 1647 | 7.84 | 562 | 525 | 143.1 |
| C | 12 | 241 | 1550 | 7.16 | 562 | 525 | 143.1 |
| D | 15 | 46 | 1372 | 6.23 | 528 | 480 | 143.1 |
| D | 6 | 231 | 1331 | 5.95 | 528 | 480 | 143.1 |
| D | 4 | 160 | 1290 | 5.66 | 528 | 480 | 143.1 |
Histogram calculated using DETX and DETY for each event in the final _common_clean file
| Quadrant A | 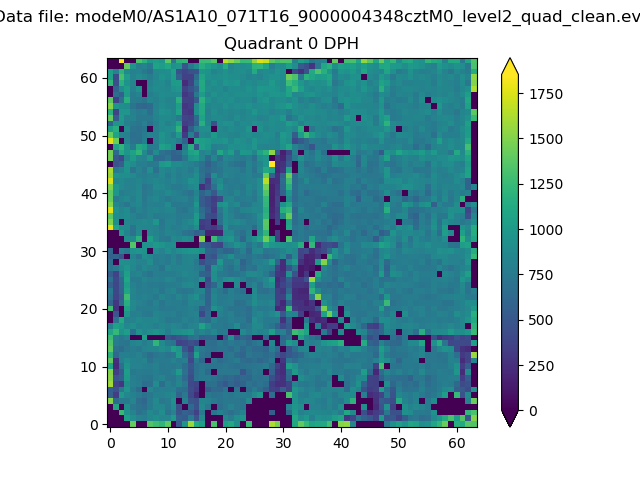 |
 |
Quadrant B |
|---|---|---|---|
| Quadrant D | 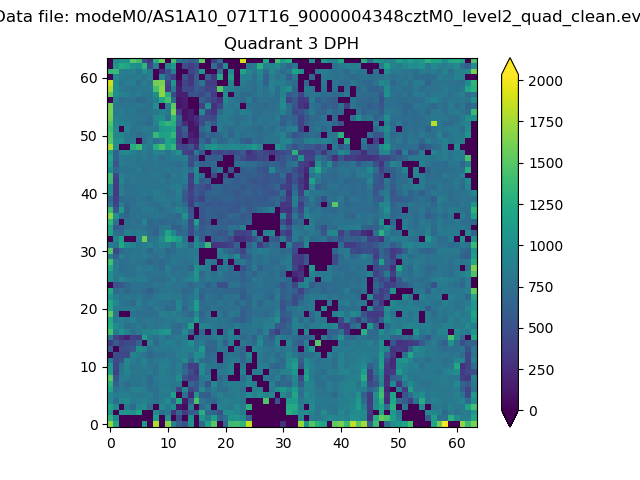 |
 |
Quadrant C |
| Plot type | Count rate plots | Images |
|---|---|---|
| Comparison with Poisson distribution Blue bars denote a histogram of data divided into 1 sec bins. Red curve is a Poisson curve with rate = median count rate of data. |
 |
 |
| Quadrant-wise count rates Data is divided into 100 sec bins |
 |
|
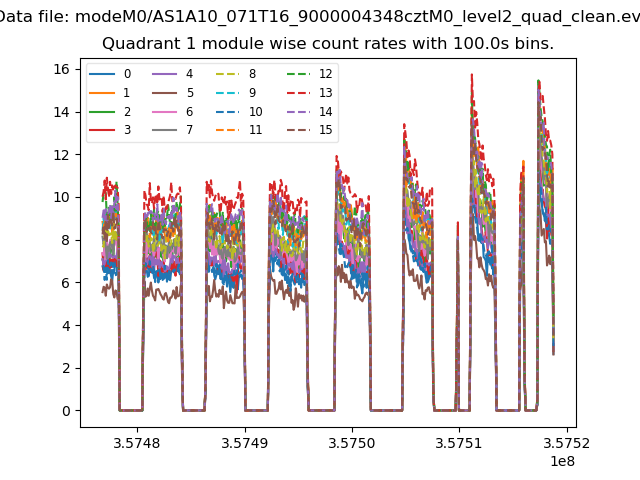
| Module-wise count rates for Quadrant A Data is divided into 100 sec bins |
 |
 |
| Module-wise count rates for Quadrant B Data is divided into 100 sec bins |
 |
 |
| Module-wise count rates for Quadrant C Data is divided into 100 sec bins |
 |
 |
| Module-wise count rates for Quadrant D Data is divided into 100 sec bins |
 |
 |
| Parameter | Plot |
|---|---|
| CZT HV Monitor | 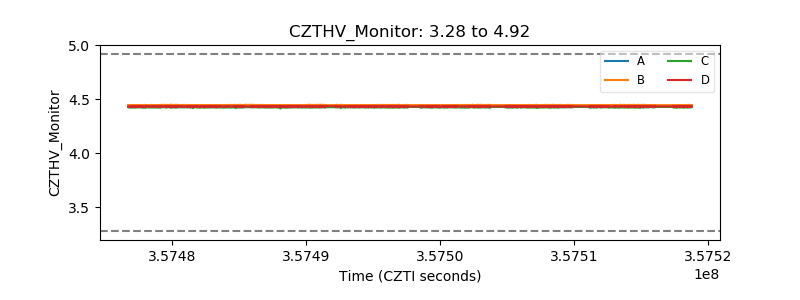 |
| D_VDD | 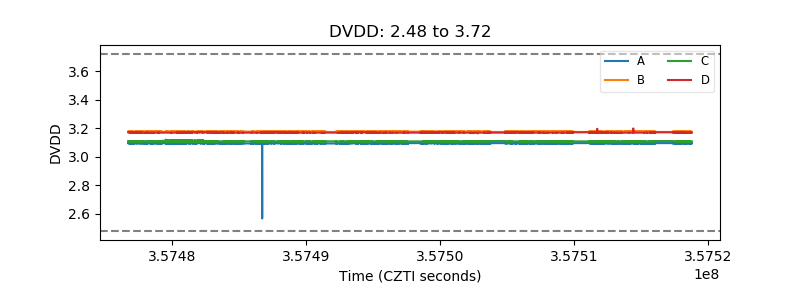 |
| Temperature 1 |  |
| Veto HV Monitor |  |
| Veto LLD |  |
| Alpha Counter | 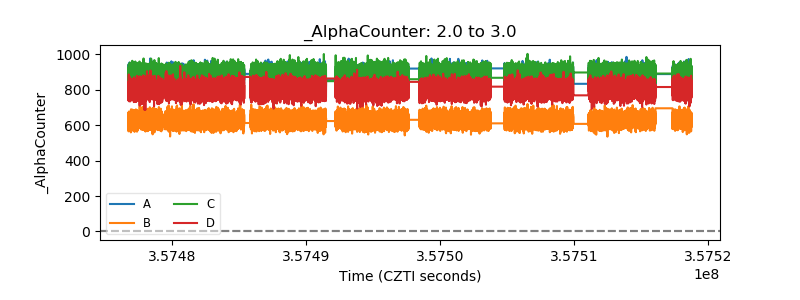 |
| _CPM_Rate |  |
| CZT Counter |  |
| +2.5 Volts monitor |  |
| +5 Volts monitor |  |
| _ROLL_ROT | 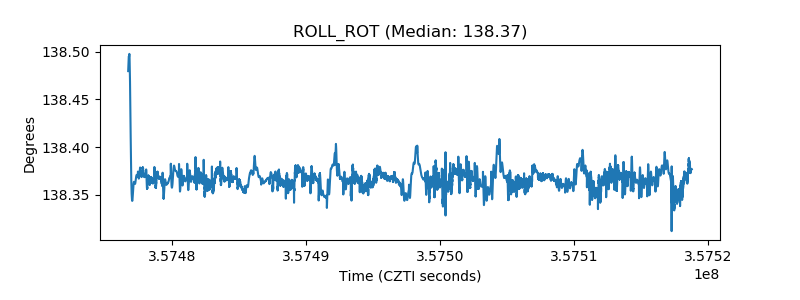 |
| _Roll_DEC |  |
| _Roll_RA | 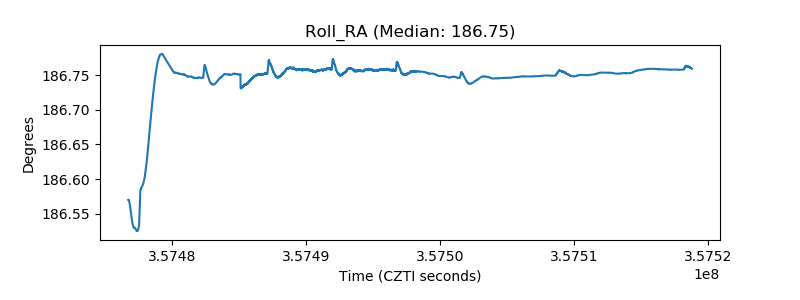 |
| Veto Counter |  |