| Param | Original file | Final file |
|---|---|---|
| Filename | modeM0/AS1A10_071T16_9000004348_30217cztM0_level2.evt | modeM0/AS1A10_071T16_9000004348_30217cztM0_level2_quad_clean.evt |
| Size (bytes) | 917,801,280 | 148,368,960 |
| Size | 875.3 MB | 141.5 MB |
| Events in quadrant A | 5,280,602 | 951,732 |
| Events in quadrant B | 8,376,944 | 952,578 |
| Events in quadrant C | 6,173,993 | 911,131 |
| Events in quadrant D | 7,203,371 | 898,334 |
| Mode M0 | |||
|---|---|---|---|
| Quadrant | BADHDUFLAG | Total packets | Discarded packets |
| A | 0 | 23014 | 2 |
| B | 0 | 33815 | 2 |
| C | 0 | 25252 | 2 |
| D | 0 | 28375 | 2 |
| Mode M9 | |||
|---|---|---|---|
| Quadrant | BADHDUFLAG | Total packets | Discarded packets |
| A | 0 | 12 | 0 |
| B | 0 | 12 | 0 |
| C | 0 | 12 | 0 |
| D | 0 | 12 | 0 |
| Mode SS | |||
|---|---|---|---|
| Quadrant | BADHDUFLAG | Total packets | Discarded packets |
| A | 0 | 230 | 0 |
| B | 0 | 230 | 0 |
| C | 0 | 230 | 0 |
| D | 0 | 230 | 0 |
| Quadrant | Total seconds | Saturated seconds | Saturation percentage |
|---|---|---|---|
| A | 11265 | 124 | 1.100755% |
| B | 11265 | 199 | 1.766534% |
| C | 11266 | 201 | 1.784129% |
| D | 11266 | 219 | 1.943902% |
Noise dominated data is calculated using 1-second bins in cleaned event files. If a bin has >2000 counts, and if more than 50% of those come from <1% of pixels, then it is considered to be noise-dominated and hence unusable.
| Quadrant | # 1 sec bins | Bins with >0 counts | Bins with >2000 counts | High rate bins dominated by noise | Noise dominated (total time) | Noise dominated (detector-on time) | Marked lightcurve |
|---|---|---|---|---|---|---|---|
| A | 12435 | 11267 | 0 | 0 | 0.00% | 0.00% | 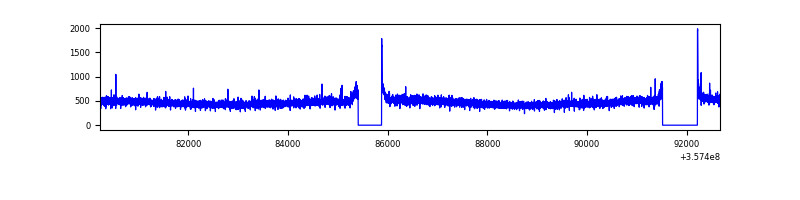 |
| B | 12435 | 11266 | 0 | 0 | 0.00% | 0.00% | 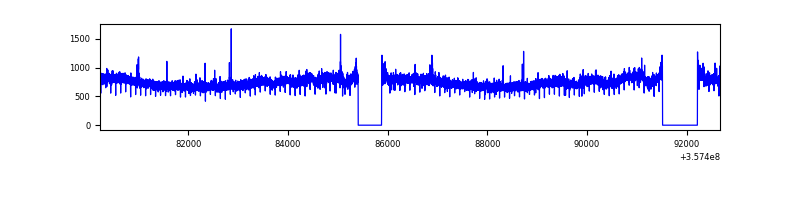 |
| C | 12436 | 11267 | 2 | 2 | 0.02% | 0.02% | 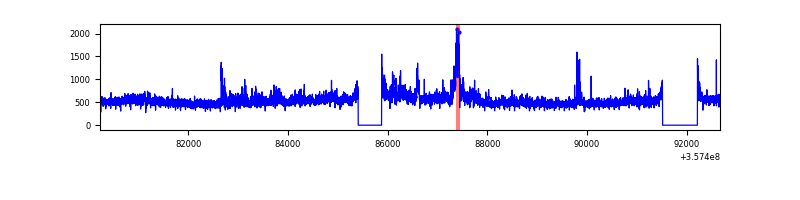 |
| D | 12436 | 11266 | 135 | 135 | 1.09% | 1.20% | 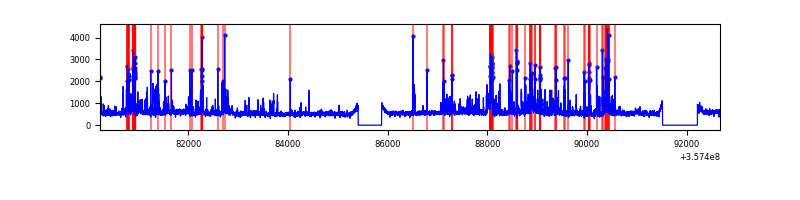 |
Top three noisy pixels from each quadrant. If the there are fewer than three noisy pixels in the level2.evt file, extra rows are filled as -1
| Pixel properties | Quadrant properties | ||||||
|---|---|---|---|---|---|---|---|
| Quadrant | DetID | PixID | Counts | Sigma | Mean | Median | Sigma |
| A | 8 | 192 | 25462 | 87.64 | 1362 | 1330 | 275.3 |
| A | 13 | 254 | 20229 | 68.64 | 1362 | 1330 | 275.3 |
| A | 3 | 137 | 14230 | 46.85 | 1362 | 1330 | 275.3 |
| B | 6 | 159 | 3074136 | 11823.03 | 1342 | 1302 | 259.9 |
| B | 12 | 111 | 33711 | 124.7 | 1342 | 1302 | 259.9 |
| B | 11 | 111 | 30920 | 113.96 | 1342 | 1302 | 259.9 |
| C | 3 | 233 | 806036 | 2580.91 | 1307 | 1315 | 311.8 |
| C | 14 | 238 | 210031 | 669.4 | 1307 | 1315 | 311.8 |
| C | 15 | 208 | 34288 | 105.75 | 1307 | 1315 | 311.8 |
| D | 1 | 52 | 1130547 | 3592.82 | 1309 | 1277 | 314.3 |
| D | 7 | 223 | 452633 | 1436.01 | 1309 | 1277 | 314.3 |
| D | 8 | 195 | 331697 | 1051.25 | 1309 | 1277 | 314.3 |
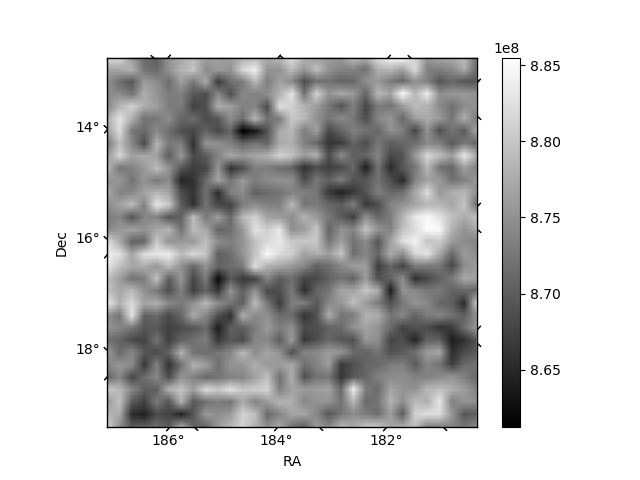
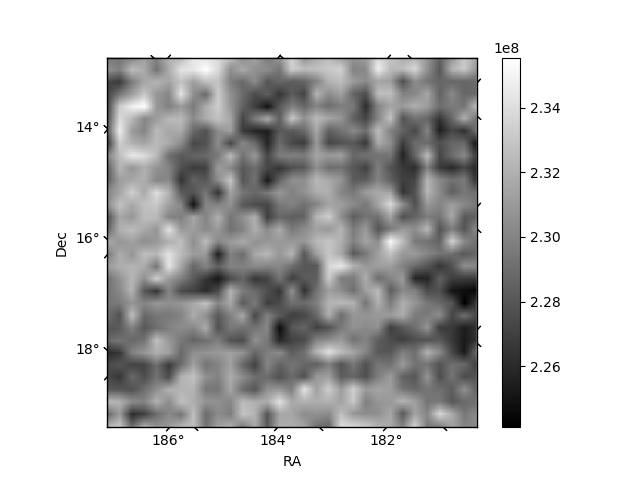
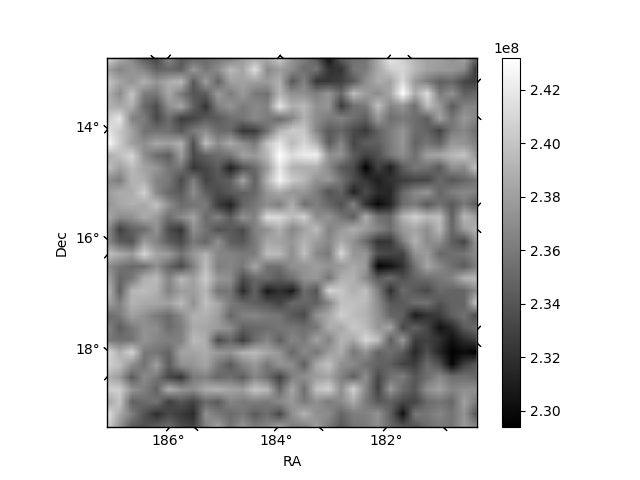
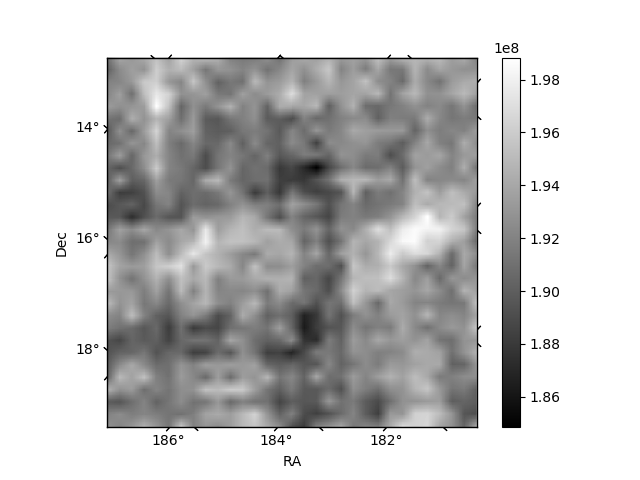
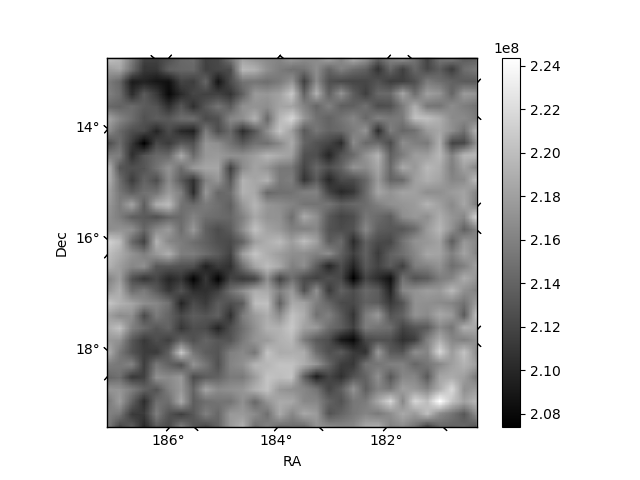
Histogram calculated using DETX and DETY for each event in the final _common_clean file
| Quadrant A | 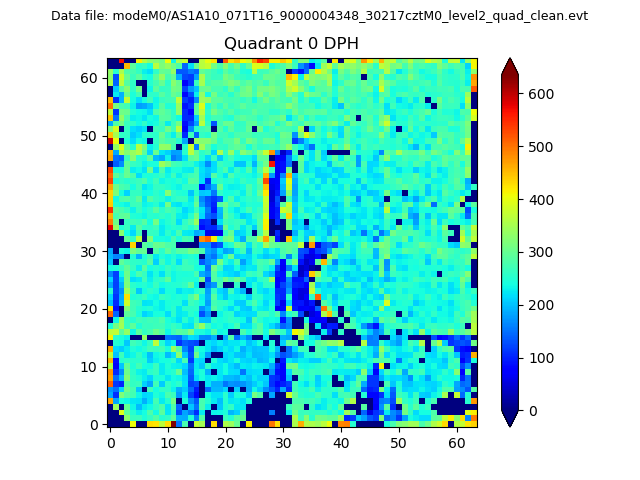 |
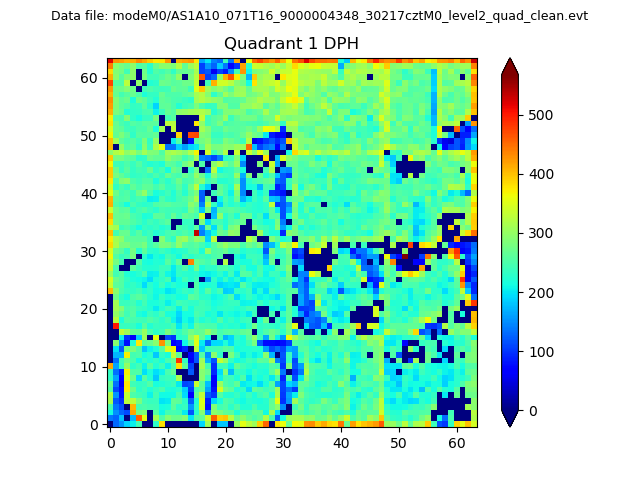 |
Quadrant B |
|---|---|---|---|
| Quadrant D |  |
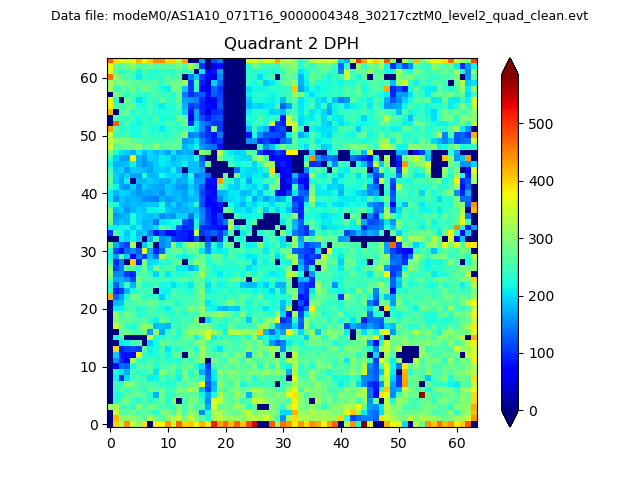 |
Quadrant C |
| Plot type | Count rate plots | Images |
|---|---|---|
| Comparison with Poisson distribution Blue bars denote a histogram of data divided into 1 sec bins. Red curve is a Poisson curve with rate = median count rate of data. |
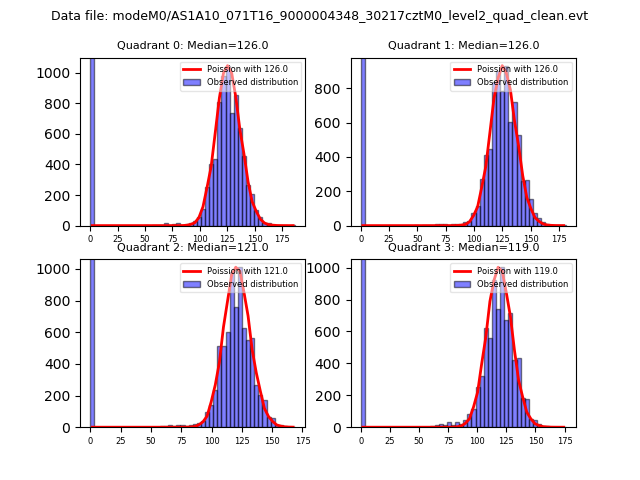 |
 |
| Quadrant-wise count rates Data is divided into 100 sec bins |
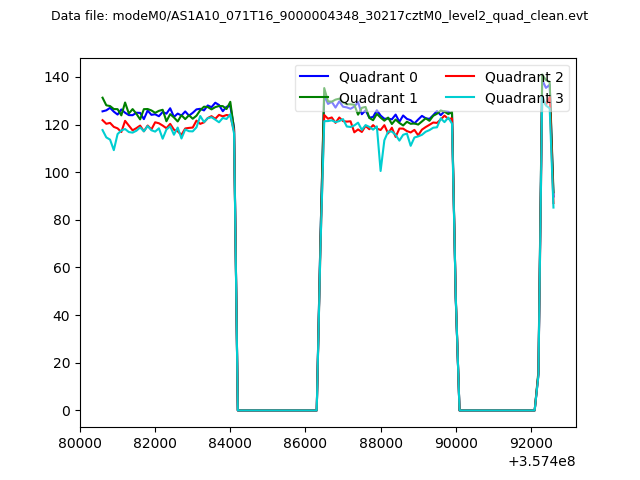 |
|
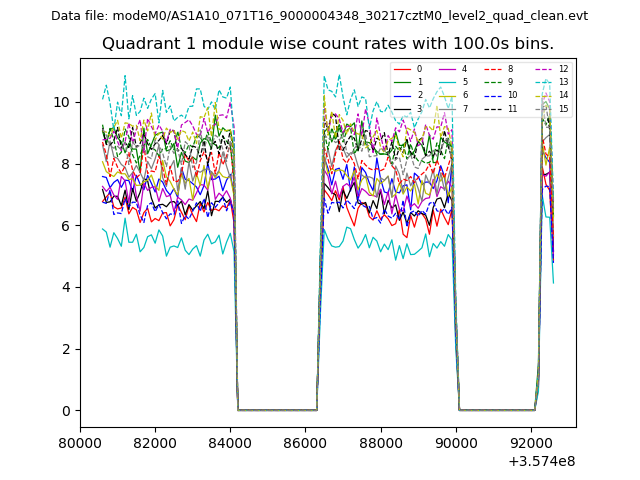
| Module-wise count rates for Quadrant A Data is divided into 100 sec bins |
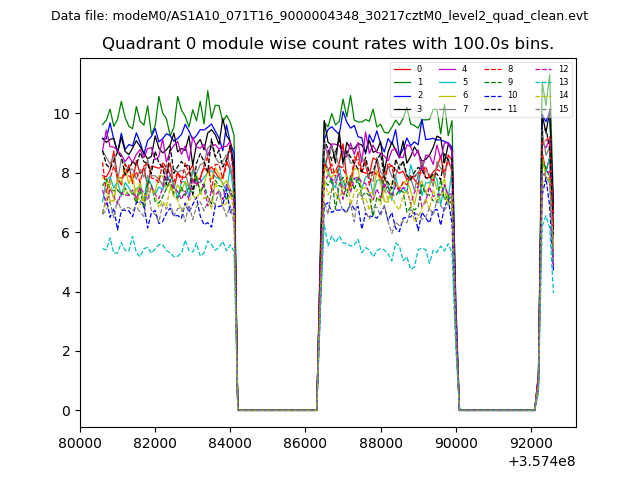 |
 |
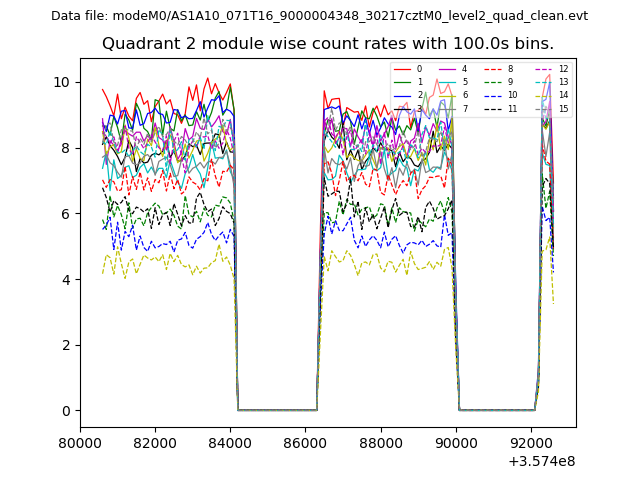
| Module-wise count rates for Quadrant B Data is divided into 100 sec bins |
 |
 |
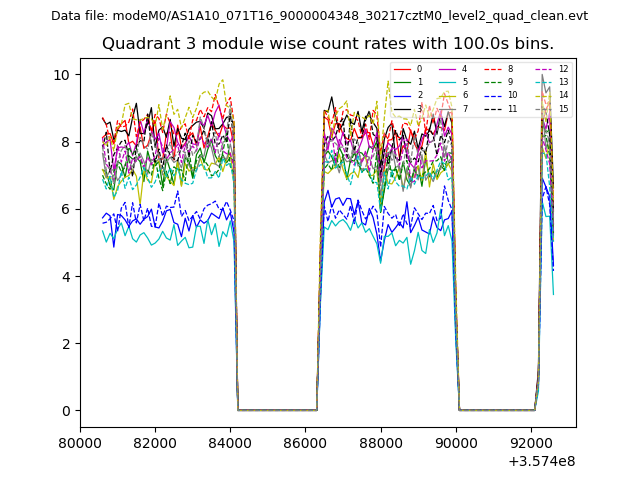
| Module-wise count rates for Quadrant C Data is divided into 100 sec bins |
 |
 |
| Module-wise count rates for Quadrant D Data is divided into 100 sec bins |
 |
 |
| Parameter | Plot |
|---|---|
| CZT HV Monitor | 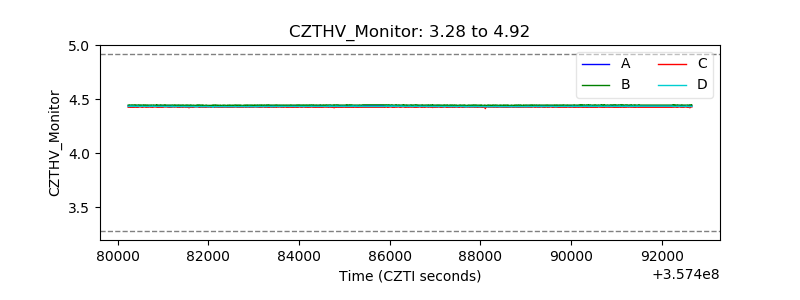 |
| D_VDD |  |
| Temperature 1 | 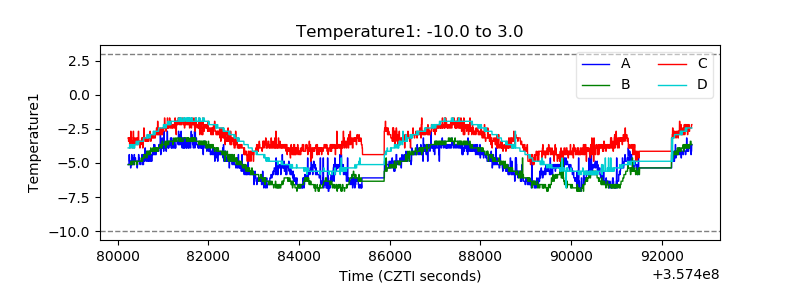 |
| Veto HV Monitor | 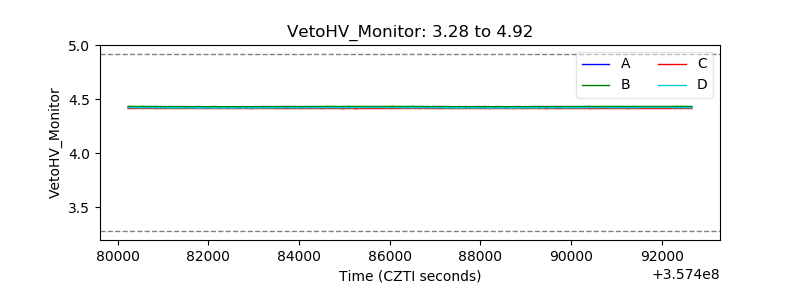 |
| Veto LLD | 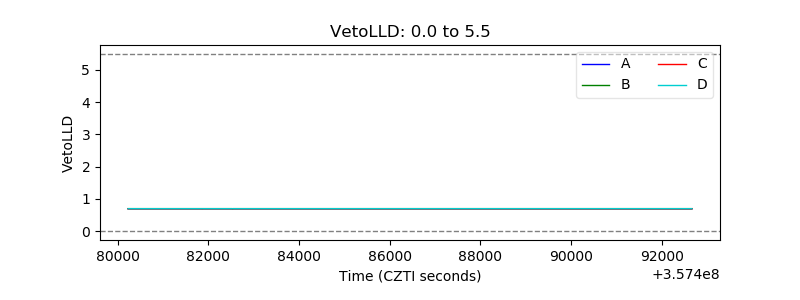 |
| Alpha Counter | 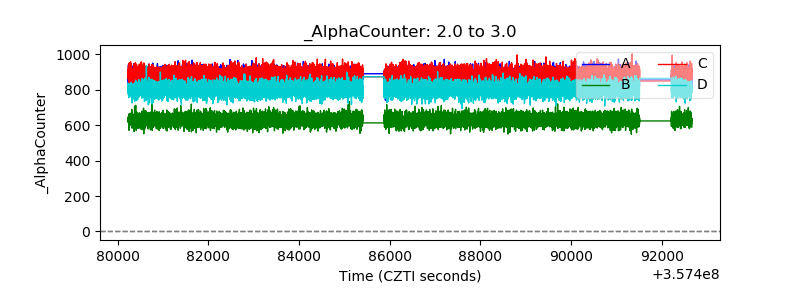 |
| _CPM_Rate | 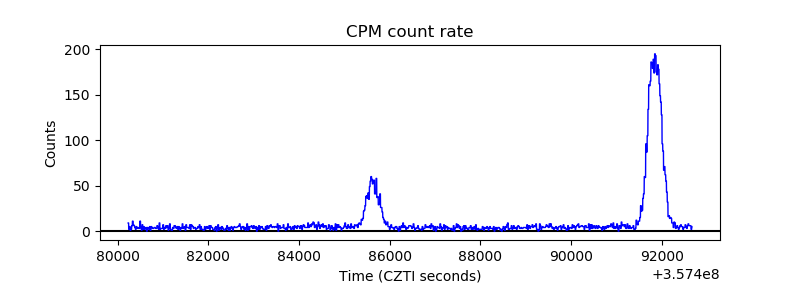 |
| CZT Counter | 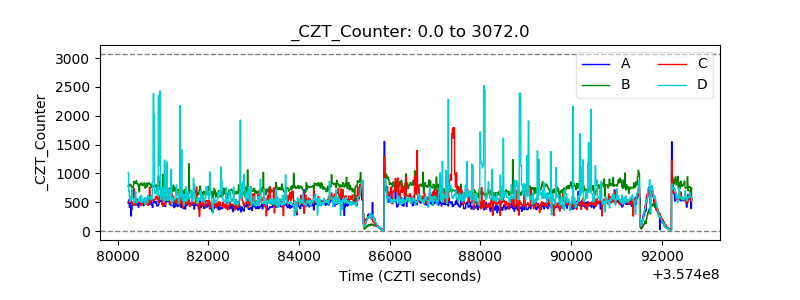 |
| +2.5 Volts monitor | 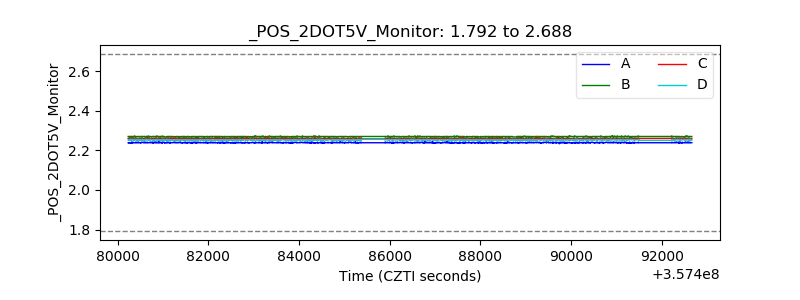 |
| +5 Volts monitor |  |
| _ROLL_ROT | 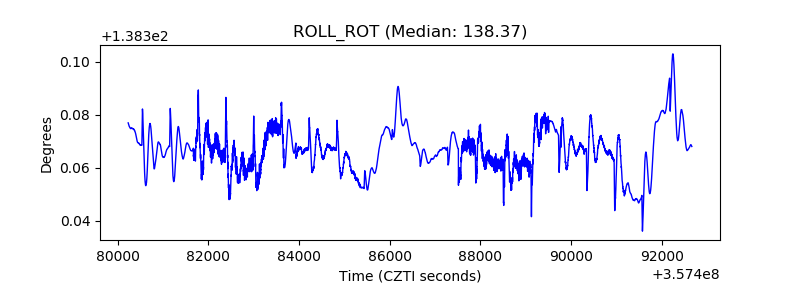 |
| _Roll_DEC | 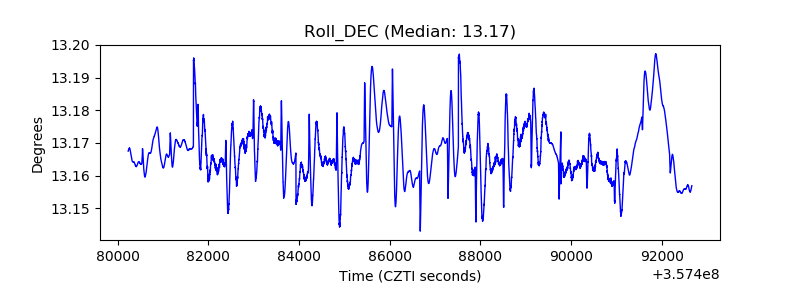 |
| _Roll_RA | 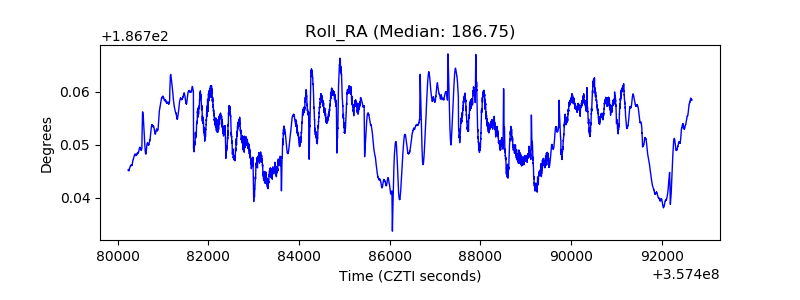 |
| Veto Counter | 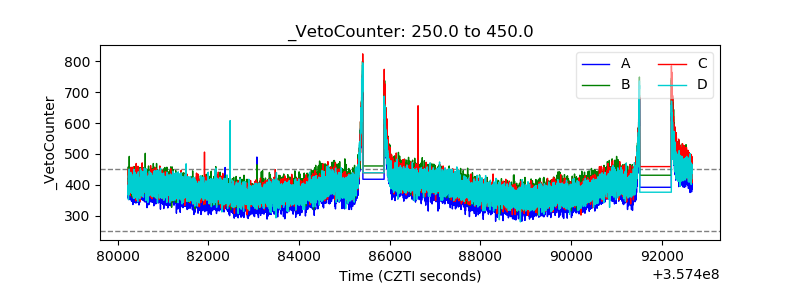 |