| Param | Original file | Final file |
|---|---|---|
| Filename | modeM0/AS1A10_071T16_9000004348_30218cztM0_level2.evt | modeM0/AS1A10_071T16_9000004348_30218cztM0_level2_quad_clean.evt |
| Size (bytes) | 554,448,960 | 102,568,320 |
| Size | 528.8 MB | 97.8 MB |
| Events in quadrant A | 3,348,701 | 669,962 |
| Events in quadrant B | 5,189,671 | 670,407 |
| Events in quadrant C | 3,534,103 | 643,203 |
| Events in quadrant D | 4,248,699 | 639,059 |
| Mode M0 | |||
|---|---|---|---|
| Quadrant | BADHDUFLAG | Total packets | Discarded packets |
| A | 0 | 14433 | 1 |
| B | 0 | 20947 | 1 |
| C | 0 | 14833 | 1 |
| D | 0 | 17230 | 1 |
| Mode M9 | |||
|---|---|---|---|
| Quadrant | BADHDUFLAG | Total packets | Discarded packets |
| A | 0 | 8 | 0 |
| B | 0 | 8 | 0 |
| C | 0 | 8 | 0 |
| D | 0 | 8 | 0 |
| Mode SS | |||
|---|---|---|---|
| Quadrant | BADHDUFLAG | Total packets | Discarded packets |
| A | 0 | 140 | 0 |
| B | 0 | 140 | 0 |
| C | 0 | 140 | 0 |
| D | 0 | 140 | 0 |
| Quadrant | Total seconds | Saturated seconds | Saturation percentage |
|---|---|---|---|
| A | 6946 | 83 | 1.194932% |
| B | 6947 | 127 | 1.828127% |
| C | 6947 | 137 | 1.972074% |
| D | 6947 | 87 | 1.252339% |
Noise dominated data is calculated using 1-second bins in cleaned event files. If a bin has >2000 counts, and if more than 50% of those come from <1% of pixels, then it is considered to be noise-dominated and hence unusable.
| Quadrant | # 1 sec bins | Bins with >0 counts | Bins with >2000 counts | High rate bins dominated by noise | Noise dominated (total time) | Noise dominated (detector-on time) | Marked lightcurve |
|---|---|---|---|---|---|---|---|
| A | 7766 | 6946 | 0 | 0 | 0.00% | 0.00% |  |
| B | 7767 | 6947 | 1 | 1 | 0.01% | 0.01% |  |
| C | 7767 | 6947 | 2 | 2 | 0.03% | 0.03% |  |
| D | 7767 | 6947 | 12 | 12 | 0.15% | 0.17% |  |
Top three noisy pixels from each quadrant. If the there are fewer than three noisy pixels in the level2.evt file, extra rows are filled as -1
| Pixel properties | Quadrant properties | ||||||
|---|---|---|---|---|---|---|---|
| Quadrant | DetID | PixID | Counts | Sigma | Mean | Median | Sigma |
| A | 13 | 254 | 12542 | 67.02 | 864 | 847 | 174.5 |
| A | 8 | 192 | 11842 | 63.01 | 864 | 847 | 174.5 |
| A | 3 | 137 | 9047 | 46.99 | 864 | 847 | 174.5 |
| B | 6 | 159 | 1822498 | 10959.13 | 850 | 825 | 166.2 |
| B | 12 | 111 | 21119 | 122.09 | 850 | 825 | 166.2 |
| B | 11 | 111 | 19742 | 113.8 | 850 | 825 | 166.2 |
| C | 14 | 238 | 133077 | 675.21 | 828 | 833 | 195.9 |
| C | 3 | 233 | 103816 | 525.81 | 828 | 833 | 195.9 |
| C | 15 | 208 | 48166 | 241.67 | 828 | 833 | 195.9 |
| D | 12 | 227 | 321462 | 1578.03 | 836 | 815 | 203.2 |
| D | 7 | 223 | 318123 | 1561.6 | 836 | 815 | 203.2 |
| D | 8 | 195 | 241105 | 1182.56 | 836 | 815 | 203.2 |
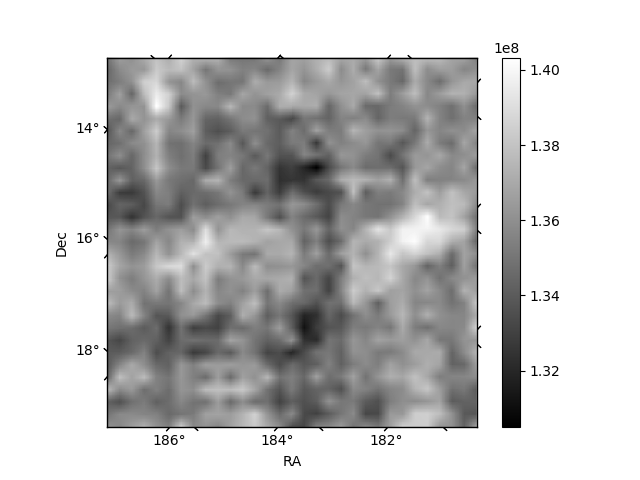
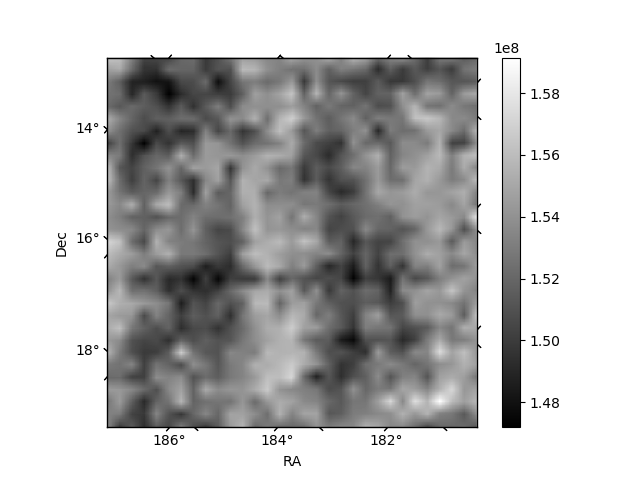
Histogram calculated using DETX and DETY for each event in the final _common_clean file
| Quadrant A | 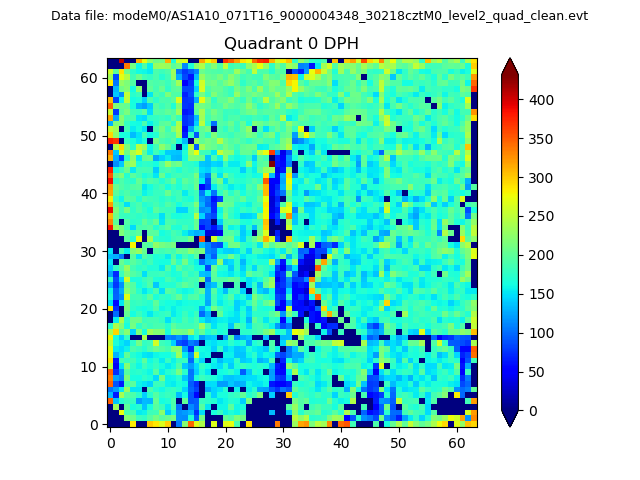 |
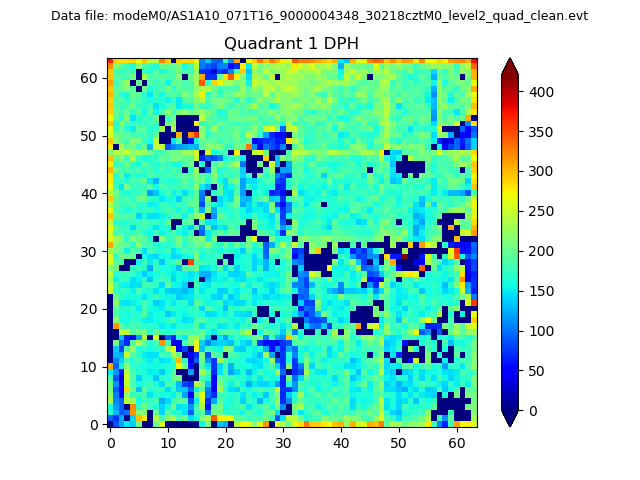 |
Quadrant B |
|---|---|---|---|
| Quadrant D | 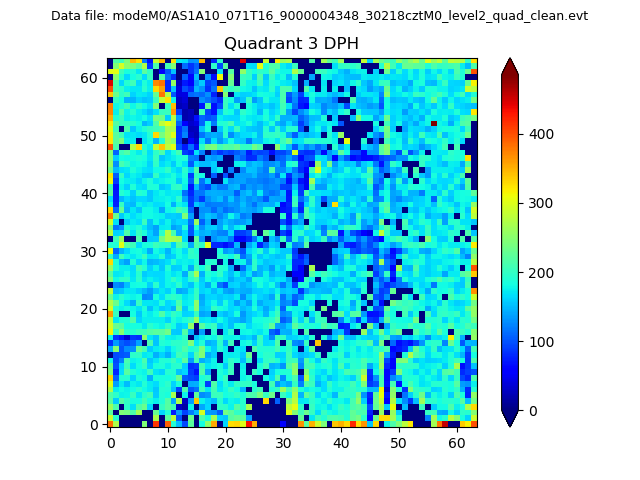 |
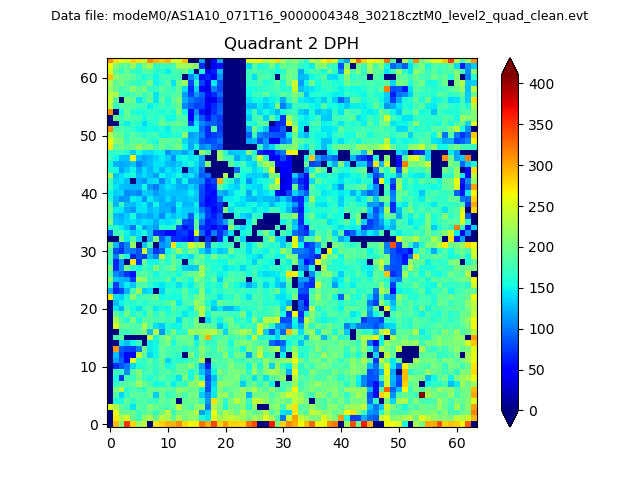 |
Quadrant C |
| Plot type | Count rate plots | Images |
|---|---|---|
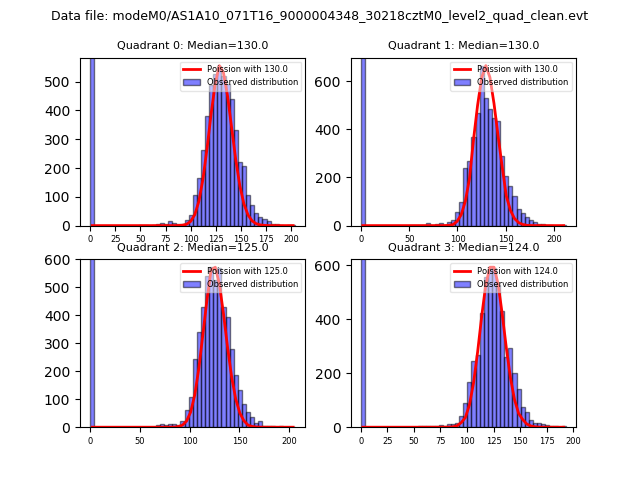
| Comparison with Poisson distribution Blue bars denote a histogram of data divided into 1 sec bins. Red curve is a Poisson curve with rate = median count rate of data. |
 |
 |
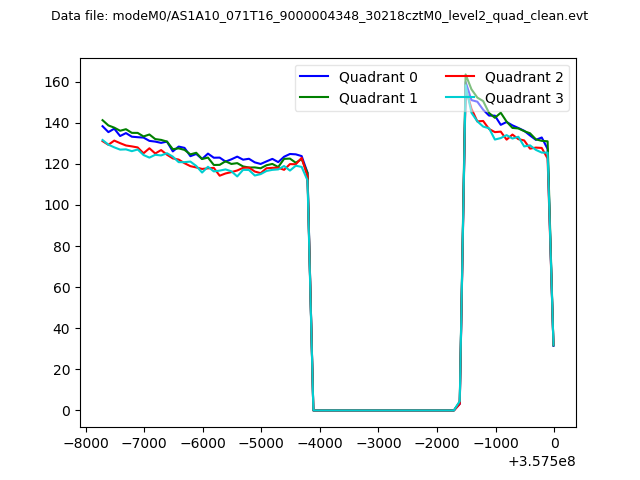
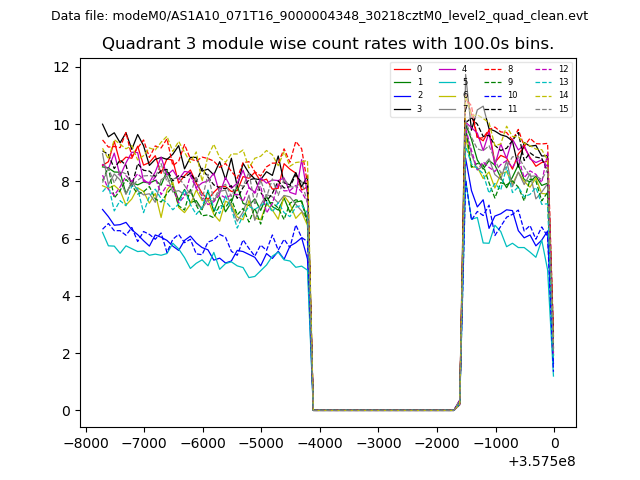
| Quadrant-wise count rates Data is divided into 100 sec bins |
 |
|
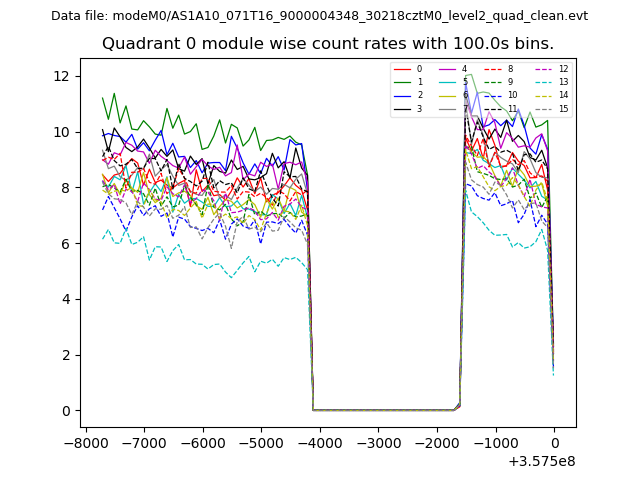
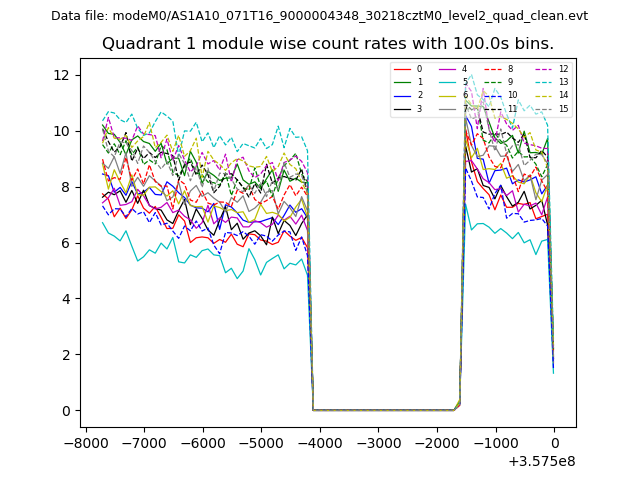
| Module-wise count rates for Quadrant A Data is divided into 100 sec bins |
 |
 |
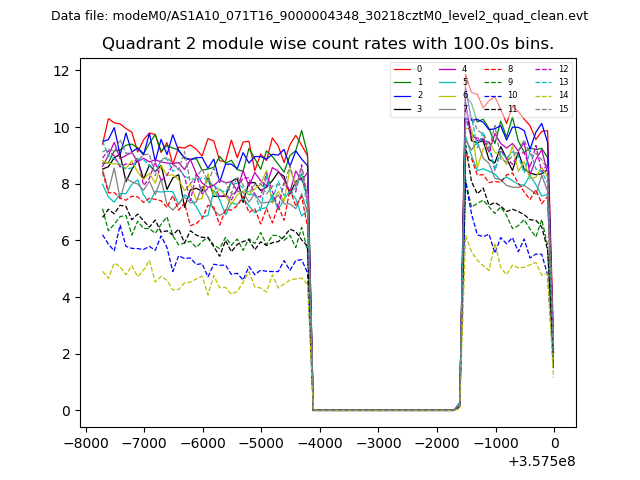
| Module-wise count rates for Quadrant B Data is divided into 100 sec bins |
 |
 |
| Module-wise count rates for Quadrant C Data is divided into 100 sec bins |
 |
 |
| Module-wise count rates for Quadrant D Data is divided into 100 sec bins |
 |
 |
| Parameter | Plot |
|---|---|
| CZT HV Monitor | 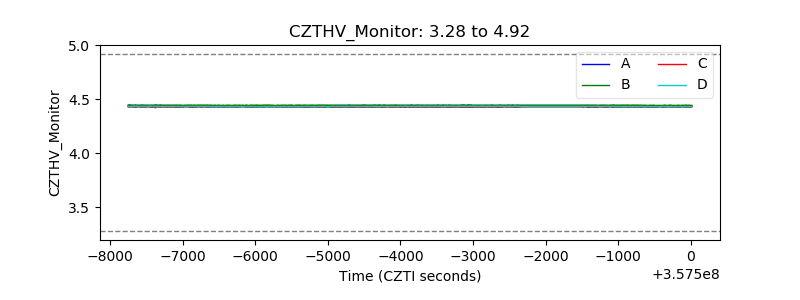 |
| D_VDD | 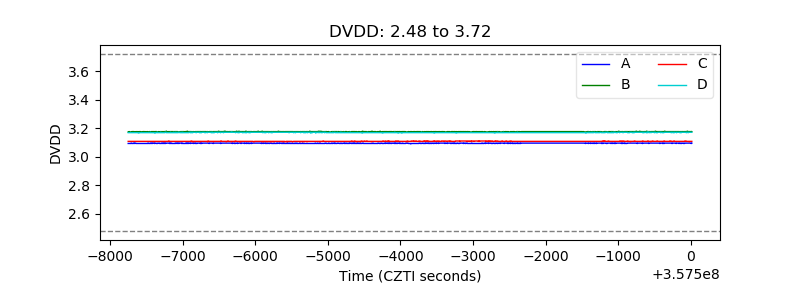 |
| Temperature 1 | 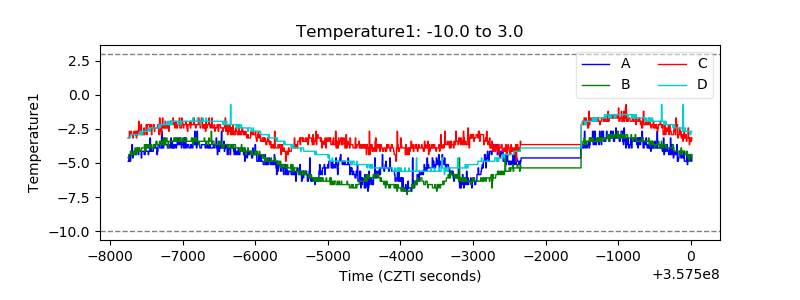 |
| Veto HV Monitor | 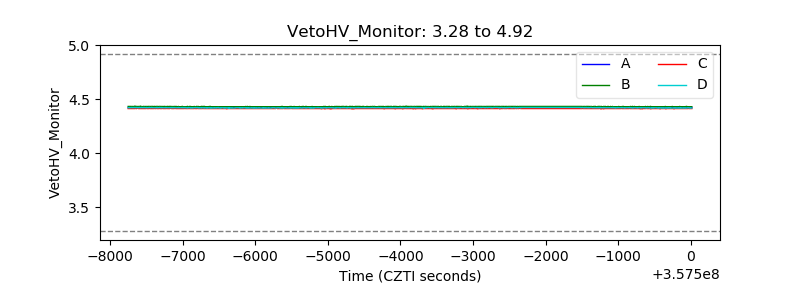 |
| Veto LLD | 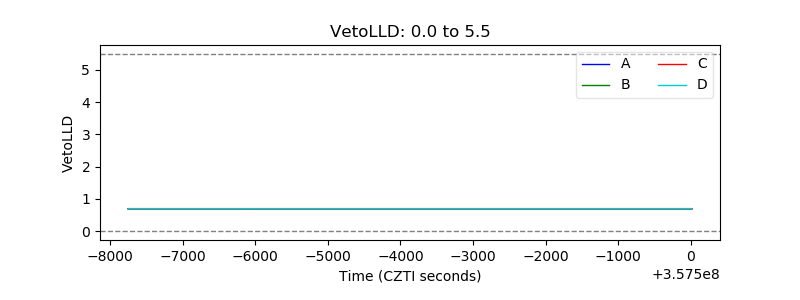 |
| Alpha Counter | 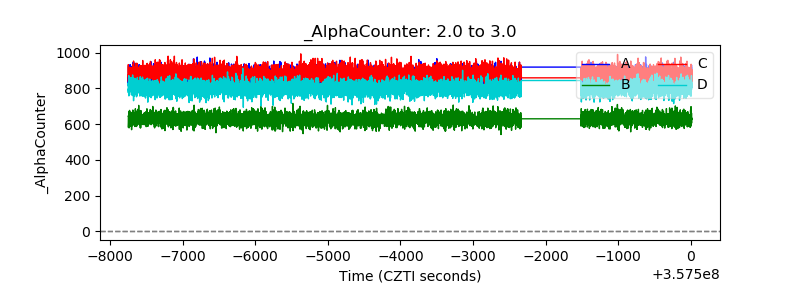 |
| _CPM_Rate | 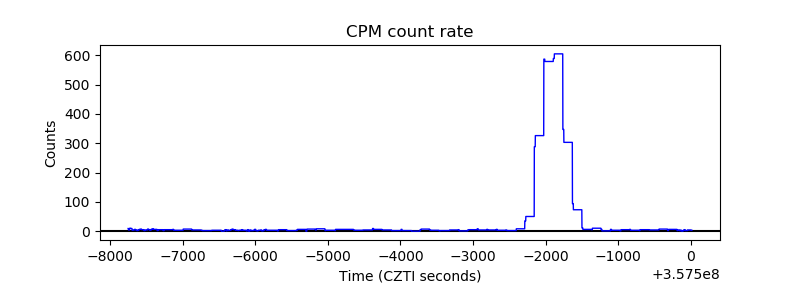 |
| CZT Counter | 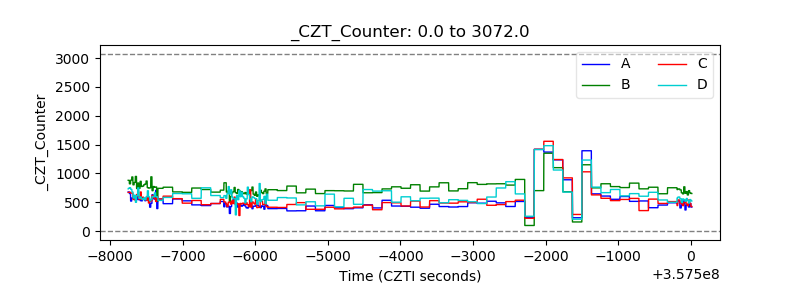 |
| +2.5 Volts monitor |  |
| +5 Volts monitor |  |
| _ROLL_ROT | 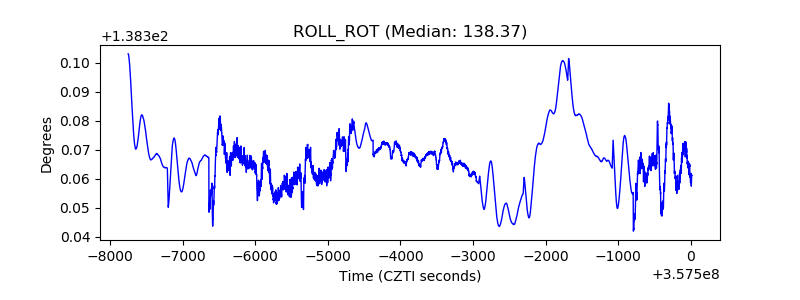 |
| _Roll_DEC | 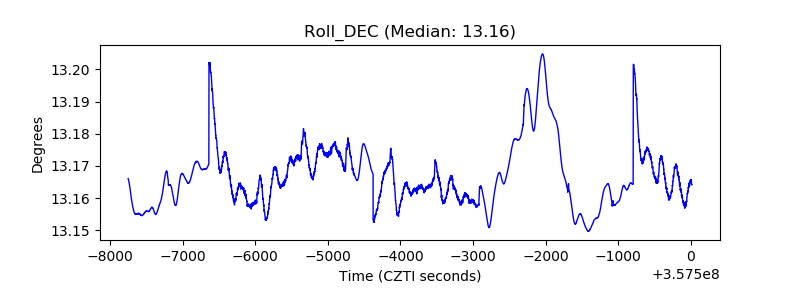 |
| _Roll_RA | 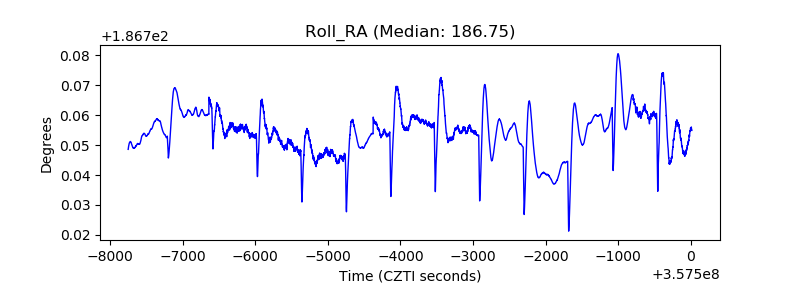 |
| Veto Counter | 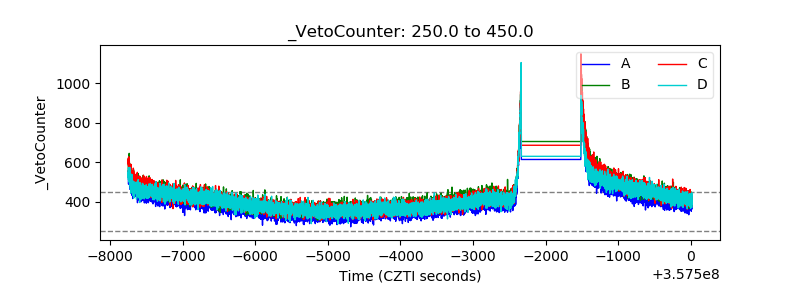 |