| Param | Original file | Final file |
|---|---|---|
| Filename | modeM0/AS1A10_071T16_9000004348_30219cztM0_level2.evt | modeM0/AS1A10_071T16_9000004348_30219cztM0_level2_quad_clean.evt |
| Size (bytes) | 540,319,680 | 92,715,840 |
| Size | 515.3 MB | 88.4 MB |
| Events in quadrant A | 3,123,847 | 601,719 |
| Events in quadrant B | 4,881,910 | 604,145 |
| Events in quadrant C | 3,248,764 | 581,536 |
| Events in quadrant D | 4,670,050 | 568,156 |
| Mode M0 | |||
|---|---|---|---|
| Quadrant | BADHDUFLAG | Total packets | Discarded packets |
| A | 0 | 13536 | 1 |
| B | 0 | 19525 | 2 |
| C | 0 | 13866 | 1 |
| D | 0 | 18298 | 1 |
| Mode M9 | |||
|---|---|---|---|
| Quadrant | BADHDUFLAG | Total packets | Discarded packets |
| A | 0 | 10 | 0 |
| B | 0 | 10 | 0 |
| C | 0 | 10 | 0 |
| D | 0 | 10 | 0 |
| Mode SS | |||
|---|---|---|---|
| Quadrant | BADHDUFLAG | Total packets | Discarded packets |
| A | 0 | 132 | 0 |
| B | 0 | 132 | 0 |
| C | 0 | 132 | 0 |
| D | 0 | 132 | 0 |
| Quadrant | Total seconds | Saturated seconds | Saturation percentage |
|---|---|---|---|
| A | 6482 | 54 | 0.833076% |
| B | 6482 | 83 | 1.280469% |
| C | 6482 | 112 | 1.727862% |
| D | 6482 | 159 | 2.452947% |
Noise dominated data is calculated using 1-second bins in cleaned event files. If a bin has >2000 counts, and if more than 50% of those come from <1% of pixels, then it is considered to be noise-dominated and hence unusable.
| Quadrant | # 1 sec bins | Bins with >0 counts | Bins with >2000 counts | High rate bins dominated by noise | Noise dominated (total time) | Noise dominated (detector-on time) | Marked lightcurve |
|---|---|---|---|---|---|---|---|
| A | 7502 | 6482 | 1 | 1 | 0.01% | 0.02% | 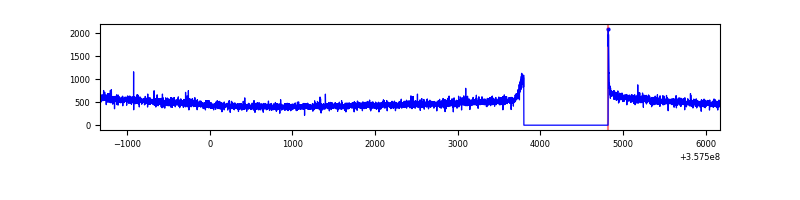 |
| B | 7502 | 6482 | 0 | 0 | 0.00% | 0.00% | 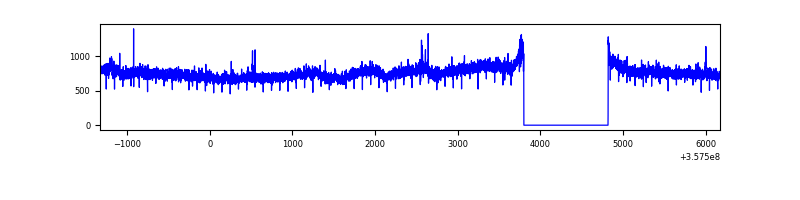 |
| C | 7502 | 6482 | 0 | 0 | 0.00% | 0.00% | 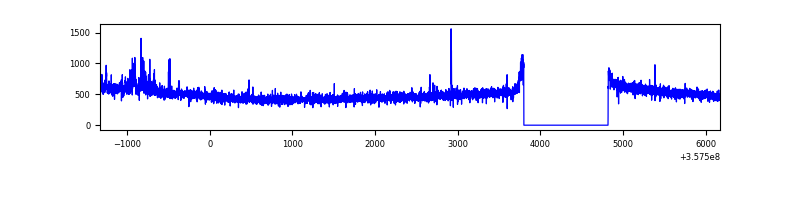 |
| D | 7502 | 6482 | 99 | 99 | 1.32% | 1.53% | 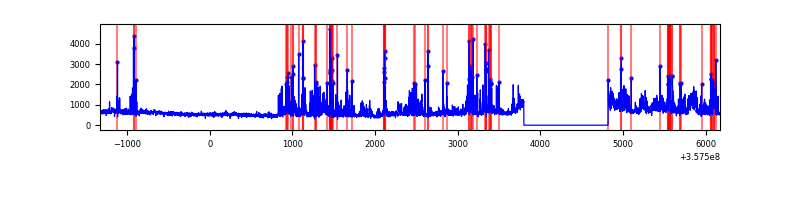 |
Top three noisy pixels from each quadrant. If the there are fewer than three noisy pixels in the level2.evt file, extra rows are filled as -1
| Pixel properties | Quadrant properties | ||||||
|---|---|---|---|---|---|---|---|
| Quadrant | DetID | PixID | Counts | Sigma | Mean | Median | Sigma |
| A | 8 | 192 | 13019 | 75.61 | 806 | 791 | 161.7 |
| A | 13 | 254 | 11561 | 66.6 | 806 | 791 | 161.7 |
| A | 3 | 137 | 8217 | 45.92 | 806 | 791 | 161.7 |
| B | 6 | 159 | 1745503 | 11359.79 | 794 | 772 | 153.6 |
| B | 12 | 111 | 18892 | 117.98 | 794 | 772 | 153.6 |
| B | 11 | 111 | 17707 | 110.26 | 794 | 772 | 153.6 |
| C | 14 | 238 | 124730 | 676.5 | 776 | 780 | 183.2 |
| C | 15 | 208 | 48675 | 261.4 | 776 | 780 | 183.2 |
| C | 3 | 233 | 39635 | 212.07 | 776 | 780 | 183.2 |
| D | 1 | 52 | 818557 | 4288.21 | 776 | 758 | 190.7 |
| D | 8 | 195 | 327145 | 1711.44 | 776 | 758 | 190.7 |
| D | 7 | 223 | 290806 | 1520.89 | 776 | 758 | 190.7 |
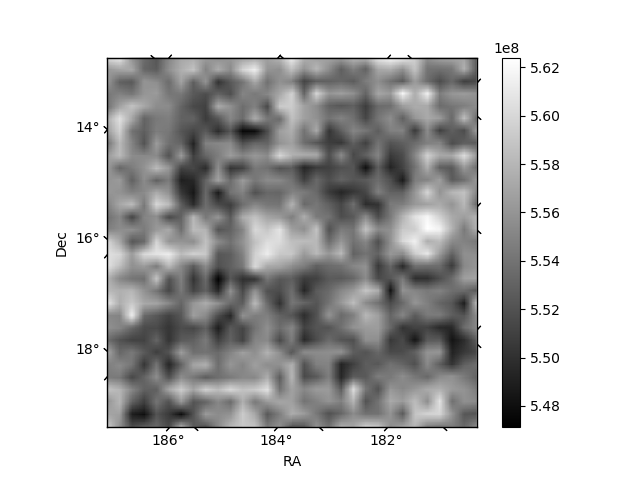
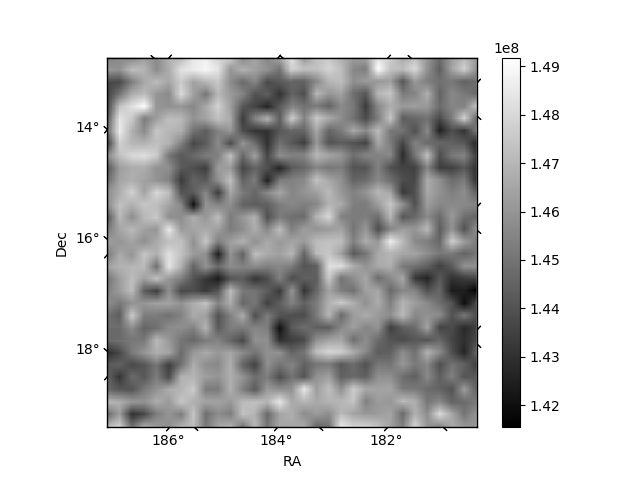
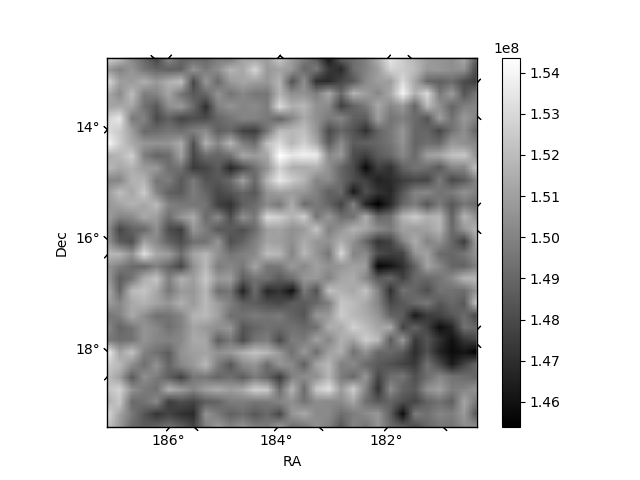
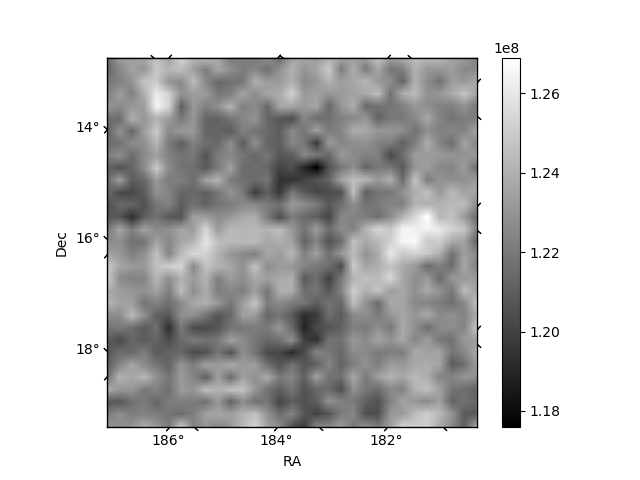
Histogram calculated using DETX and DETY for each event in the final _common_clean file
| Quadrant A | 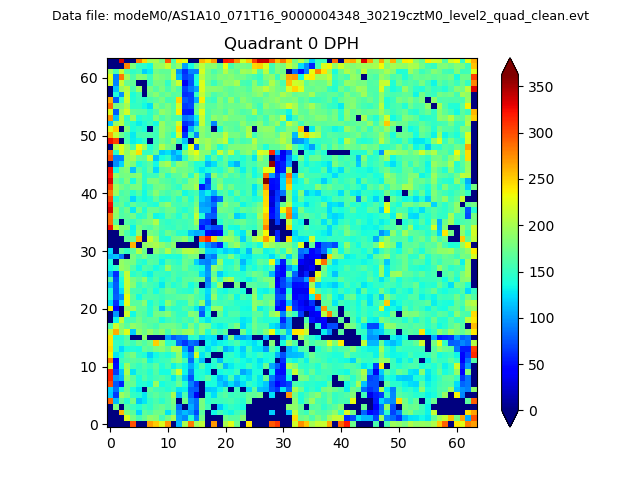 |
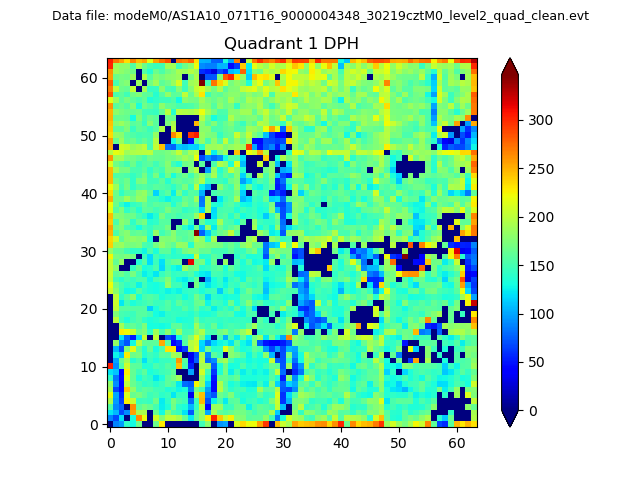 |
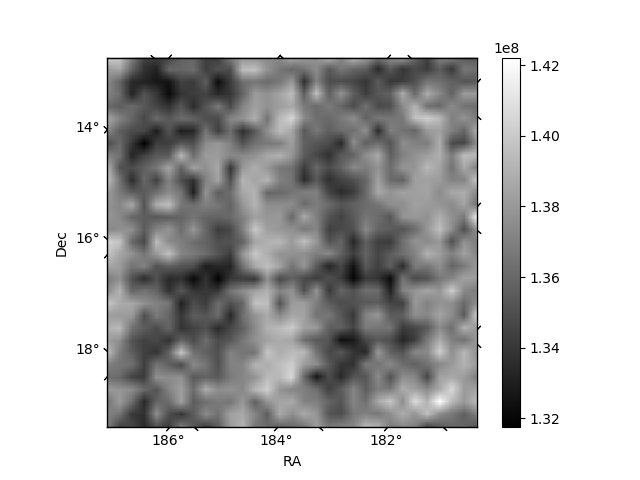
Quadrant B |
|---|---|---|---|
| Quadrant D | 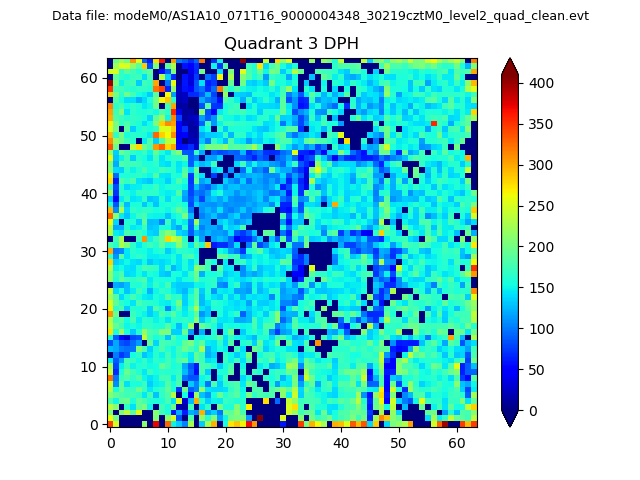 |
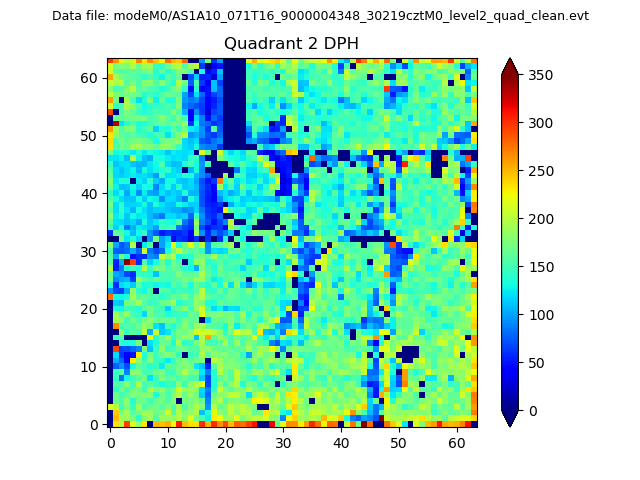 |
Quadrant C |
| Plot type | Count rate plots | Images |
|---|---|---|
| Comparison with Poisson distribution Blue bars denote a histogram of data divided into 1 sec bins. Red curve is a Poisson curve with rate = median count rate of data. |
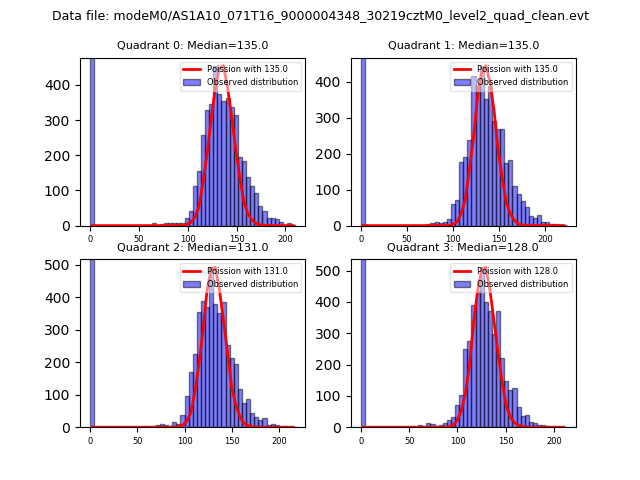 |
 |
| Quadrant-wise count rates Data is divided into 100 sec bins |
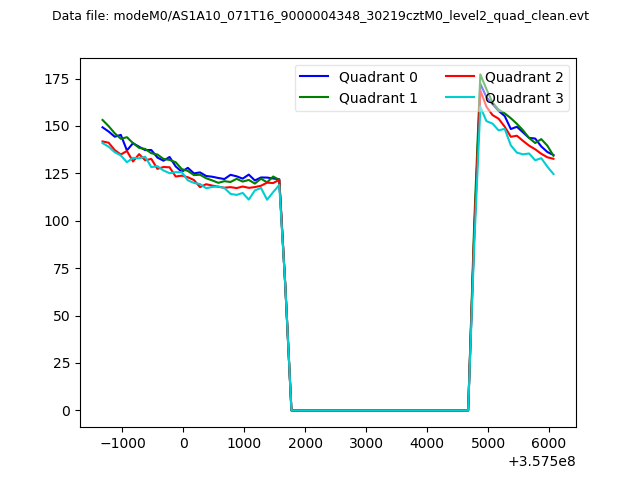 |
|
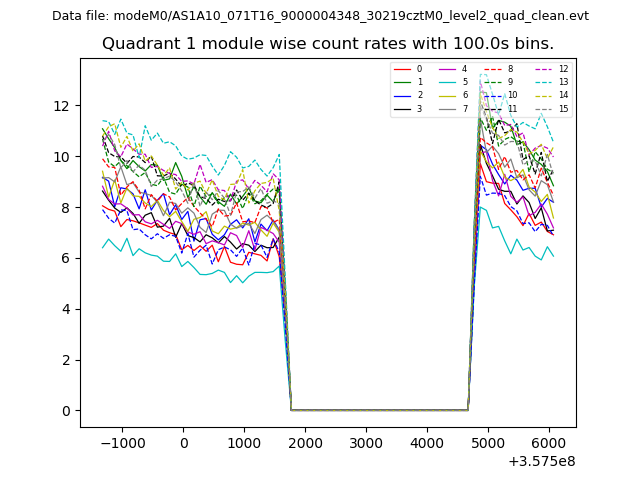
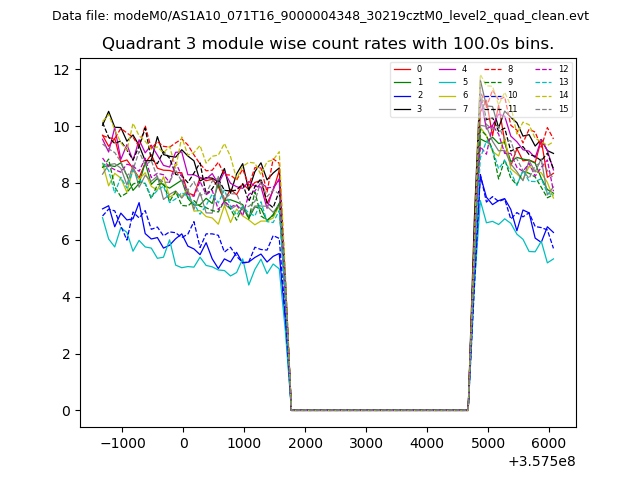
| Module-wise count rates for Quadrant A Data is divided into 100 sec bins |
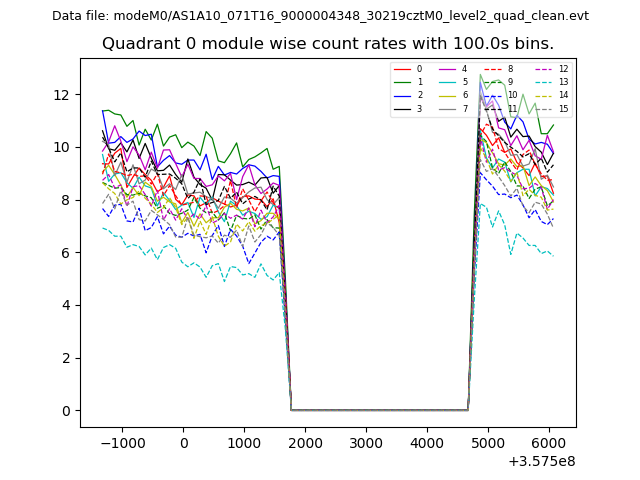 |
 |
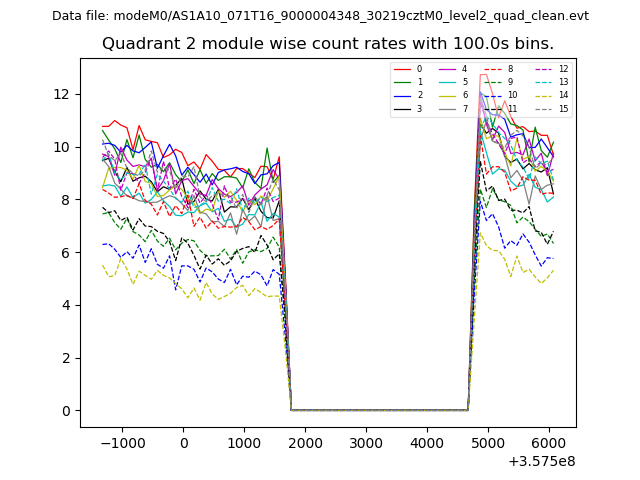
| Module-wise count rates for Quadrant B Data is divided into 100 sec bins |
 |
 |
| Module-wise count rates for Quadrant C Data is divided into 100 sec bins |
 |
 |
| Module-wise count rates for Quadrant D Data is divided into 100 sec bins |
 |
 |
| Parameter | Plot |
|---|---|
| CZT HV Monitor | 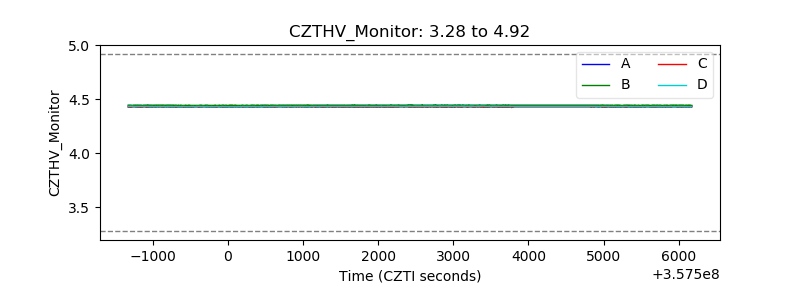 |
| D_VDD | 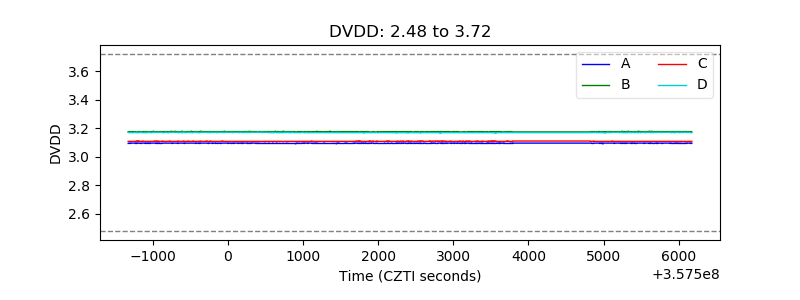 |
| Temperature 1 | 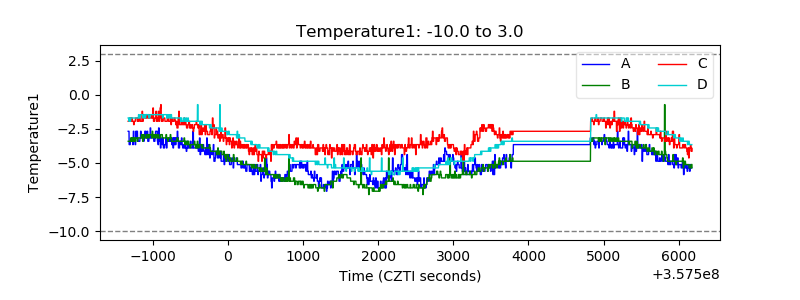 |
| Veto HV Monitor | 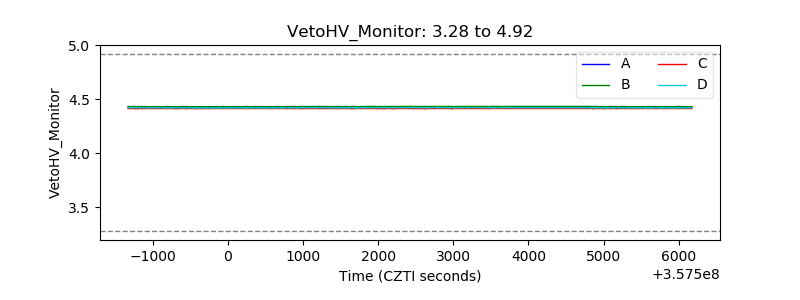 |
| Veto LLD | 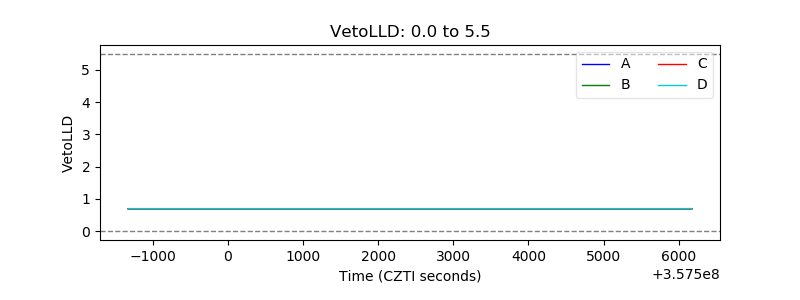 |
| Alpha Counter | 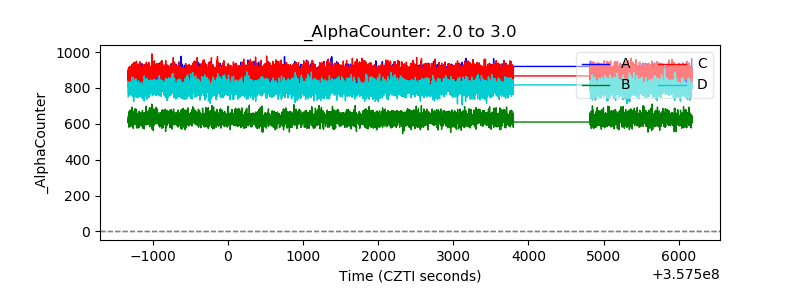 |
| _CPM_Rate | 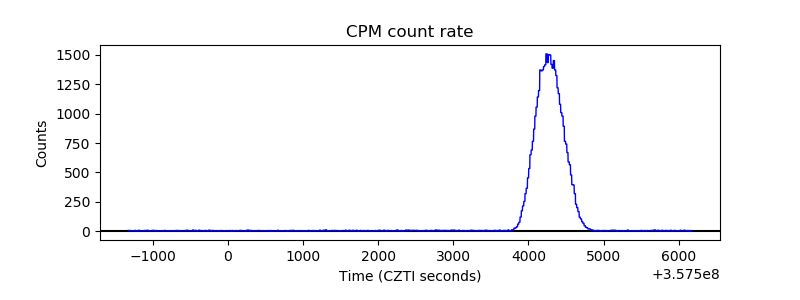 |
| CZT Counter | 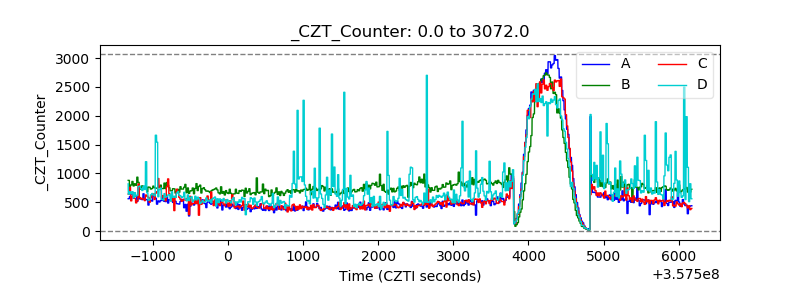 |
| +2.5 Volts monitor |  |
| +5 Volts monitor |  |
| _ROLL_ROT | 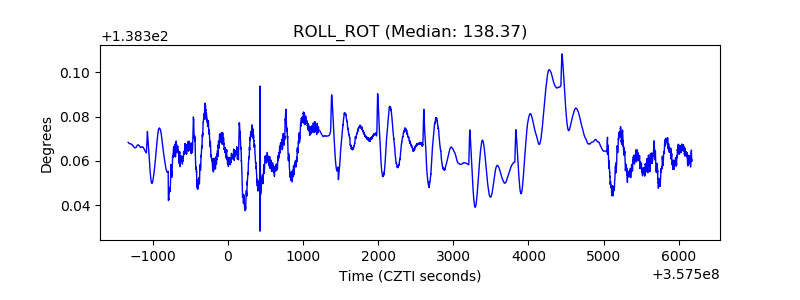 |
| _Roll_DEC | 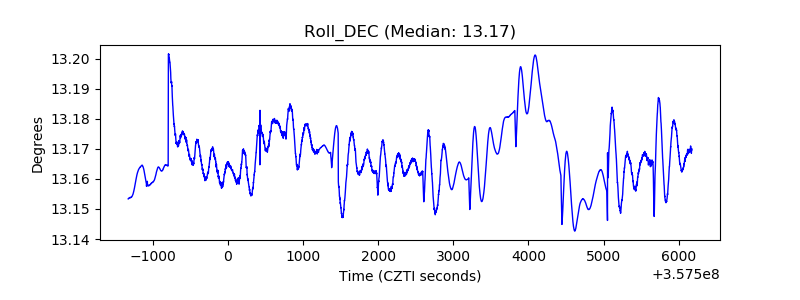 |
| _Roll_RA | 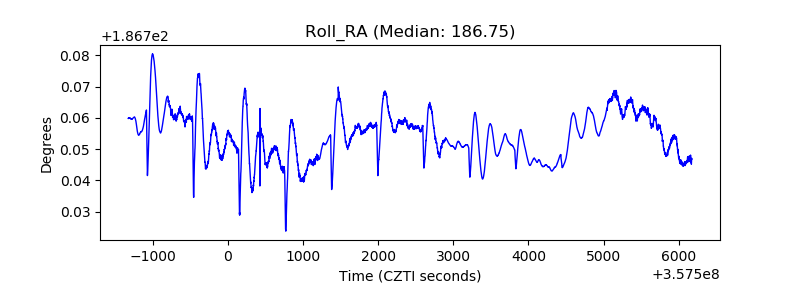 |
| Veto Counter | 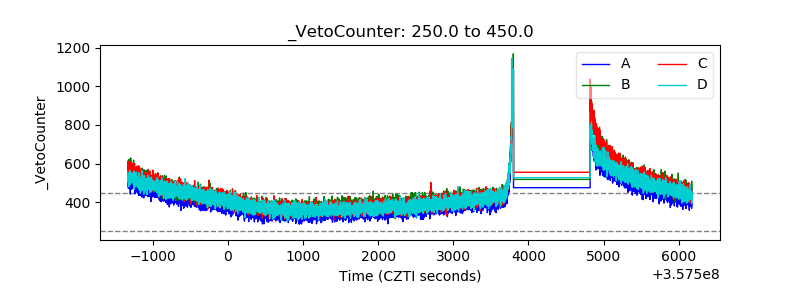 |