| Param | Original file | Final file |
|---|---|---|
| Filename | modeM0/AS1A10_071T16_9000004348_30222cztM0_level2.evt | modeM0/AS1A10_071T16_9000004348_30222cztM0_level2_quad_clean.evt |
| Size (bytes) | 556,957,440 | 96,203,520 |
| Size | 531.2 MB | 91.7 MB |
| Events in quadrant A | 3,208,788 | 636,524 |
| Events in quadrant B | 5,005,078 | 648,743 |
| Events in quadrant C | 3,537,689 | 615,048 |
| Events in quadrant D | 4,693,507 | 577,269 |
| Mode M0 | |||
|---|---|---|---|
| Quadrant | BADHDUFLAG | Total packets | Discarded packets |
| A | 0 | 13459 | 2 |
| B | 0 | 19078 | 4 |
| C | 0 | 14503 | 2 |
| D | 0 | 18043 | 2 |
| Mode M9 | |||
|---|---|---|---|
| Quadrant | BADHDUFLAG | Total packets | Discarded packets |
| A | 0 | 18 | 0 |
| B | 0 | 19 | 0 |
| C | 0 | 19 | 0 |
| D | 0 | 19 | 0 |
| Mode SS | |||
|---|---|---|---|
| Quadrant | BADHDUFLAG | Total packets | Discarded packets |
| A | 0 | 126 | 0 |
| B | 0 | 126 | 0 |
| C | 0 | 126 | 0 |
| D | 0 | 126 | 0 |
| Quadrant | Total seconds | Saturated seconds | Saturation percentage |
|---|---|---|---|
| A | 6249 | 60 | 0.960154% |
| B | 6248 | 101 | 1.616517% |
| C | 6248 | 104 | 1.664533% |
| D | 6248 | 262 | 4.193342% |
Noise dominated data is calculated using 1-second bins in cleaned event files. If a bin has >2000 counts, and if more than 50% of those come from <1% of pixels, then it is considered to be noise-dominated and hence unusable.
| Quadrant | # 1 sec bins | Bins with >0 counts | Bins with >2000 counts | High rate bins dominated by noise | Noise dominated (total time) | Noise dominated (detector-on time) | Marked lightcurve |
|---|---|---|---|---|---|---|---|
| A | 7524 | 6250 | 4 | 4 | 0.05% | 0.06% | 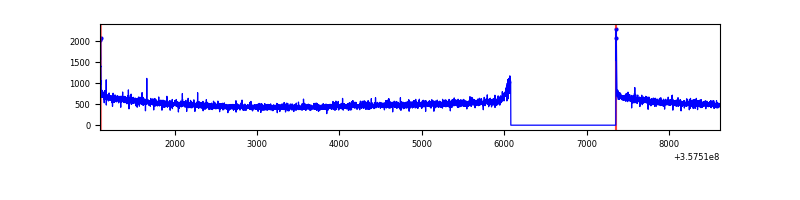 |
| B | 7523 | 6248 | 7 | 7 | 0.09% | 0.11% | 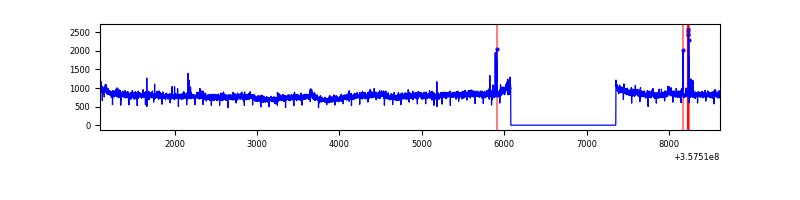 |
| C | 7523 | 6249 | 10 | 10 | 0.13% | 0.16% | 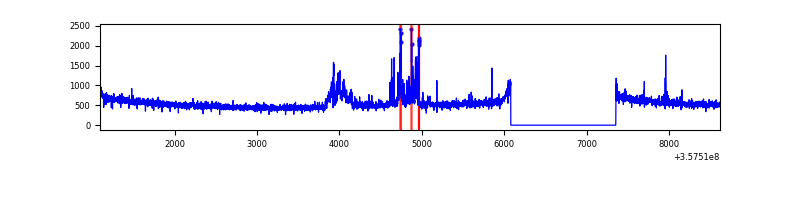 |
| D | 7523 | 6249 | 230 | 230 | 3.06% | 3.68% | 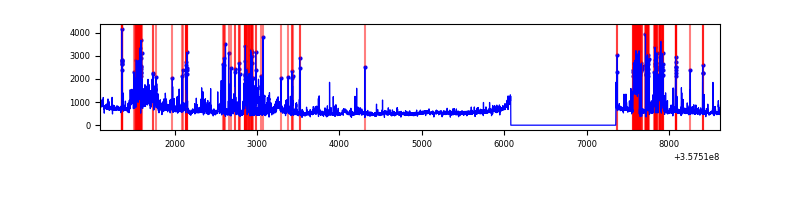 |
Top three noisy pixels from each quadrant. If the there are fewer than three noisy pixels in the level2.evt file, extra rows are filled as -1
| Pixel properties | Quadrant properties | ||||||
|---|---|---|---|---|---|---|---|
| Quadrant | DetID | PixID | Counts | Sigma | Mean | Median | Sigma |
| A | 8 | 192 | 24693 | 145.06 | 825 | 810 | 164.6 |
| A | 13 | 254 | 11364 | 64.1 | 825 | 810 | 164.6 |
| A | 3 | 137 | 8047 | 43.95 | 825 | 810 | 164.6 |
| B | 6 | 159 | 1742906 | 11327.0 | 820 | 802 | 153.8 |
| B | 10 | 247 | 22051 | 138.16 | 820 | 802 | 153.8 |
| B | 12 | 111 | 18858 | 117.4 | 820 | 802 | 153.8 |
| C | 3 | 233 | 284293 | 1528.84 | 793 | 799 | 185.4 |
| C | 14 | 238 | 132313 | 709.23 | 793 | 799 | 185.4 |
| C | 2 | 114 | 14746 | 75.21 | 793 | 799 | 185.4 |
| D | 1 | 52 | 871076 | 4683.52 | 778 | 763 | 185.8 |
| D | 12 | 227 | 354477 | 1903.48 | 778 | 763 | 185.8 |
| D | 8 | 195 | 258694 | 1388.03 | 778 | 763 | 185.8 |
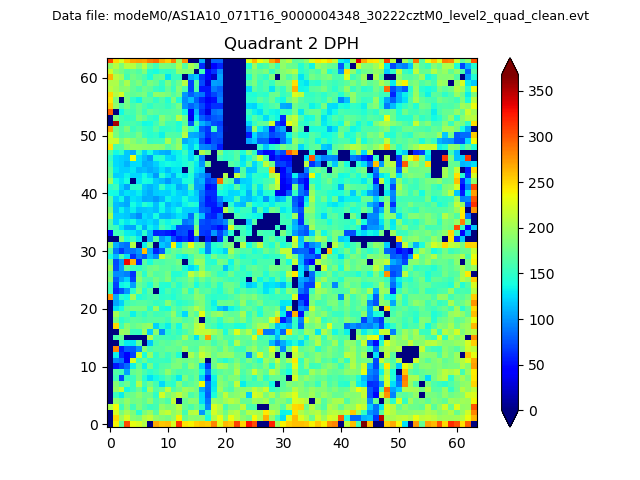
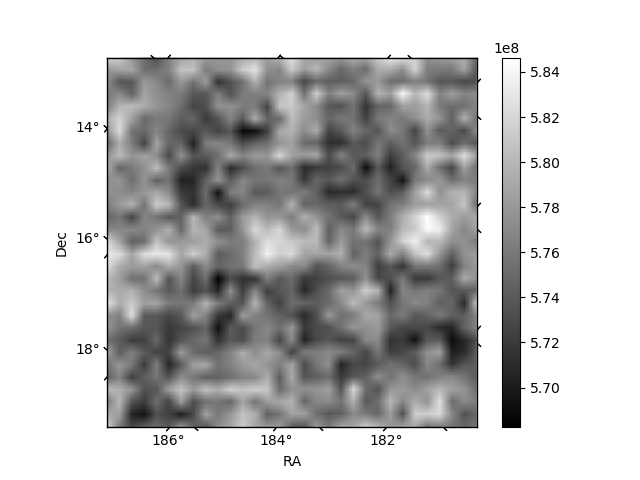
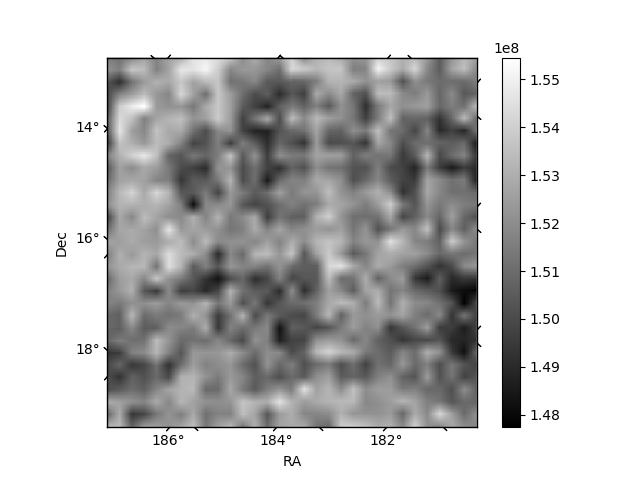
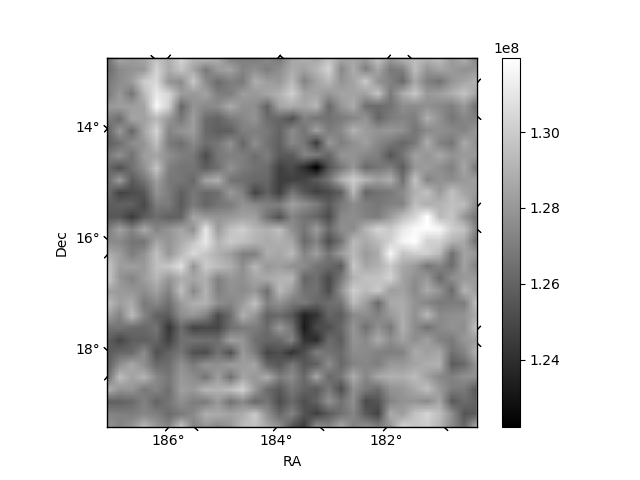
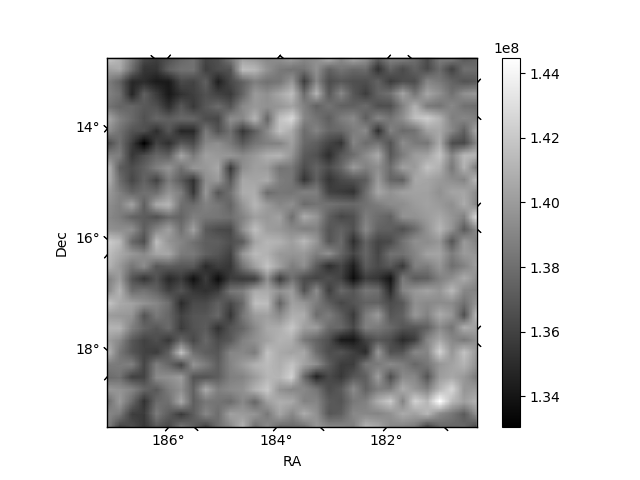
Histogram calculated using DETX and DETY for each event in the final _common_clean file
| Quadrant A | 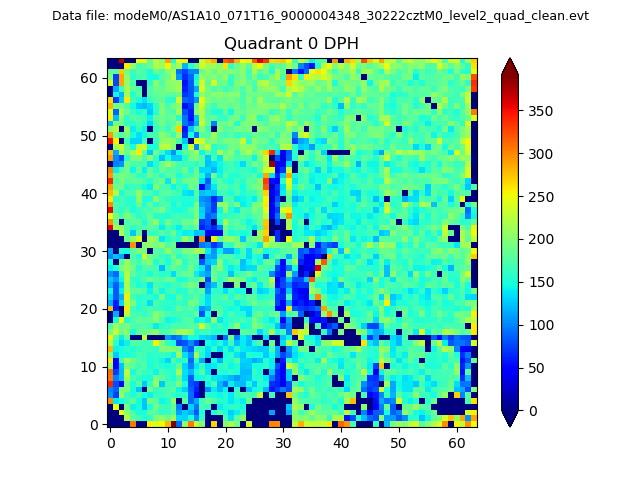 |
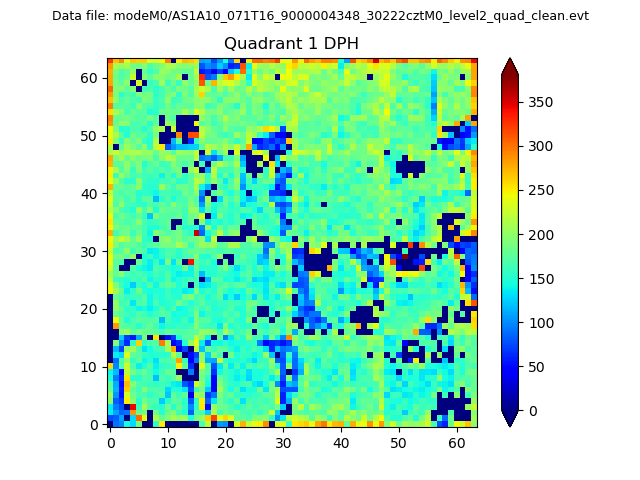 |
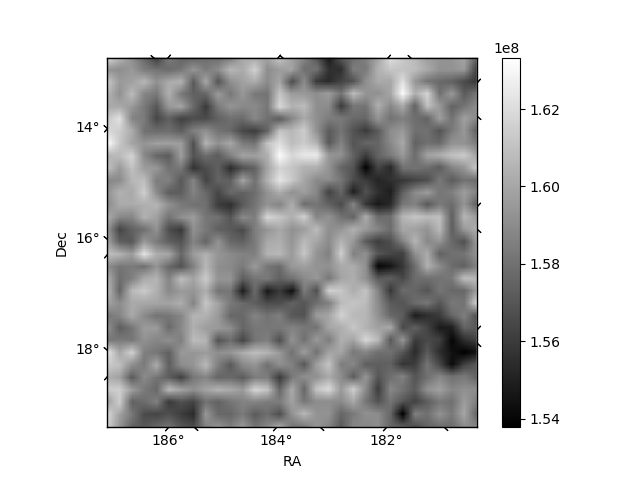
Quadrant B |
|---|---|---|---|
| Quadrant D | 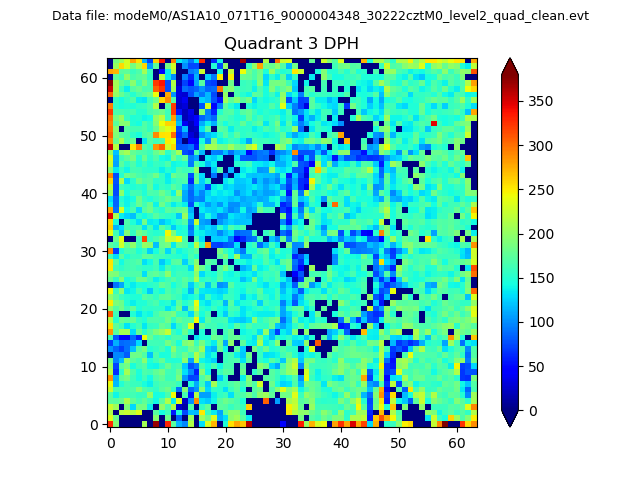 |
 |
Quadrant C |
| Plot type | Count rate plots | Images |
|---|---|---|
| Comparison with Poisson distribution Blue bars denote a histogram of data divided into 1 sec bins. Red curve is a Poisson curve with rate = median count rate of data. |
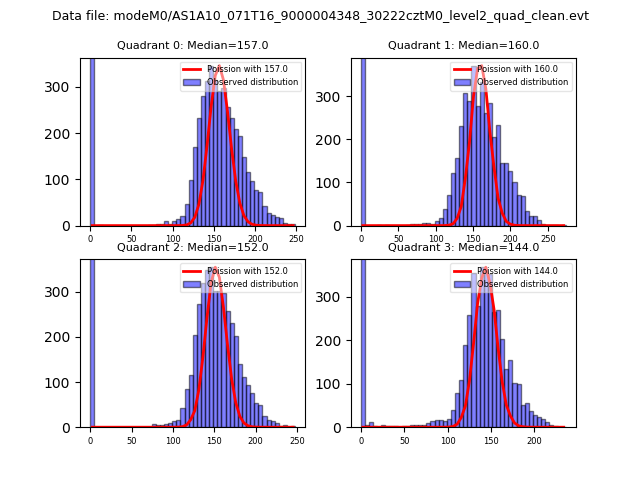 |
 |
| Quadrant-wise count rates Data is divided into 100 sec bins |
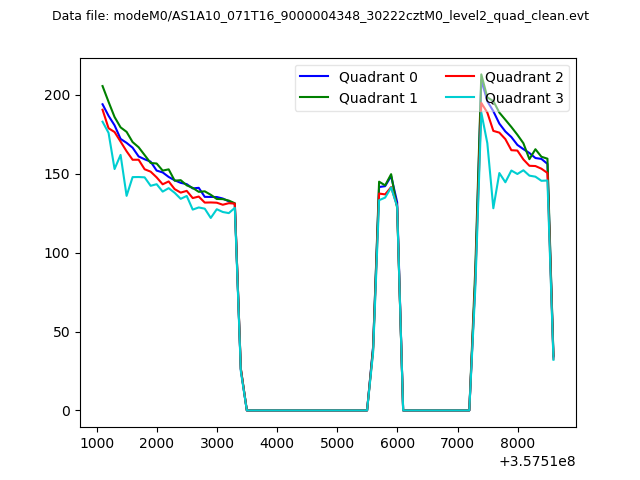 |
|
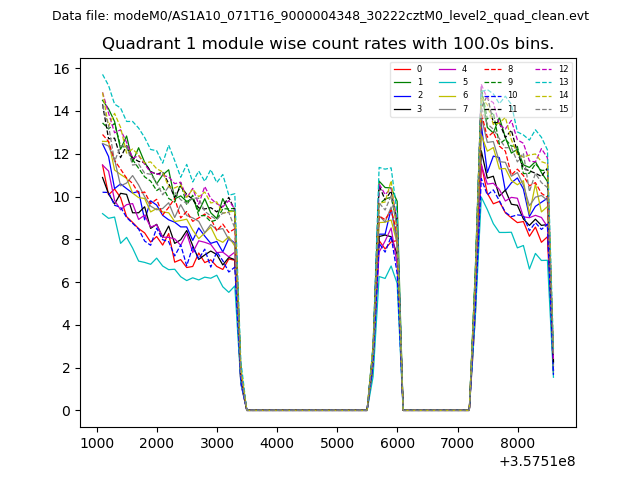
| Module-wise count rates for Quadrant A Data is divided into 100 sec bins |
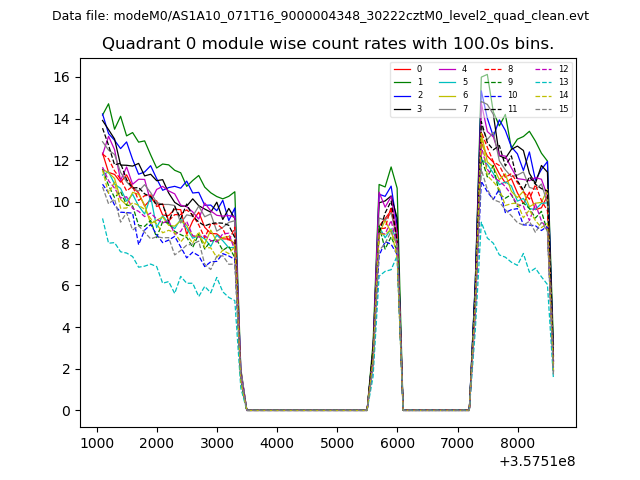 |
 |
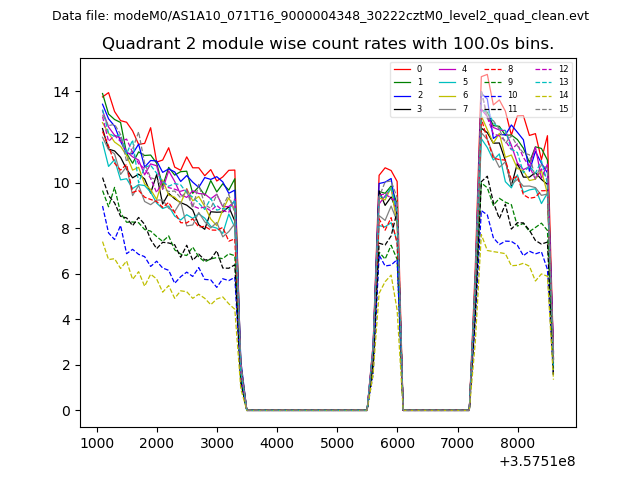
| Module-wise count rates for Quadrant B Data is divided into 100 sec bins |
 |
 |
| Module-wise count rates for Quadrant C Data is divided into 100 sec bins |
 |
 |
| Module-wise count rates for Quadrant D Data is divided into 100 sec bins |
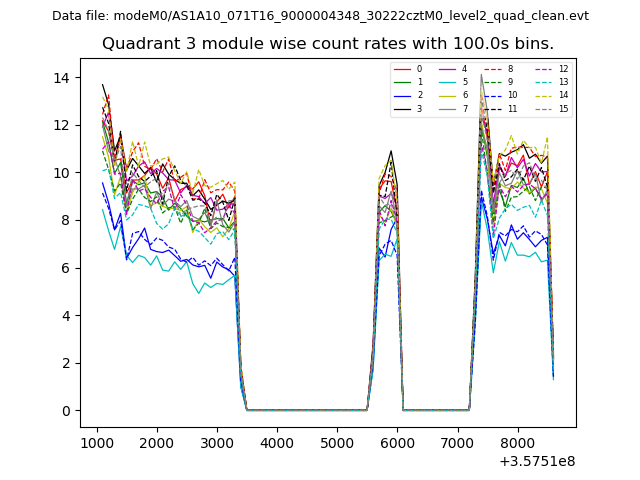 |
 |
| Parameter | Plot |
|---|---|
| CZT HV Monitor | 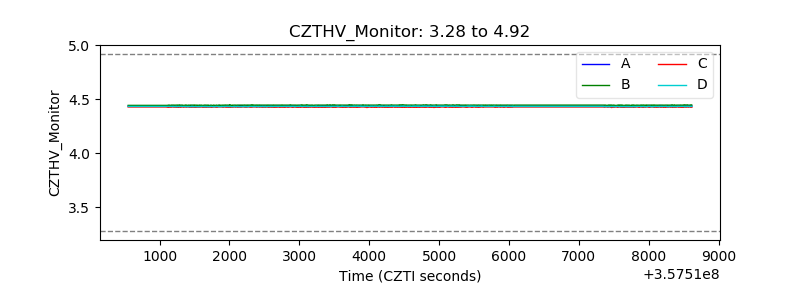 |
| D_VDD | 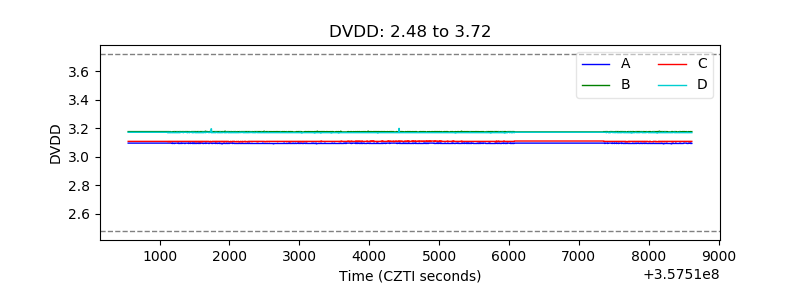 |
| Temperature 1 | 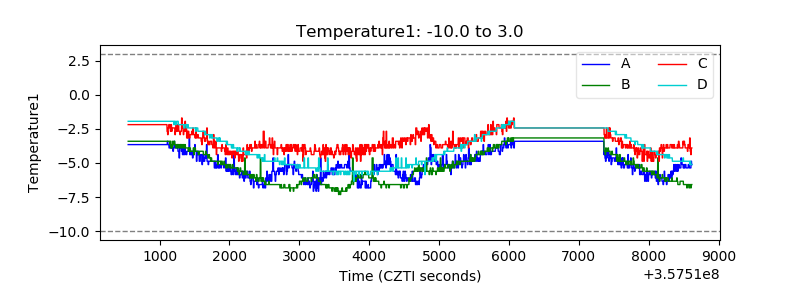 |
| Veto HV Monitor | 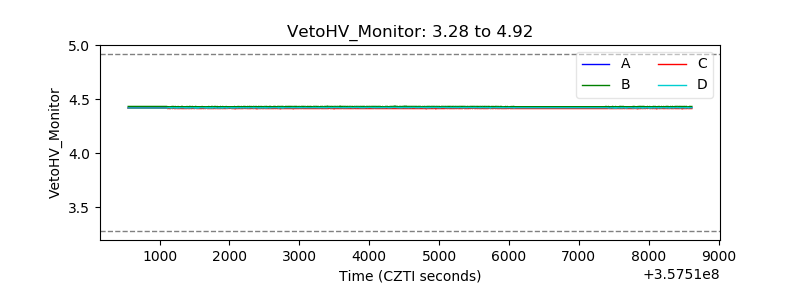 |
| Veto LLD | 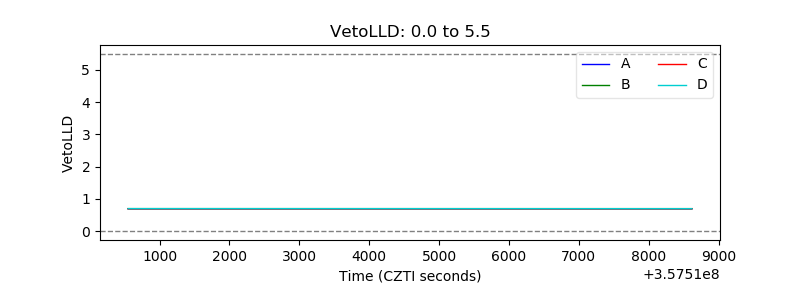 |
| Alpha Counter | 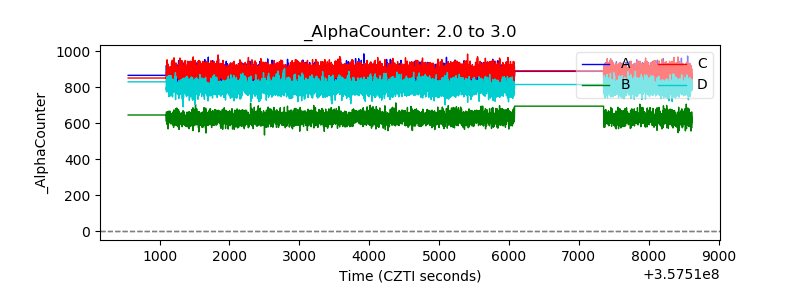 |
| _CPM_Rate | 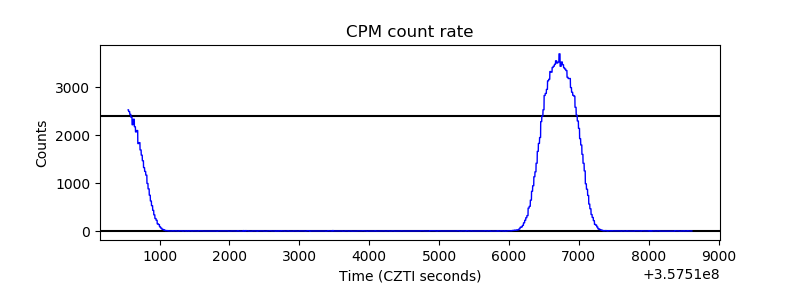 |
| CZT Counter | 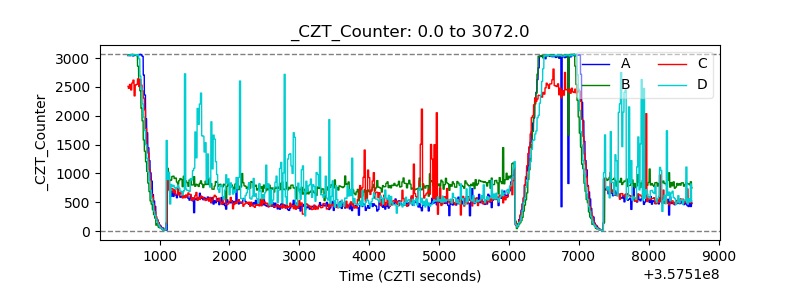 |
| +2.5 Volts monitor |  |
| +5 Volts monitor |  |
| _ROLL_ROT | 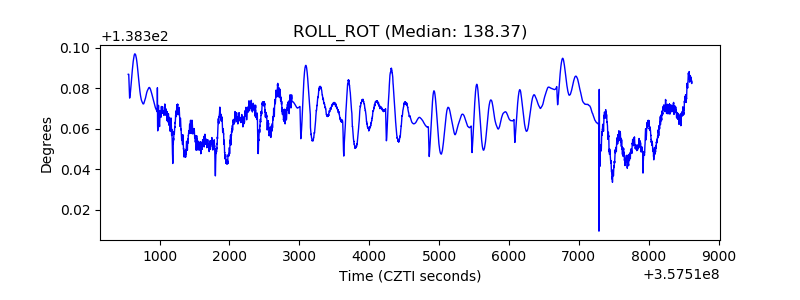 |
| _Roll_DEC | 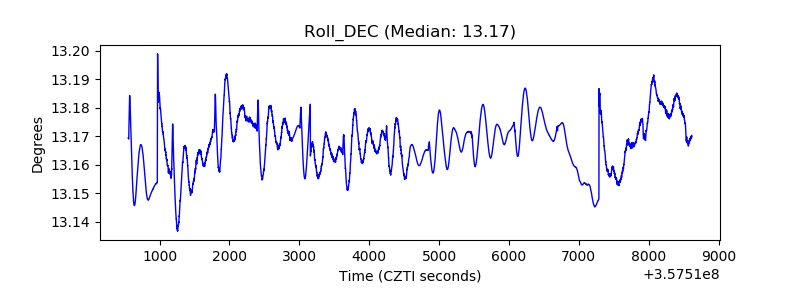 |
| _Roll_RA | 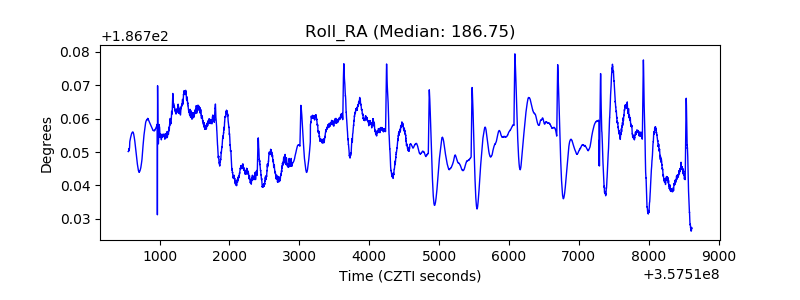 |
| Veto Counter | 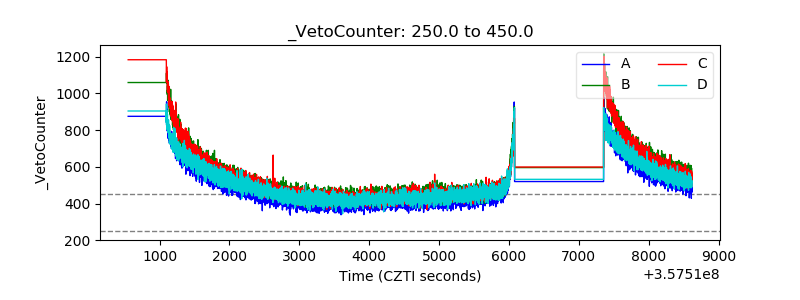 |